. 2021 Mar;22(3):16-26.
doi: 10.1002/acm2.13161. Epub 2021 Jan 10.

Spectral CT quantification stability and accuracy for pediatric patients: A phantom study

Affiliations

Spectral CT quantification stability and accuracy for pediatric patients: A phantom study

Nadav Shapira et al. J Appl Clin Med Phys. 2021 Mar.

Abstract

Background: Spectral computed tomography (spectral CT) provides access to clinically relevant measures of endogenous and exogenous materials in patients. For pediatric patients, current spectral CT applications include lesion characterization, quantitative vascular imaging, assessments of tumor response to treatment, and more.

Objective: The aim of this study is a comprehensive investigation of the accuracy and stability of spectral quantifications from a spectral detector-based CT system with respect to different patient sizes and radiation dose levels relevant for the pediatric population.

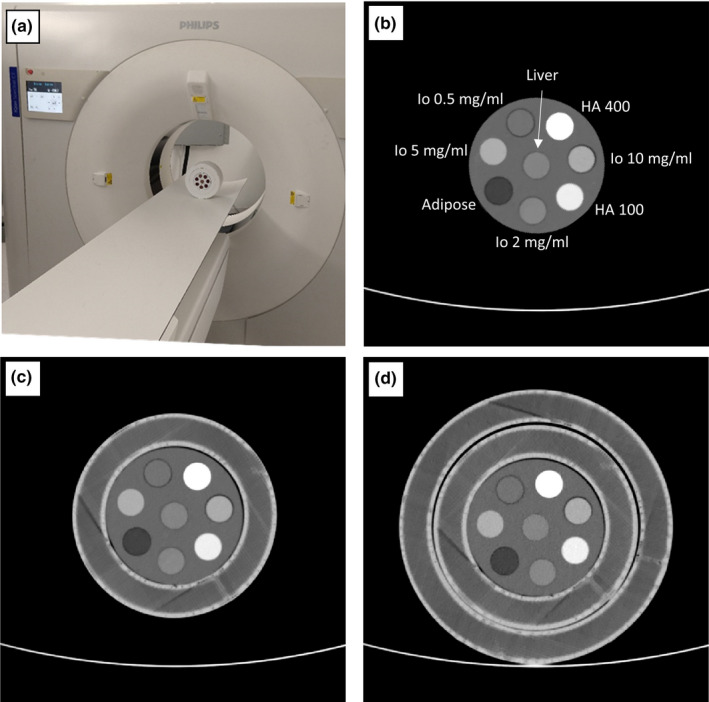
Materials and methods: A spectral CT phantom with tissue-mimicking materials and iodine concentrations relevant for pediatric imaging was scanned on a spectral detector CT system using a standard pediatric abdominal protocol at 100%, 67%, 33% and 10% of the nominal radiation dose level. Different pediatric patient sizes were simulated using supplemental 3D-printed extension rings. Virtual mono-energetic, iodine density, effective atomic number, and electron density results were analyzed for stability with respect to radiation dose and patient size.

Results: Compared to conventional CT imaging, a pronounced improvement in the stability of attenuation measurements across patient size was observed when using virtual mono-energetic images. Iodine densities were within 0.1 mg/ml, effective atomic numbers were within 0.26 atomic numbers and electron density quantifications were within ±1.0% of their respective nominal values. Relative to the nominal dose clinical protocol, differences in attenuation of all tissue-mimicking materials were maintained below 1.6 HU for a 33% dose reduction, below 2.7 HU for a 67% dose reduction and below 3.7 HU for a 90% dose reduction, for all virtual mono-energetic energies equal to or greater than 50 keV. Iodine, and effective atomic number quantifications were stable to within 0.1 mg/ml and 0.06 atomic numbers, respectively, across all measured dose levels.

Conclusion: Spectral CT provides accurate and stable material quantification with respect to radiation dose reduction (up to 90%) and differing pediatric patient size. The observed consistency is an important step towards quantitative pediatric imaging at low radiation exposure levels.

Keywords: dual energy CT; pediatric imagining; quantitative imaging; spectral CT.


Conflict of interest statement

The authors declare no conflict of interest.

Figures

FIG. 1
FIG. 1
70 keV virtual mono‐energetic images results of the spectral CT pediatric phantom used to evaluate spectral accuracy as a function of patient size and radiation dose. (a) Photograph of the scanner and phantom, with both 15 and 20 cm extension rings, which were used in our study. The 10 cm diameter insert (b) contains eight different tissue‐mimicking and iodine density rods. The insert was scanned within two extension rings that have outer diameters of 15 cm (c) and 20 cm (d) to evaluate the size dependency of various spectral results. Window Level/Window Width = 50/500.
FIG. 2
FIG. 2
Conventional CT and 70 keV virtual mono‐energetic images (VMI) measured mean HU values of the eight material rods as a function of phantom/patient size. Scans were performed with the nominal pediatric abdomen protocol (100 mAs). Left: quantification results, in [HU], averaged over 78 slices from three repetitive scans for each phantom/patient size. Right: differences in the quantification results from the size‐averaged HU value calculated per each material rod and per each result. A significantly increased size stability (independence) is observed for the 70 keV VMI result, as compared to the conventional result.
FIG. 3
FIG. 3
Conventional CT and 67 keV virtual mono‐energetic images (VMI) spectral result mean HU values of the eight material rods as a function of phantom/patient size. Scans were performed with the nominal pediatric abdomen protocol (100 mAs). The 67 keV VMI result was found to present the closest size‐averaged HU values to those of the conventional result. Left: quantification results. Right: differences in the quantification results from the size‐averaged HU value. Similar to the 70 keV VMI spectral results, a significantly increased size stability (independence) is observed for the 67 keV VMI result, as compared to the conventional result.
FIG. 4
FIG. 4
Dose dependency results for the 70 keV virtual mono‐energetic images (VMI) results. (a) Average HU values relative to those measured using the clinical protocol at 67%, 33% and 10% radiation dose of the clinical protocol (9 mGy, 100 mAs at 120 kVp). (b) Corresponding change in standard deviation (STD) relative to the standard deviation values measured using the clinical protocol.
FIG. 5
FIG. 5
Size and radiation dose stability of the iodine density spectral result. (a) Average iodine density values, in [mg/ml], for four different iodine concentrations. Scans were performed for three different phantom/patient sizes and at four different dose levels). (b) Average iodine concentration values, relative to those measured using the clinical protocol, at 67%, 33% and 10% radiation dose of the clinical protocol (9 mGy, 100 mAs at 120 kVp). (c) Corresponding change in standard deviation (STD) relative to the standard deviation values measured using the clinical protocol.
FIG. 6
FIG. 6
Size and radiation dose stability of the Z‐effective spectral result. (a) Average effective atomic number values for four different tissue‐mimicking materials. Scans were performed for three different phantom/patient sizes and at four different dose levels). (b) Average effective atomic number values, relative to those measured using the clinical protocol, at 67%, 33% and 10% radiation dose of the clinical protocol (9 mGy, 100 mAs at 120 kVp). (c) Corresponding change in standard deviation (STD) relative to the standard deviation values measured using the clinical protocol.
FIG. 7
FIG. 7
Size and radiation dose stability of the electron density spectral result. (a) Average electron density values, in [%EDwater], for four different tissue‐mimicking materials. Scans were performed for three different phantom/patient sizes and at four different dose levels. Black error bars indicate the nominal value for each material rod including deviations due to physical density uncertainties. (b) Average electron density values, relative to those measured using the clinical protocol, at 67%, 33% and 10% radiation dose of the clinical protocol (9 mGy, 100 mAs at 120 kVp). (c) Corresponding change in standard deviation (STD) relative to the standard deviation values measured using the clinical protocol.
FIG. 8
FIG. 8
Size and radiation dose stability of the 40 keV virtual mono‐energetic images (VMI) spectral result. (a) Average 40 keV VMI values, in [HU], for four different tissue‐mimicking materials. Scans were performed for three different phantom/patient sizes and at four different dose levels. Black error bars indicate the nominal value for each material rod including deviations due to physical density uncertainties. (b) Average HU values, relative to those measured using the clinical protocol, at 67%, 33% and 10% radiation dose of the clinical protocol (9 mGy, 100 mAs at 120 kVp). (c) Corresponding change in standard deviation (STD) relative to the standard deviation values measured using the clinical protocol.

Similar articles

Cited by

References

    1. Alvarez RE, Macovski A. Energy‐selective reconstructions in X‐ray computerised tomography. Phys Med Biol. 1976;21:002. - PubMed
    1. Flohr TG, McCollough CH, Bruder H, et al. First performance evaluation of a dual‐source CT (DSCT) system. Eur Radiol. 2006;16:256–268. - PubMed
    1. Caruso D, De Cecco CN, Schoepf UJ, et al. Can dual‐energy computed tomography improve visualization of hypoenhancing liver lesions in portal venous phase? Assessment of advanced image‐based virtual monoenergetic images. Clin Imaging. 2017;41:118–124. - PubMed
    1. Wang Q, Shi G, Qi X, Fan X, Wang L. Quantitative analysis of the dual‐energy CT virtual spectral curve for focal liver lesions characterization. Eur J Radiol. 2014;83:1759–1764. - PubMed
    1. Ehn S, Sellerer T, Muenzel D, et al. Assessment of quantification accuracy and image quality of a full‐body dual‐layer spectral CT system. J. Appl Clin Med Phys. 2018;19:204–217. - PMC - PubMed