. 2020 Dec;37(3):59-75.
doi: 10.1080/02656736.2020.1776901.

Systemically delivered antibody-labeled magnetic iron oxide nanoparticles are less toxic than plain nanoparticles when activated by alternating magnetic fields

Affiliations

Systemically delivered antibody-labeled magnetic iron oxide nanoparticles are less toxic than plain nanoparticles when activated by alternating magnetic fields

Chun-Ting Yang et al. Int J Hyperthermia. 2020 Dec.

Abstract

Objective: Toxicity from off-target heating with magnetic hyperthermia (MHT) is generally assumed to be understood. MHT research focuses on development of more potent heating magnetic iron oxide nanoparticles (MIONs), yet our understanding of factors that define biodistribution following systemic delivery remains limited. Preclinical development relies on mouse models, thus understanding off-target heating with MHT in mice provides critical knowledge for clinical development.

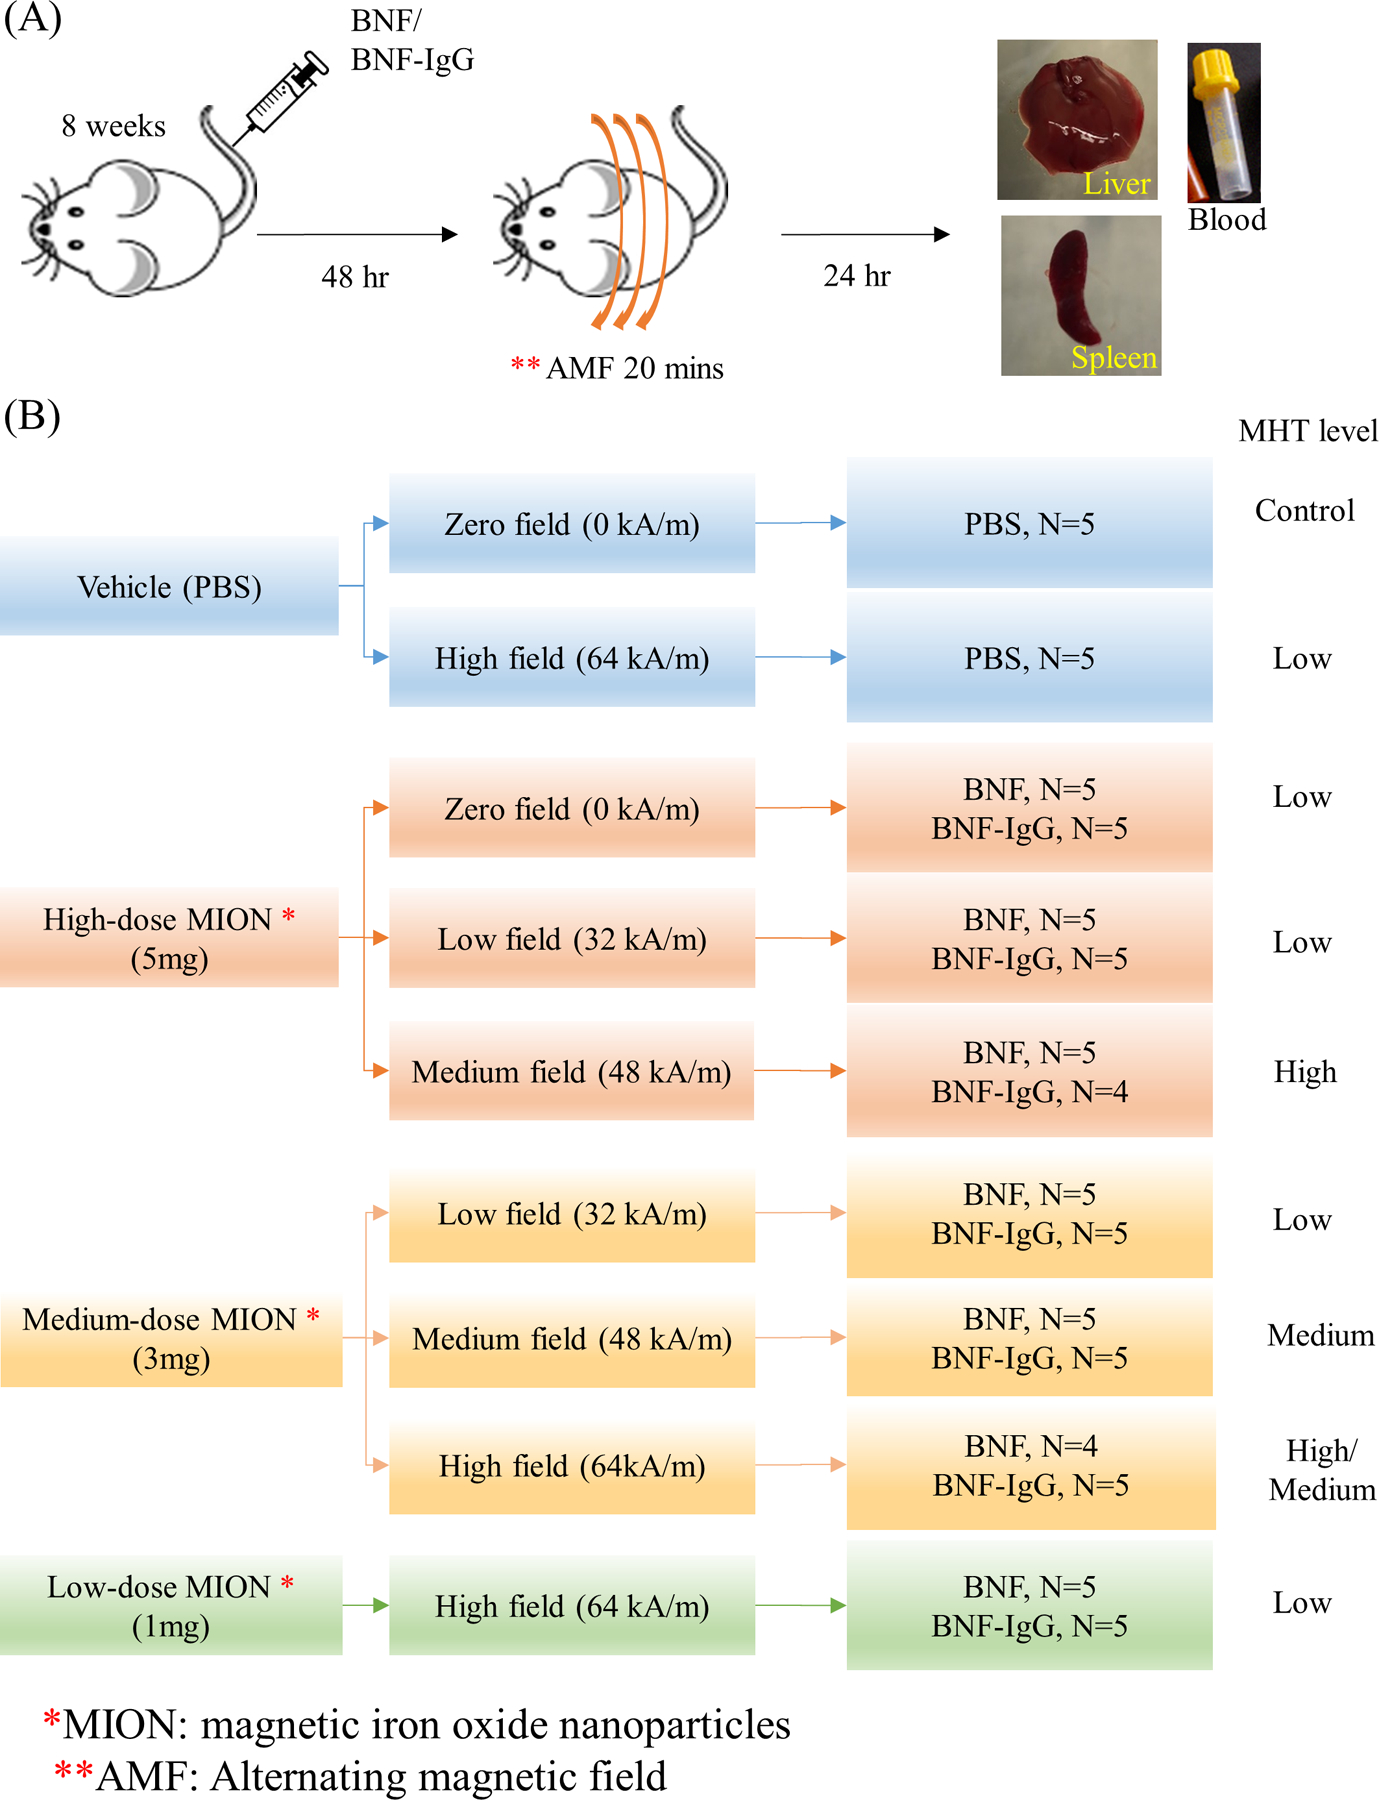
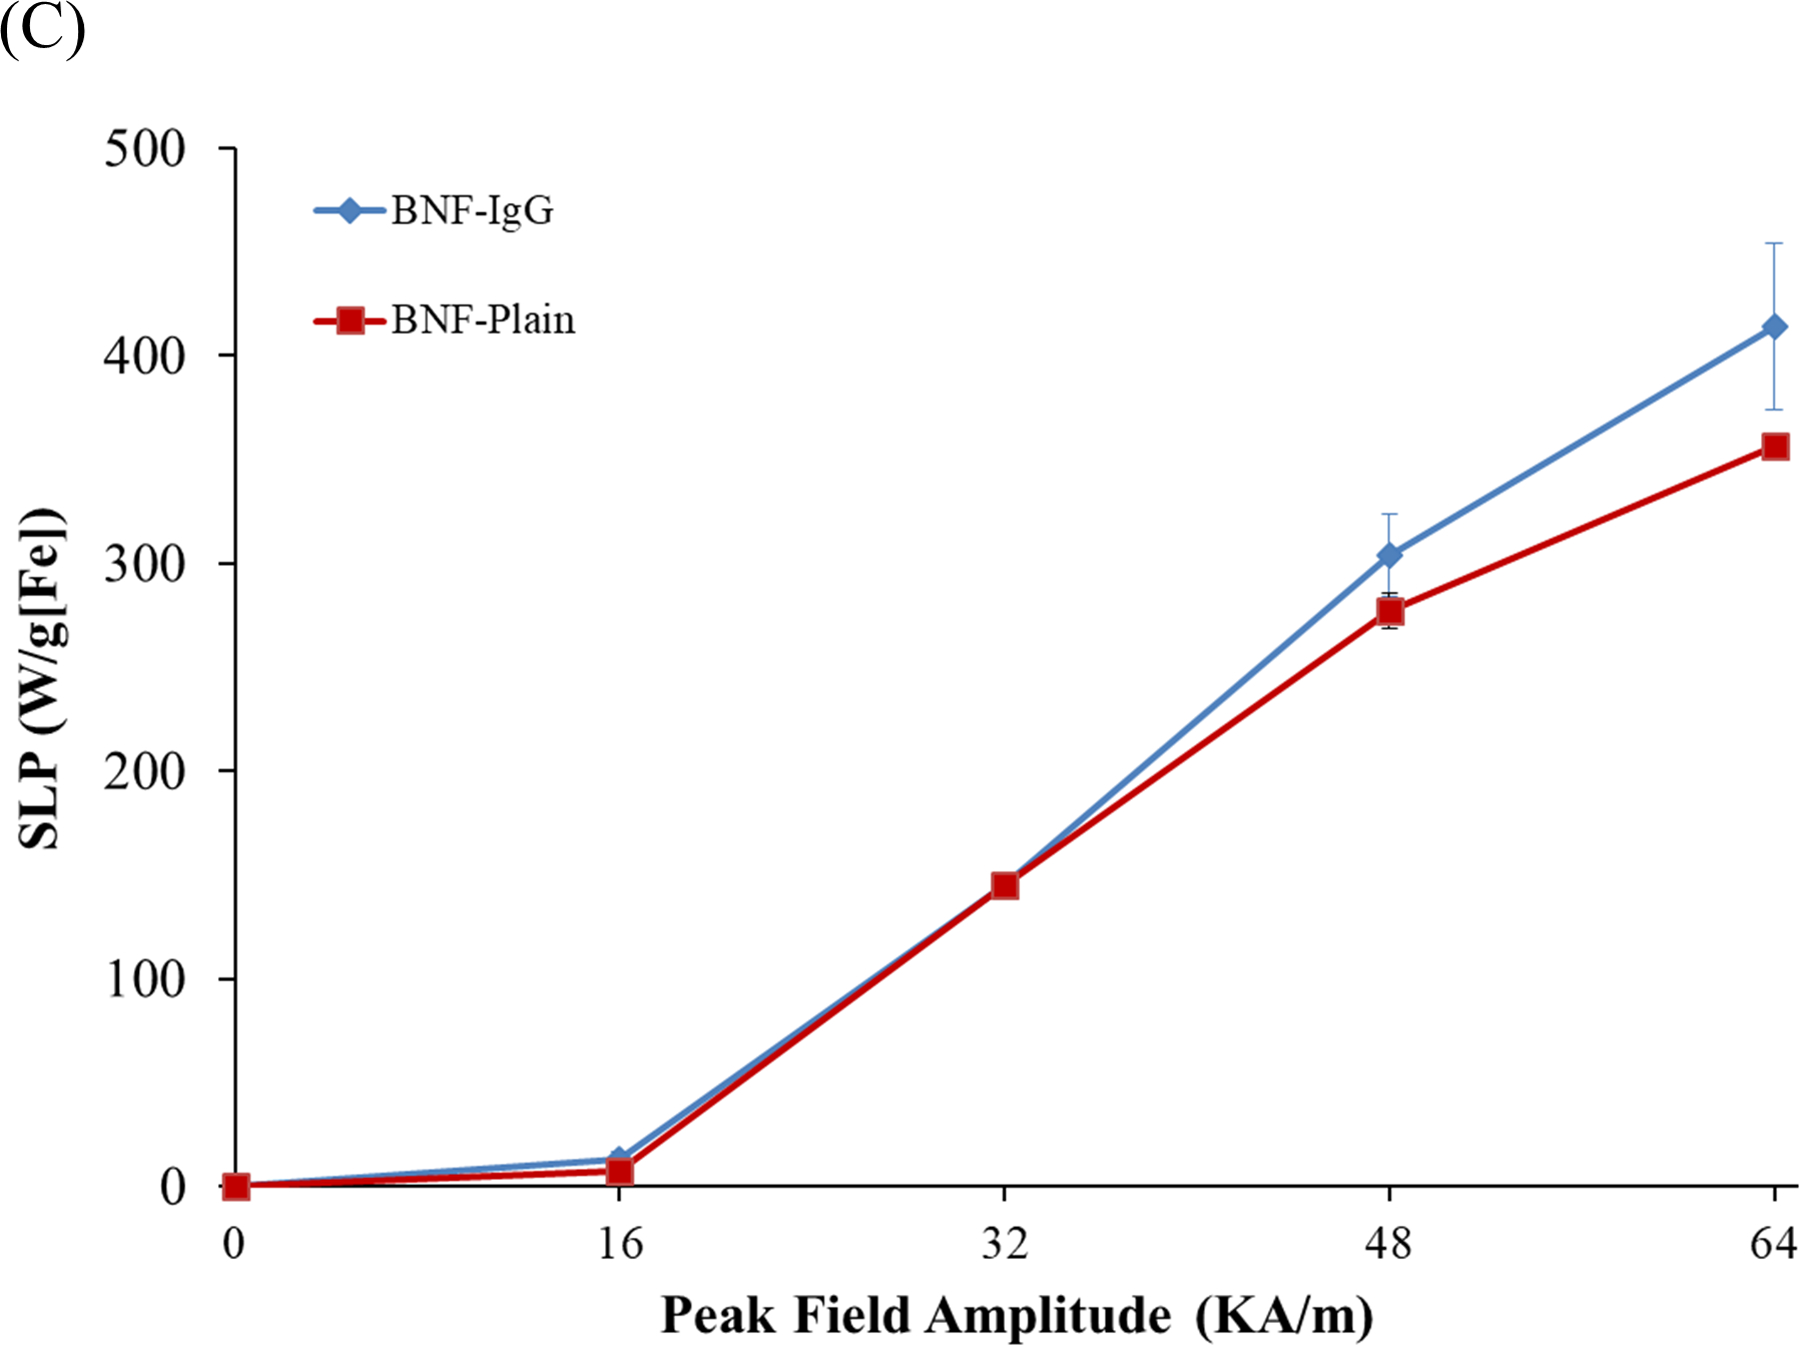
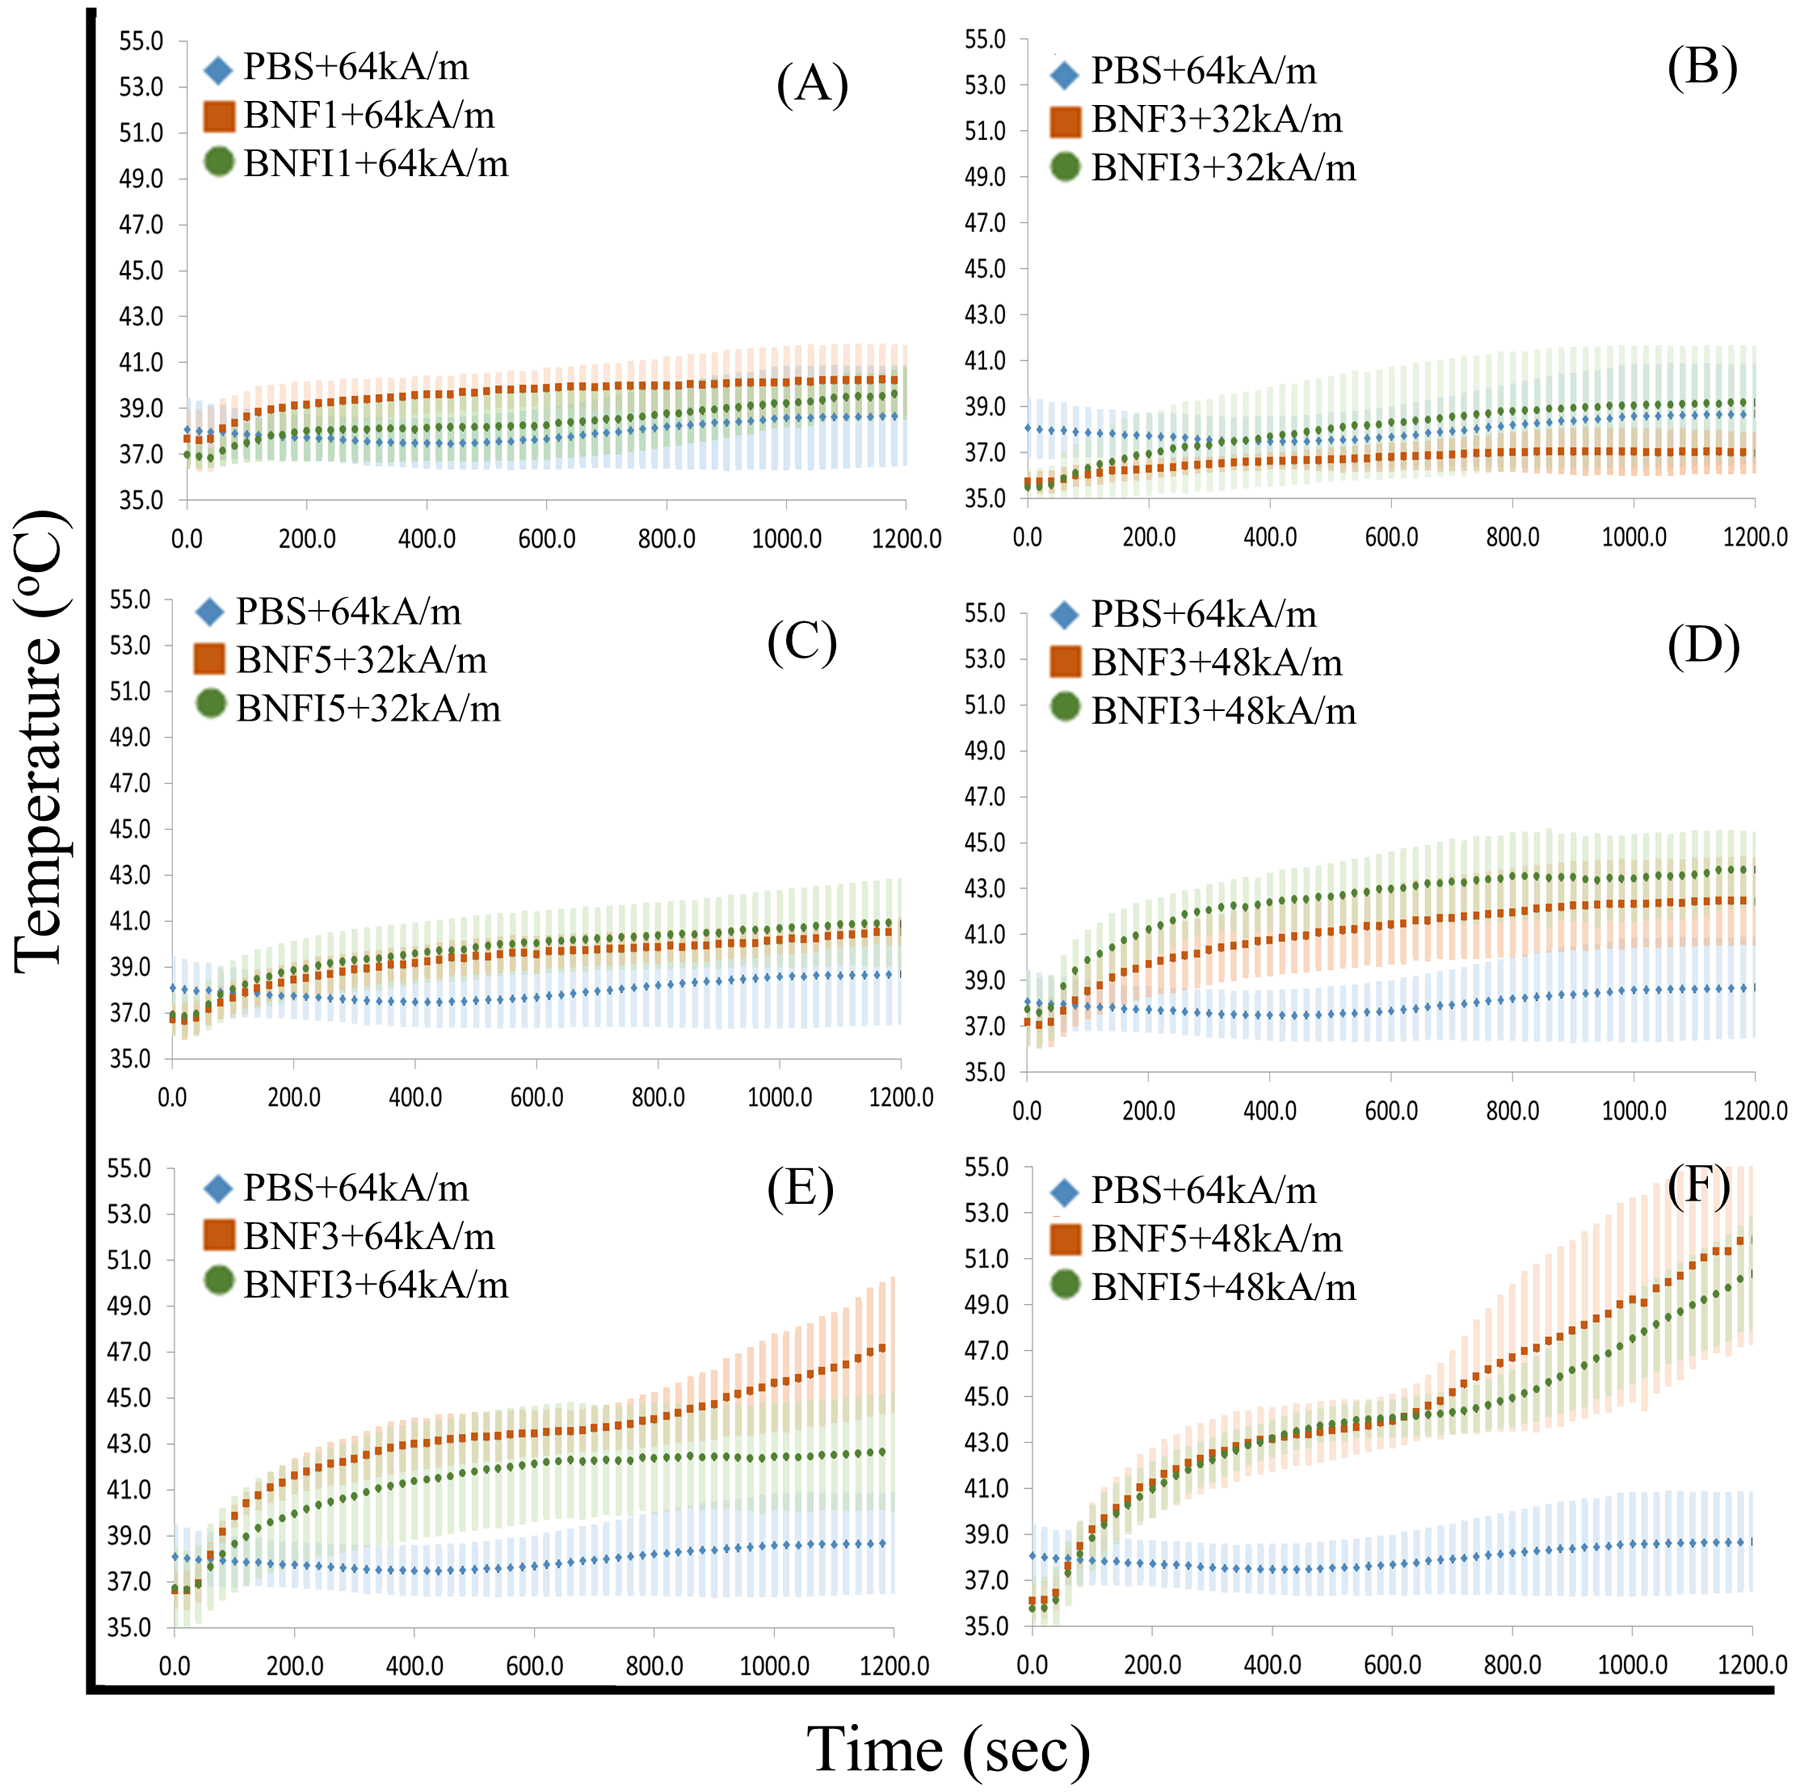
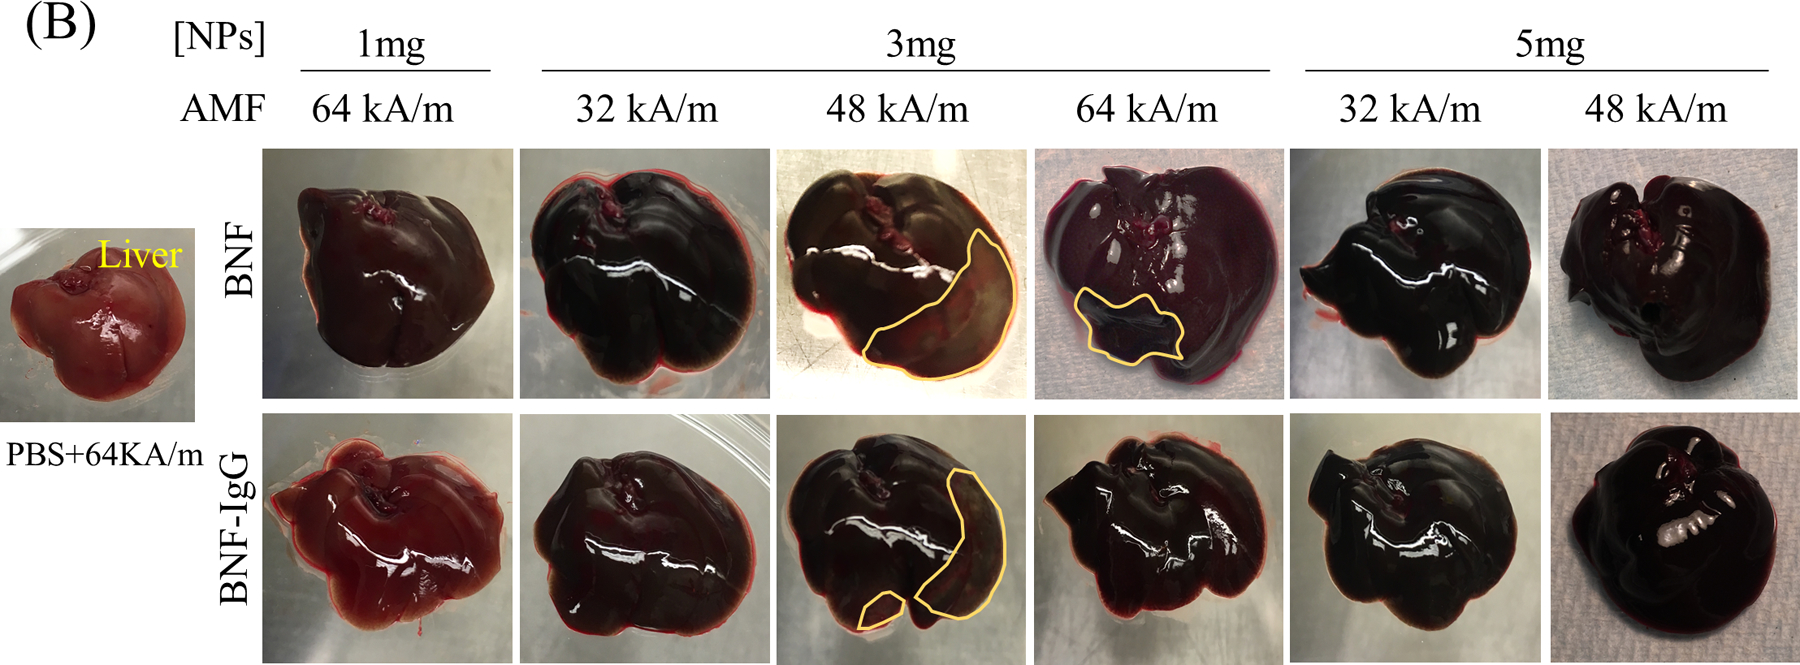
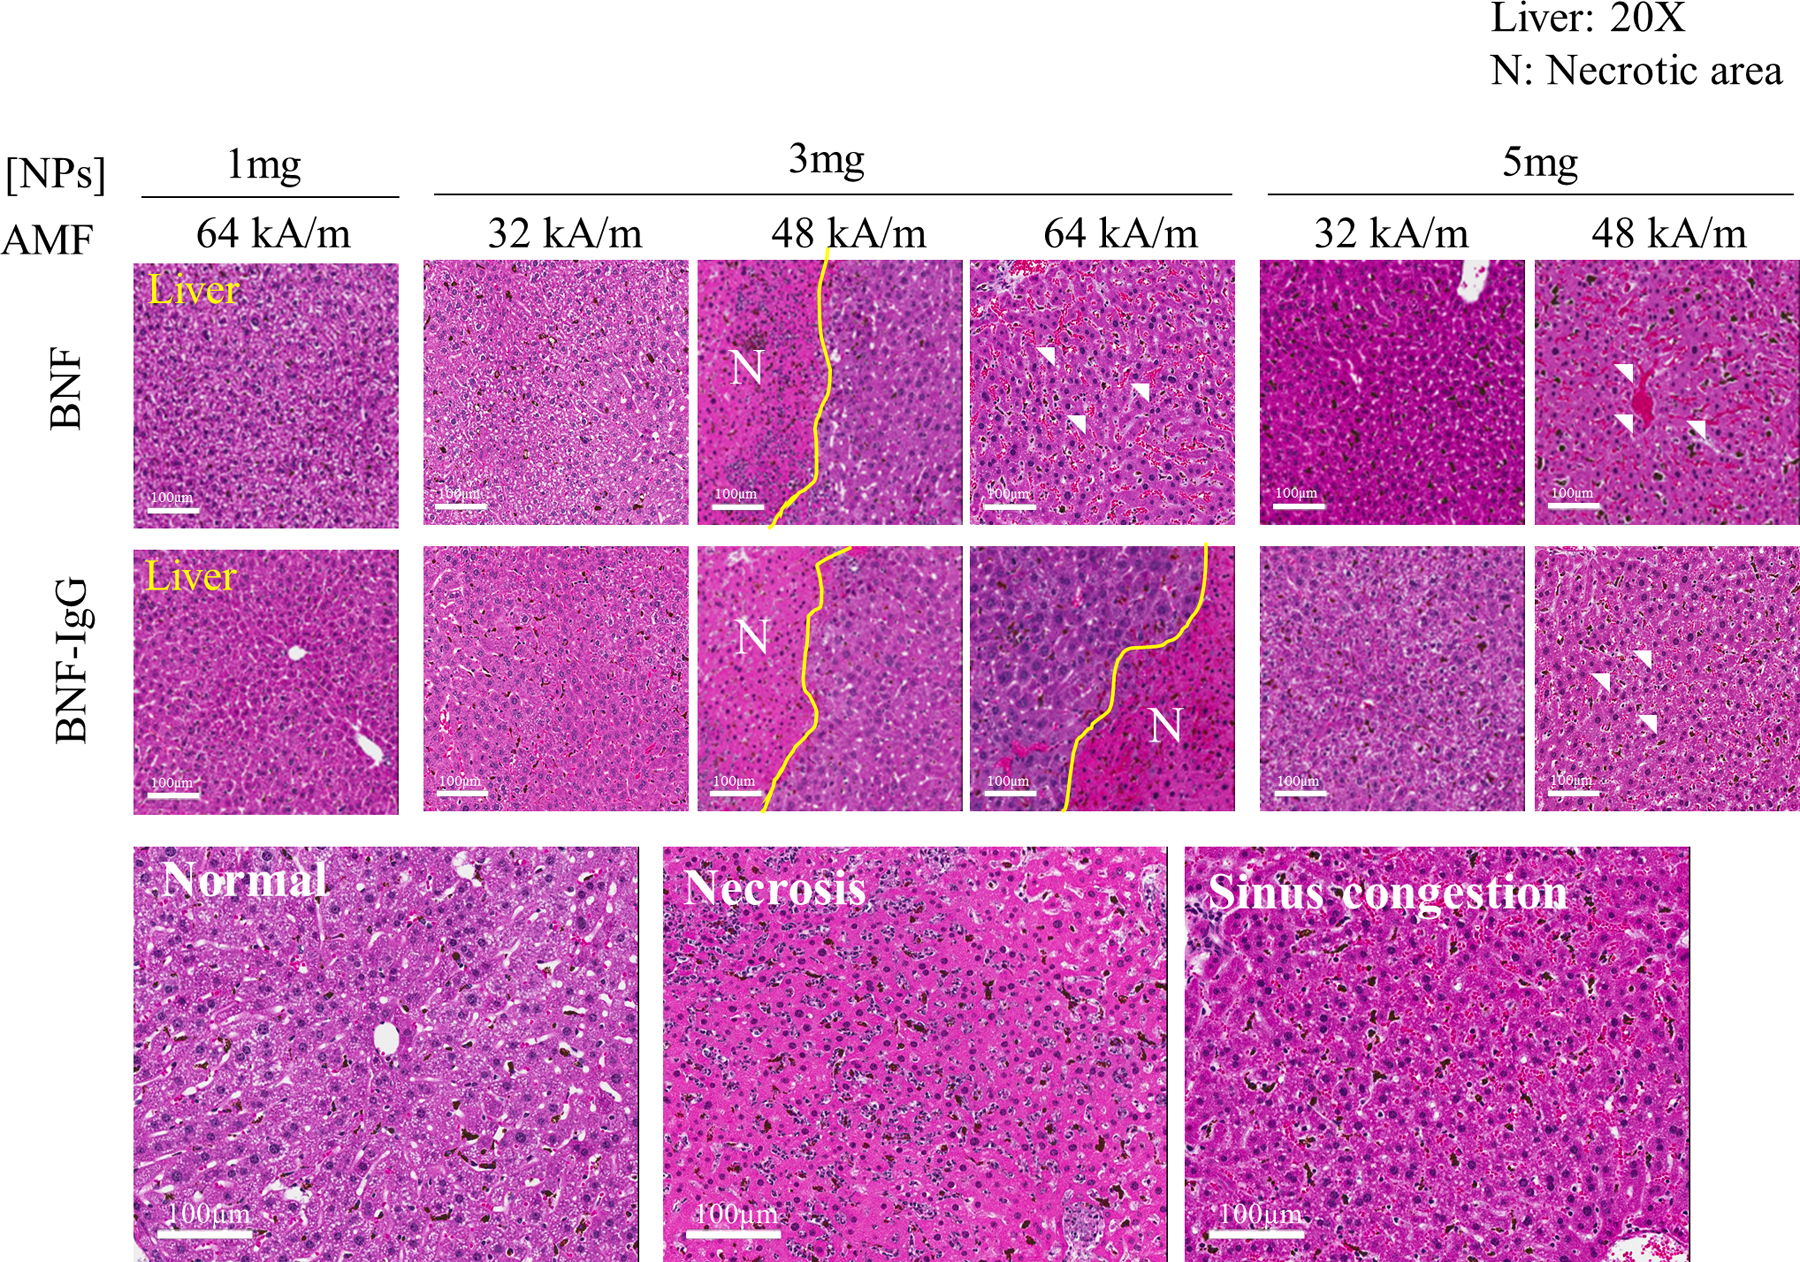
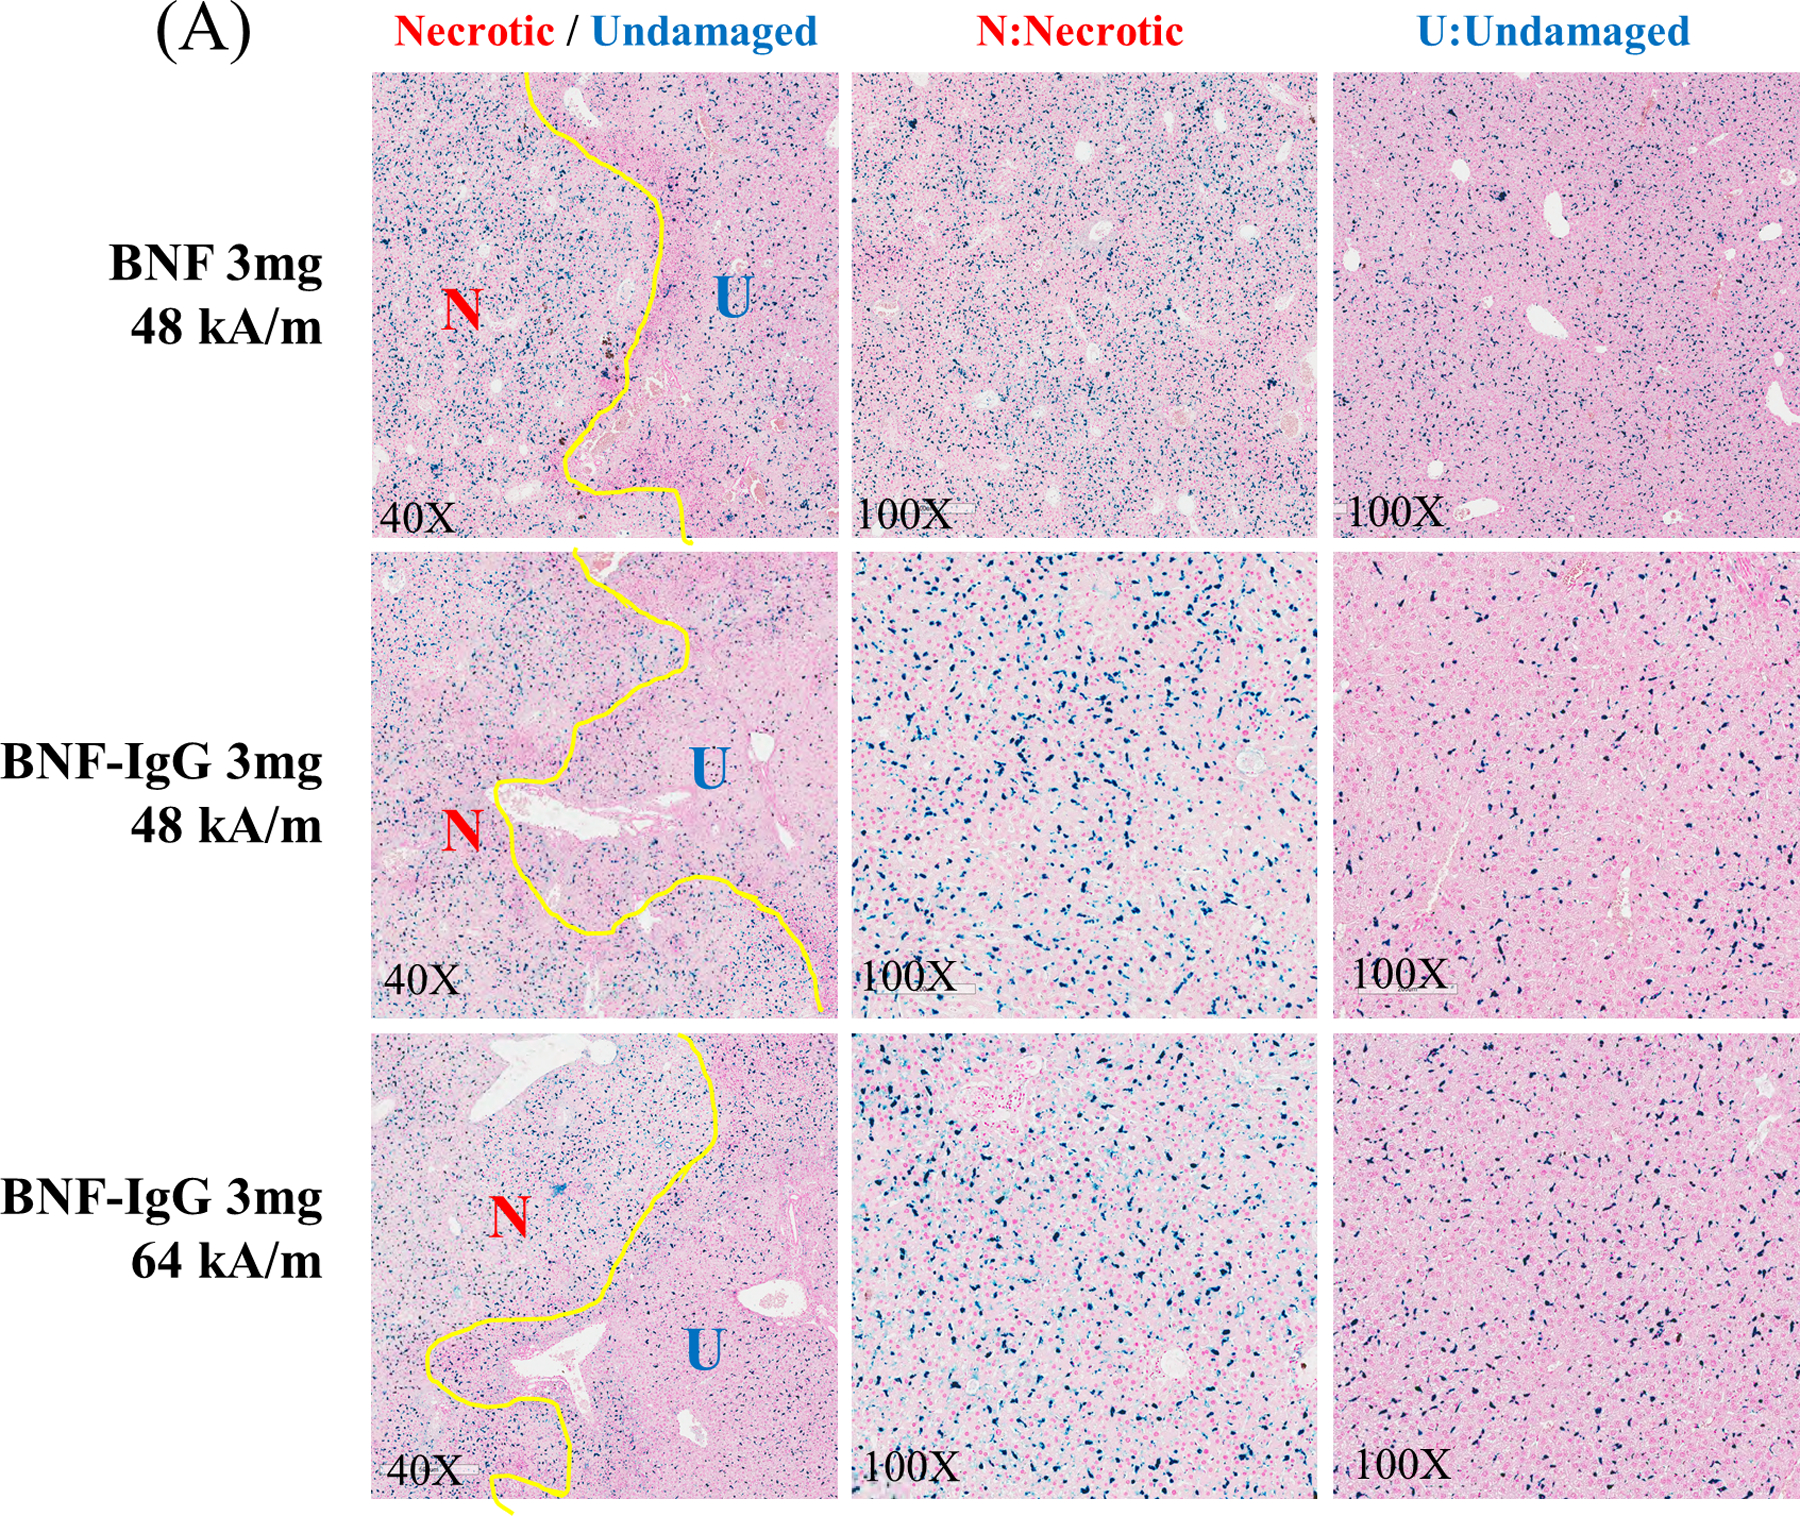
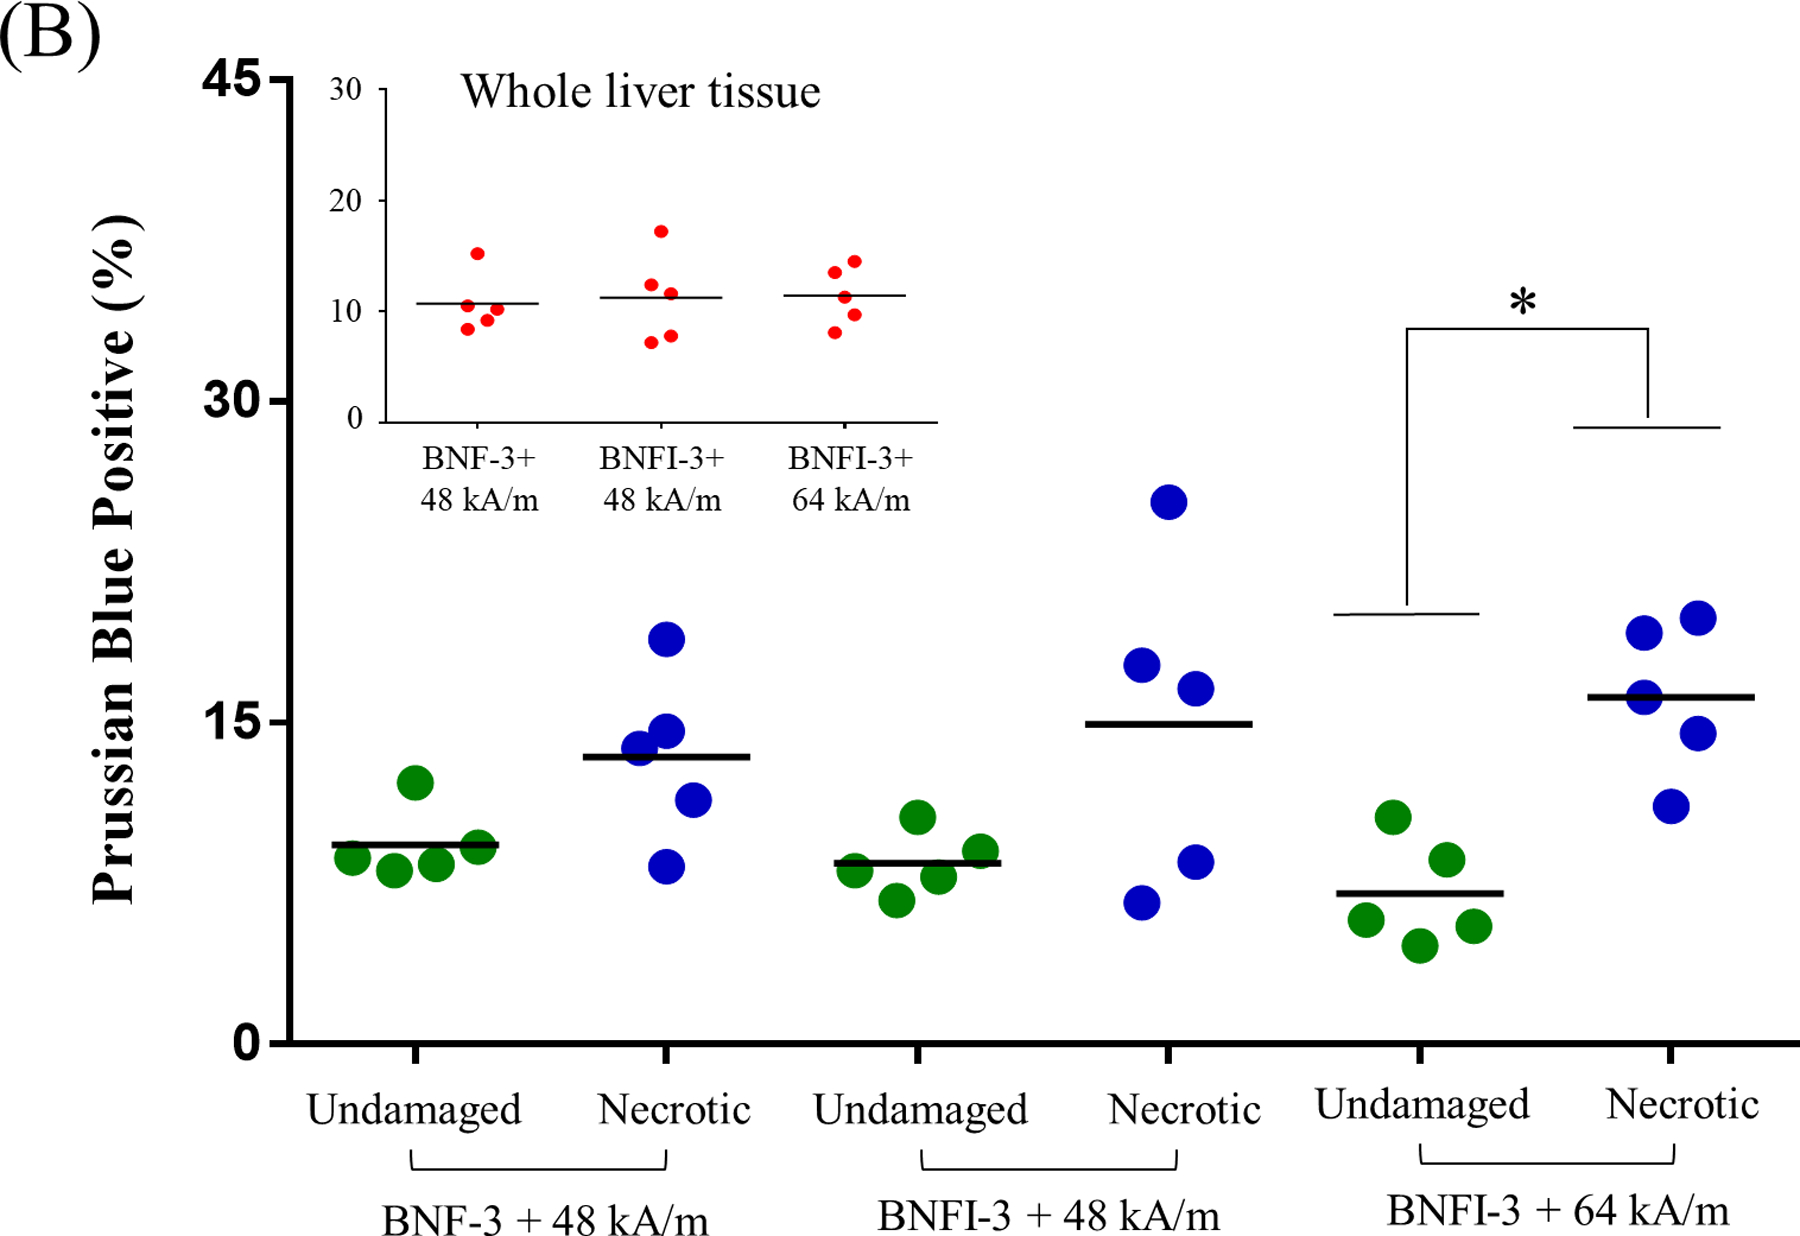
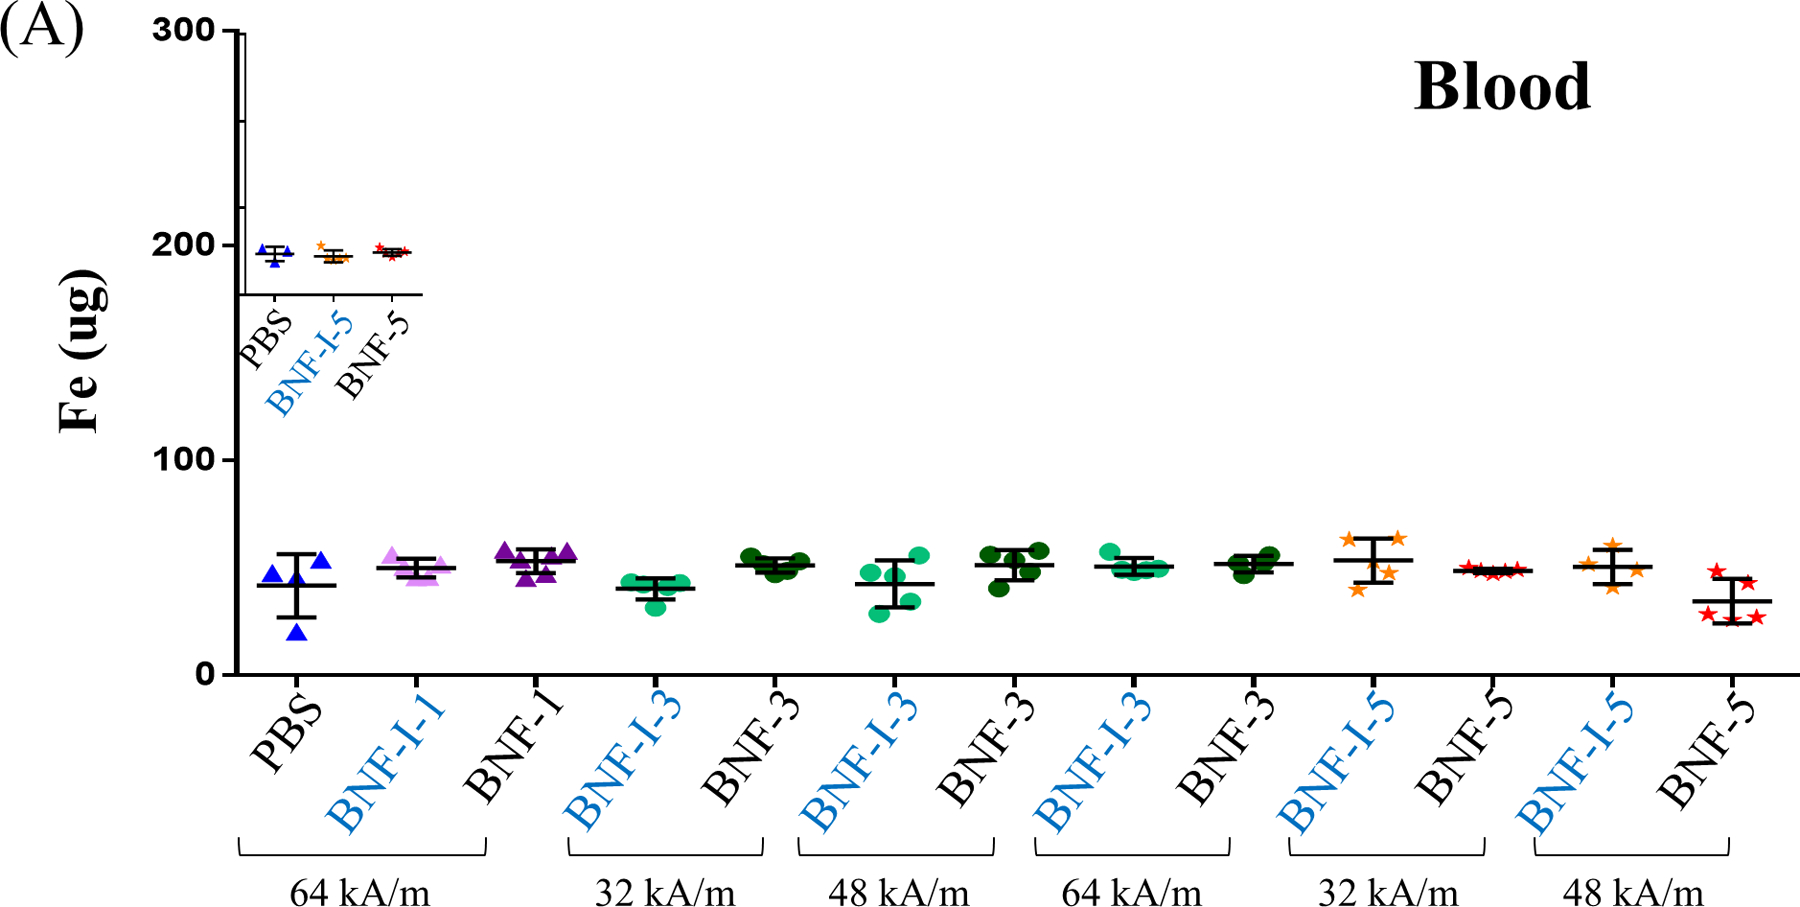
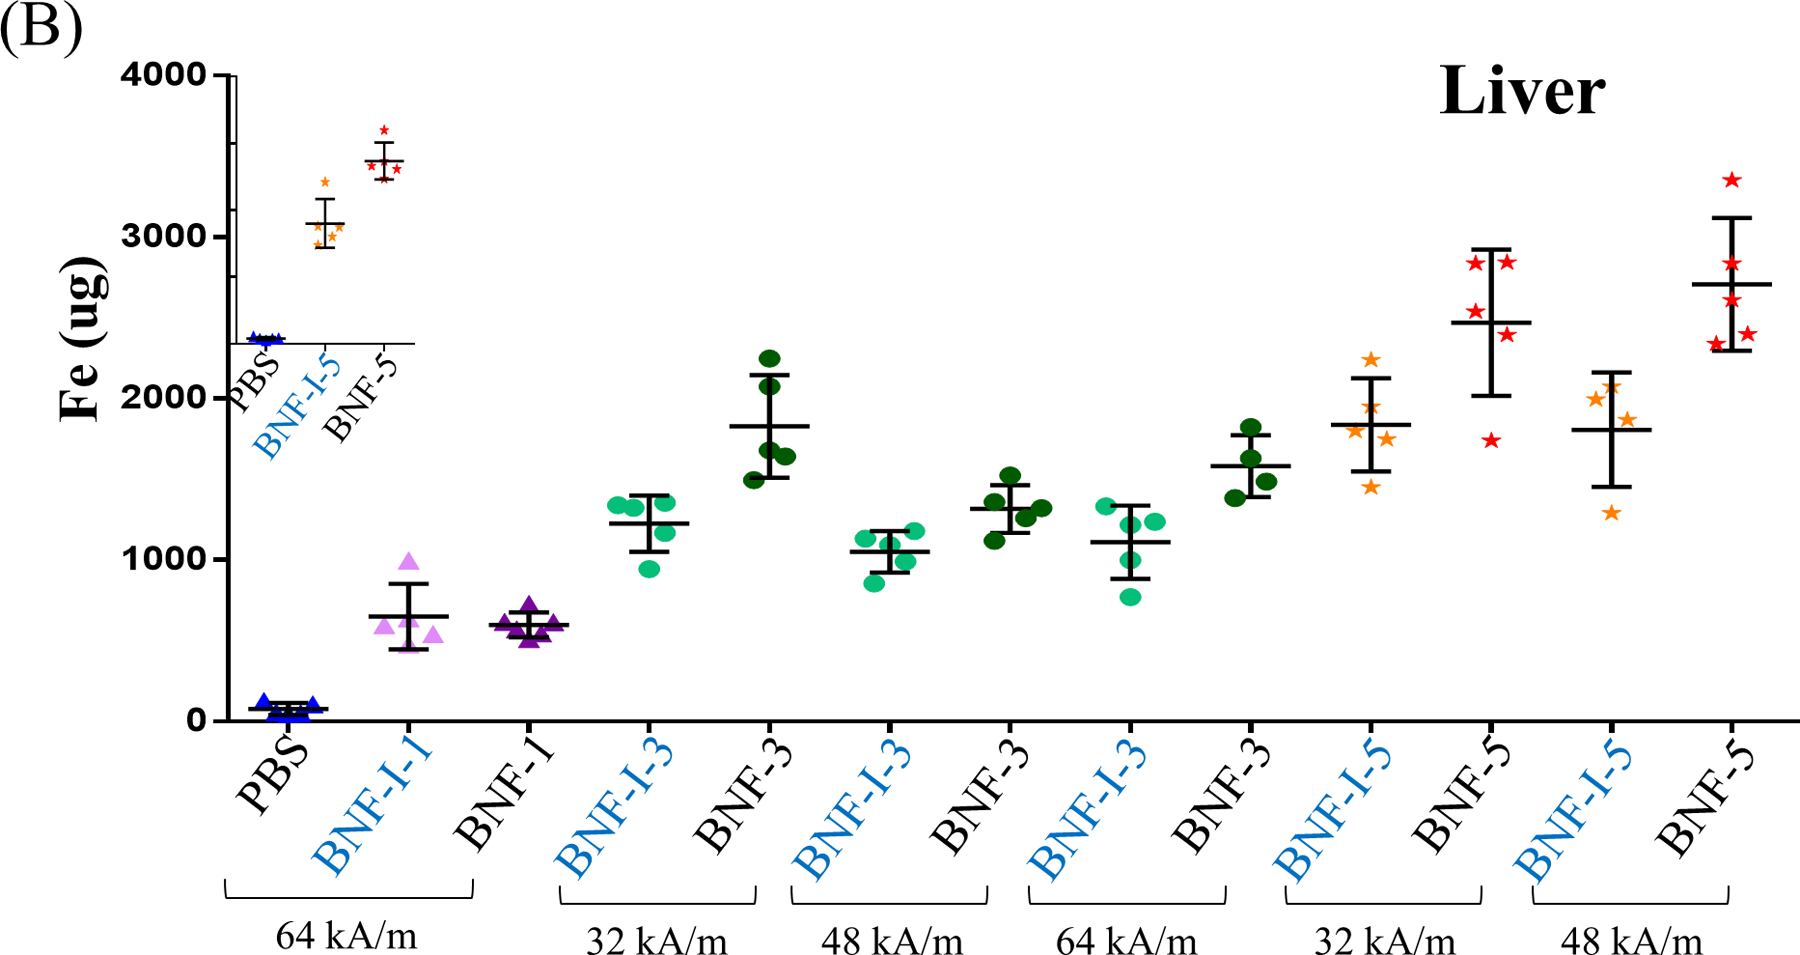
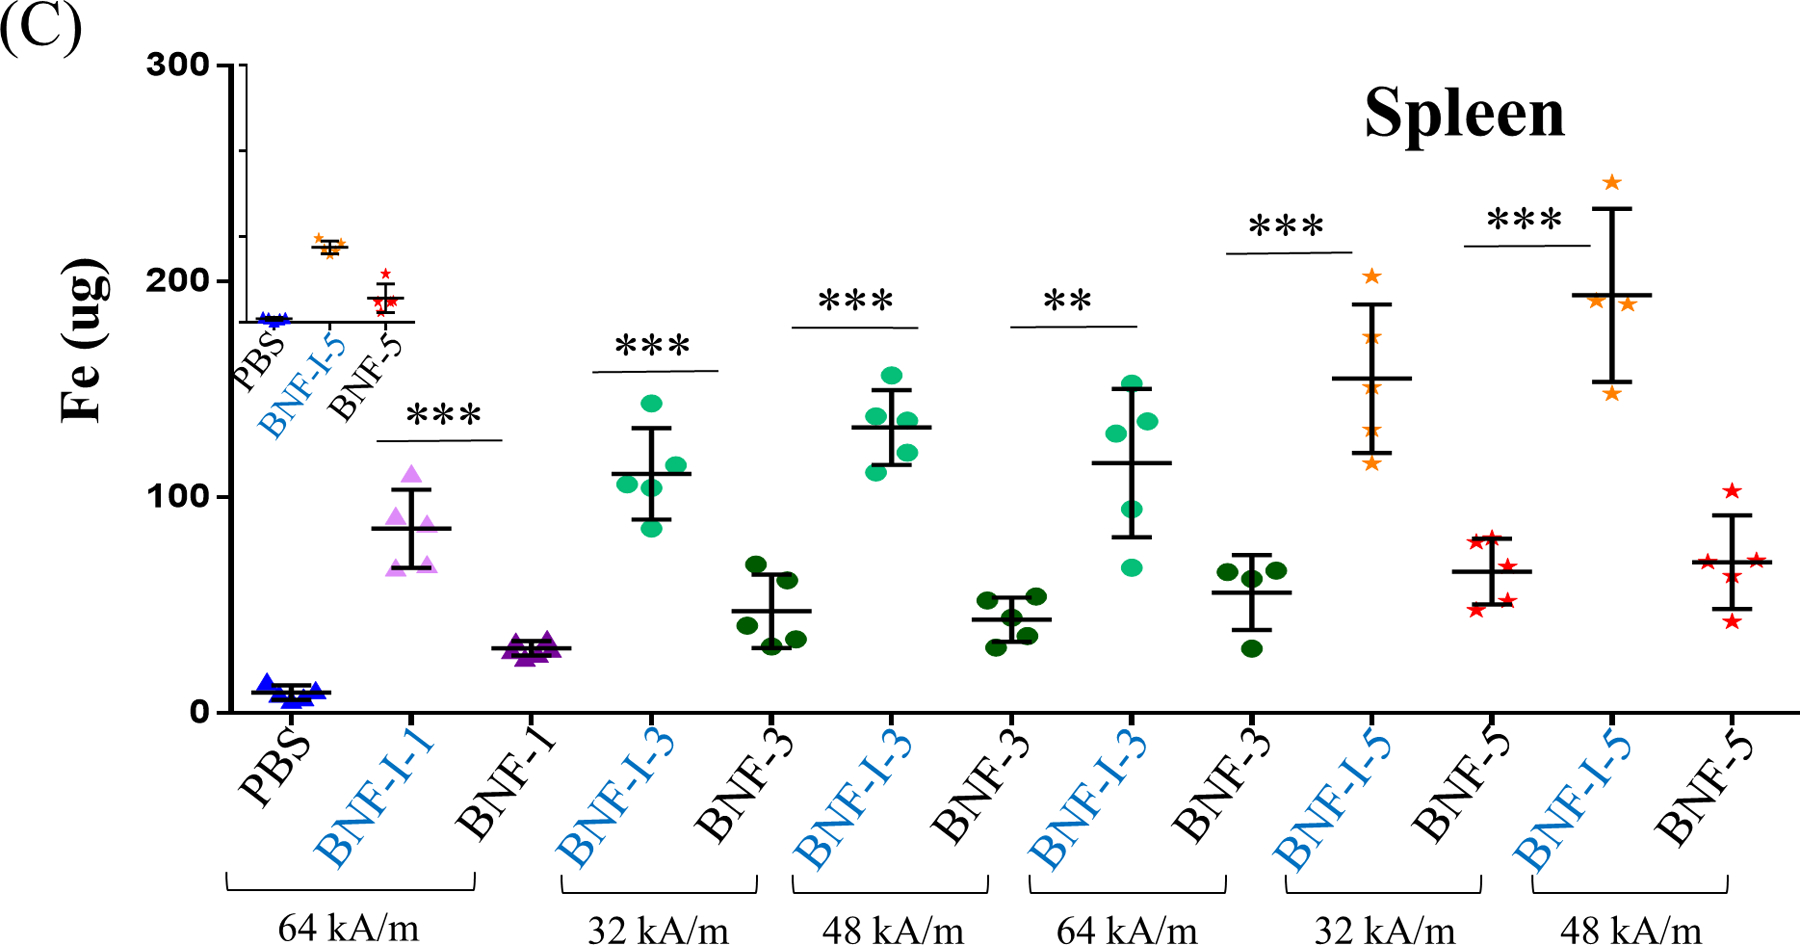
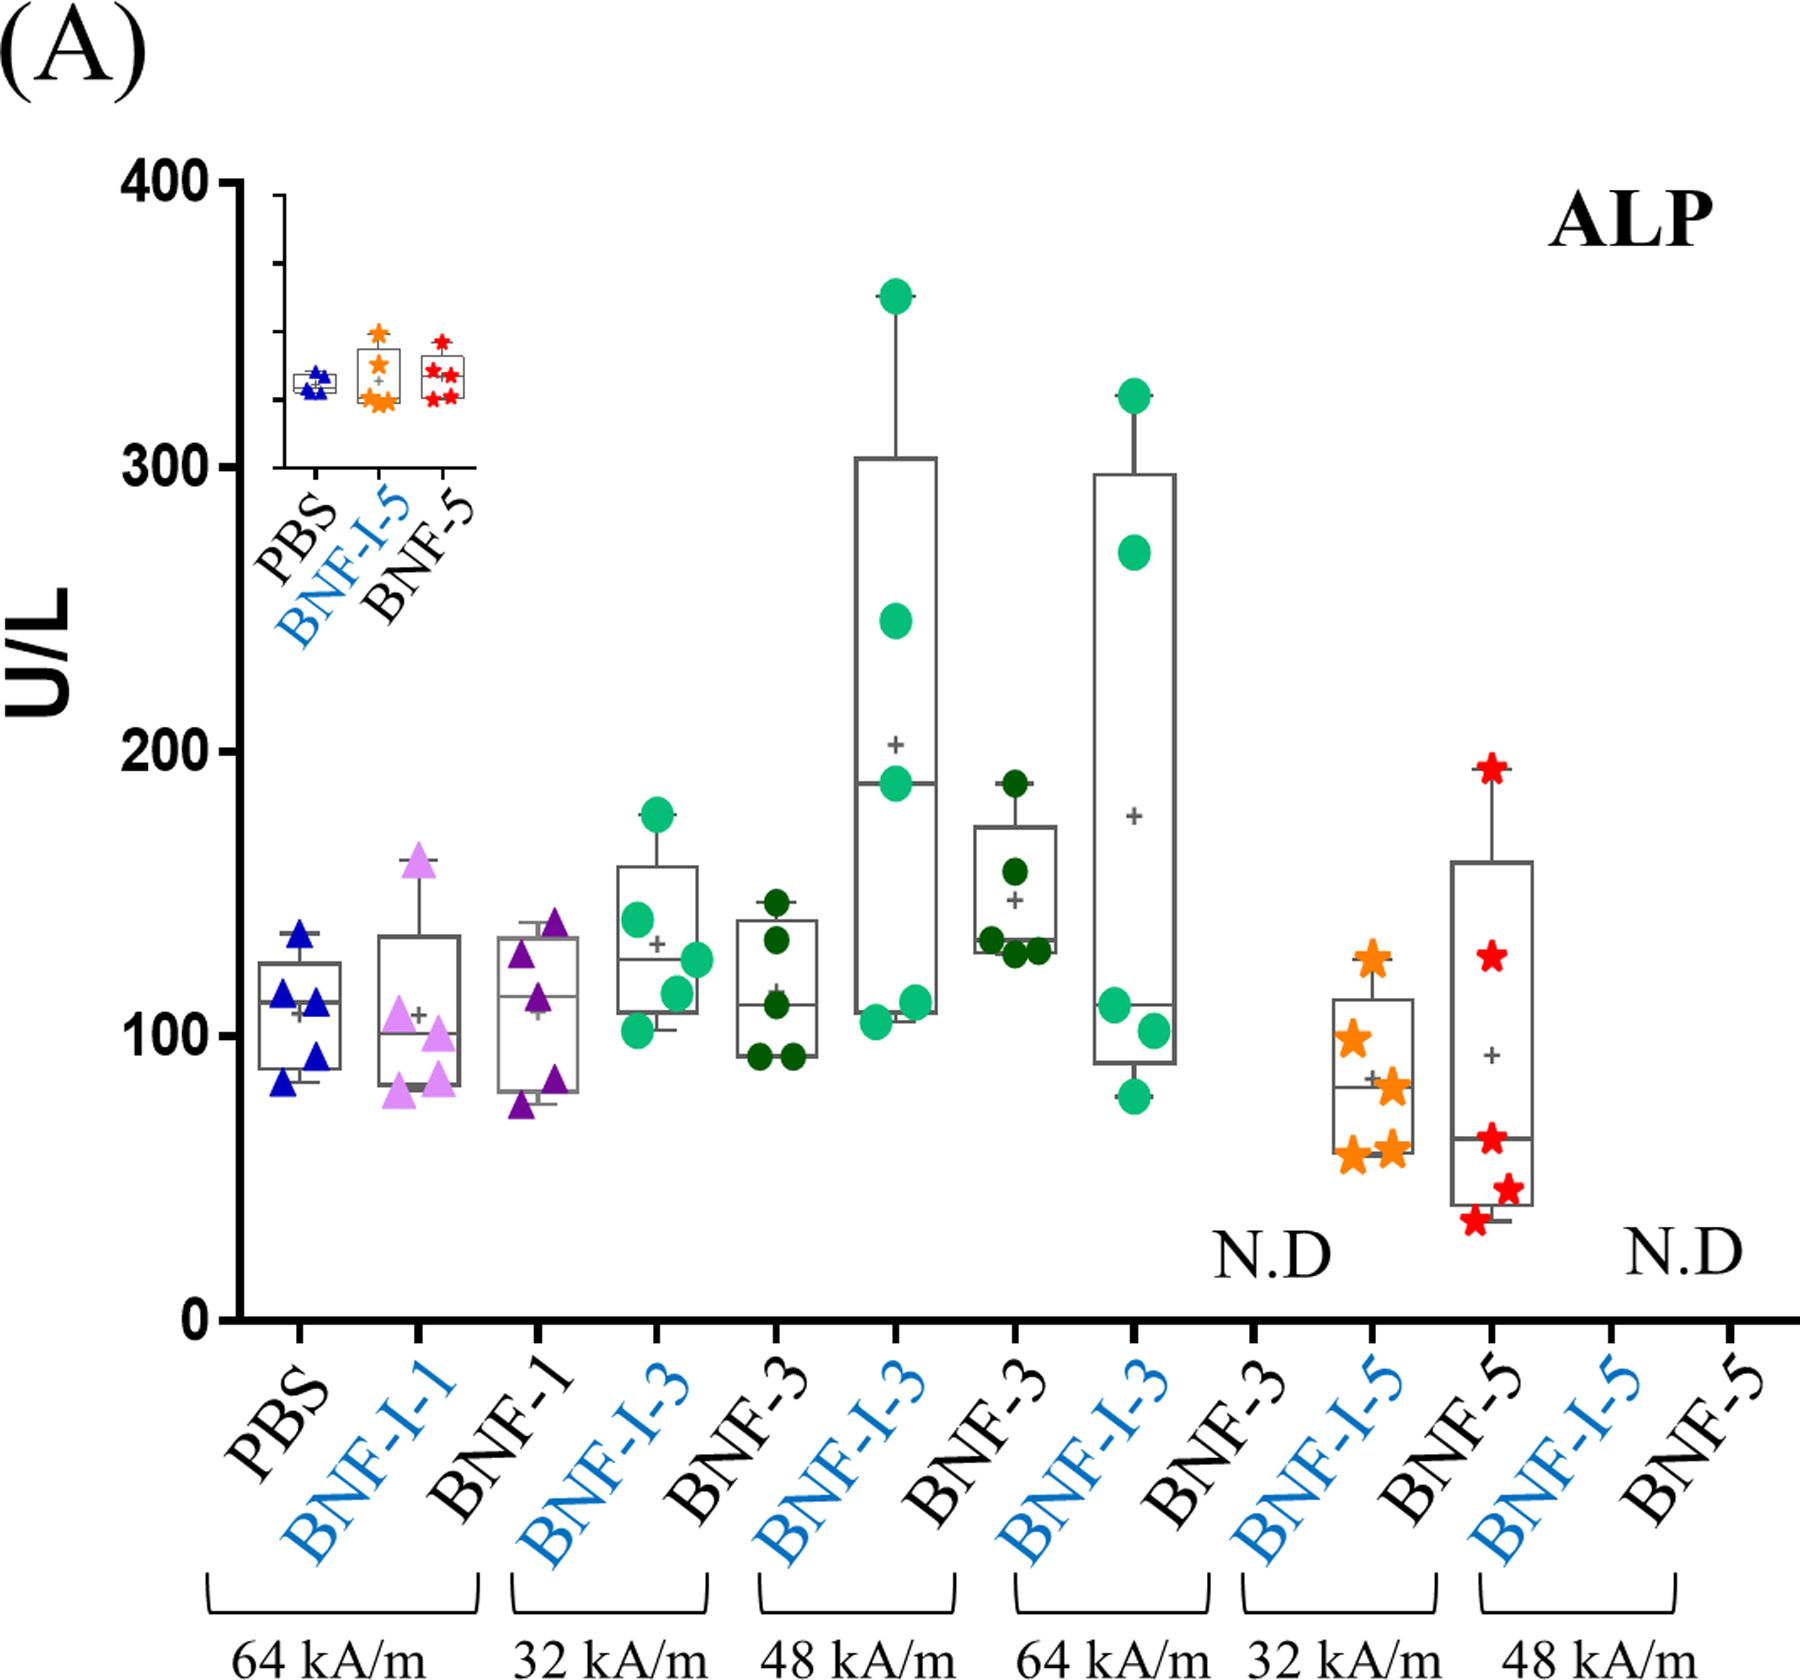
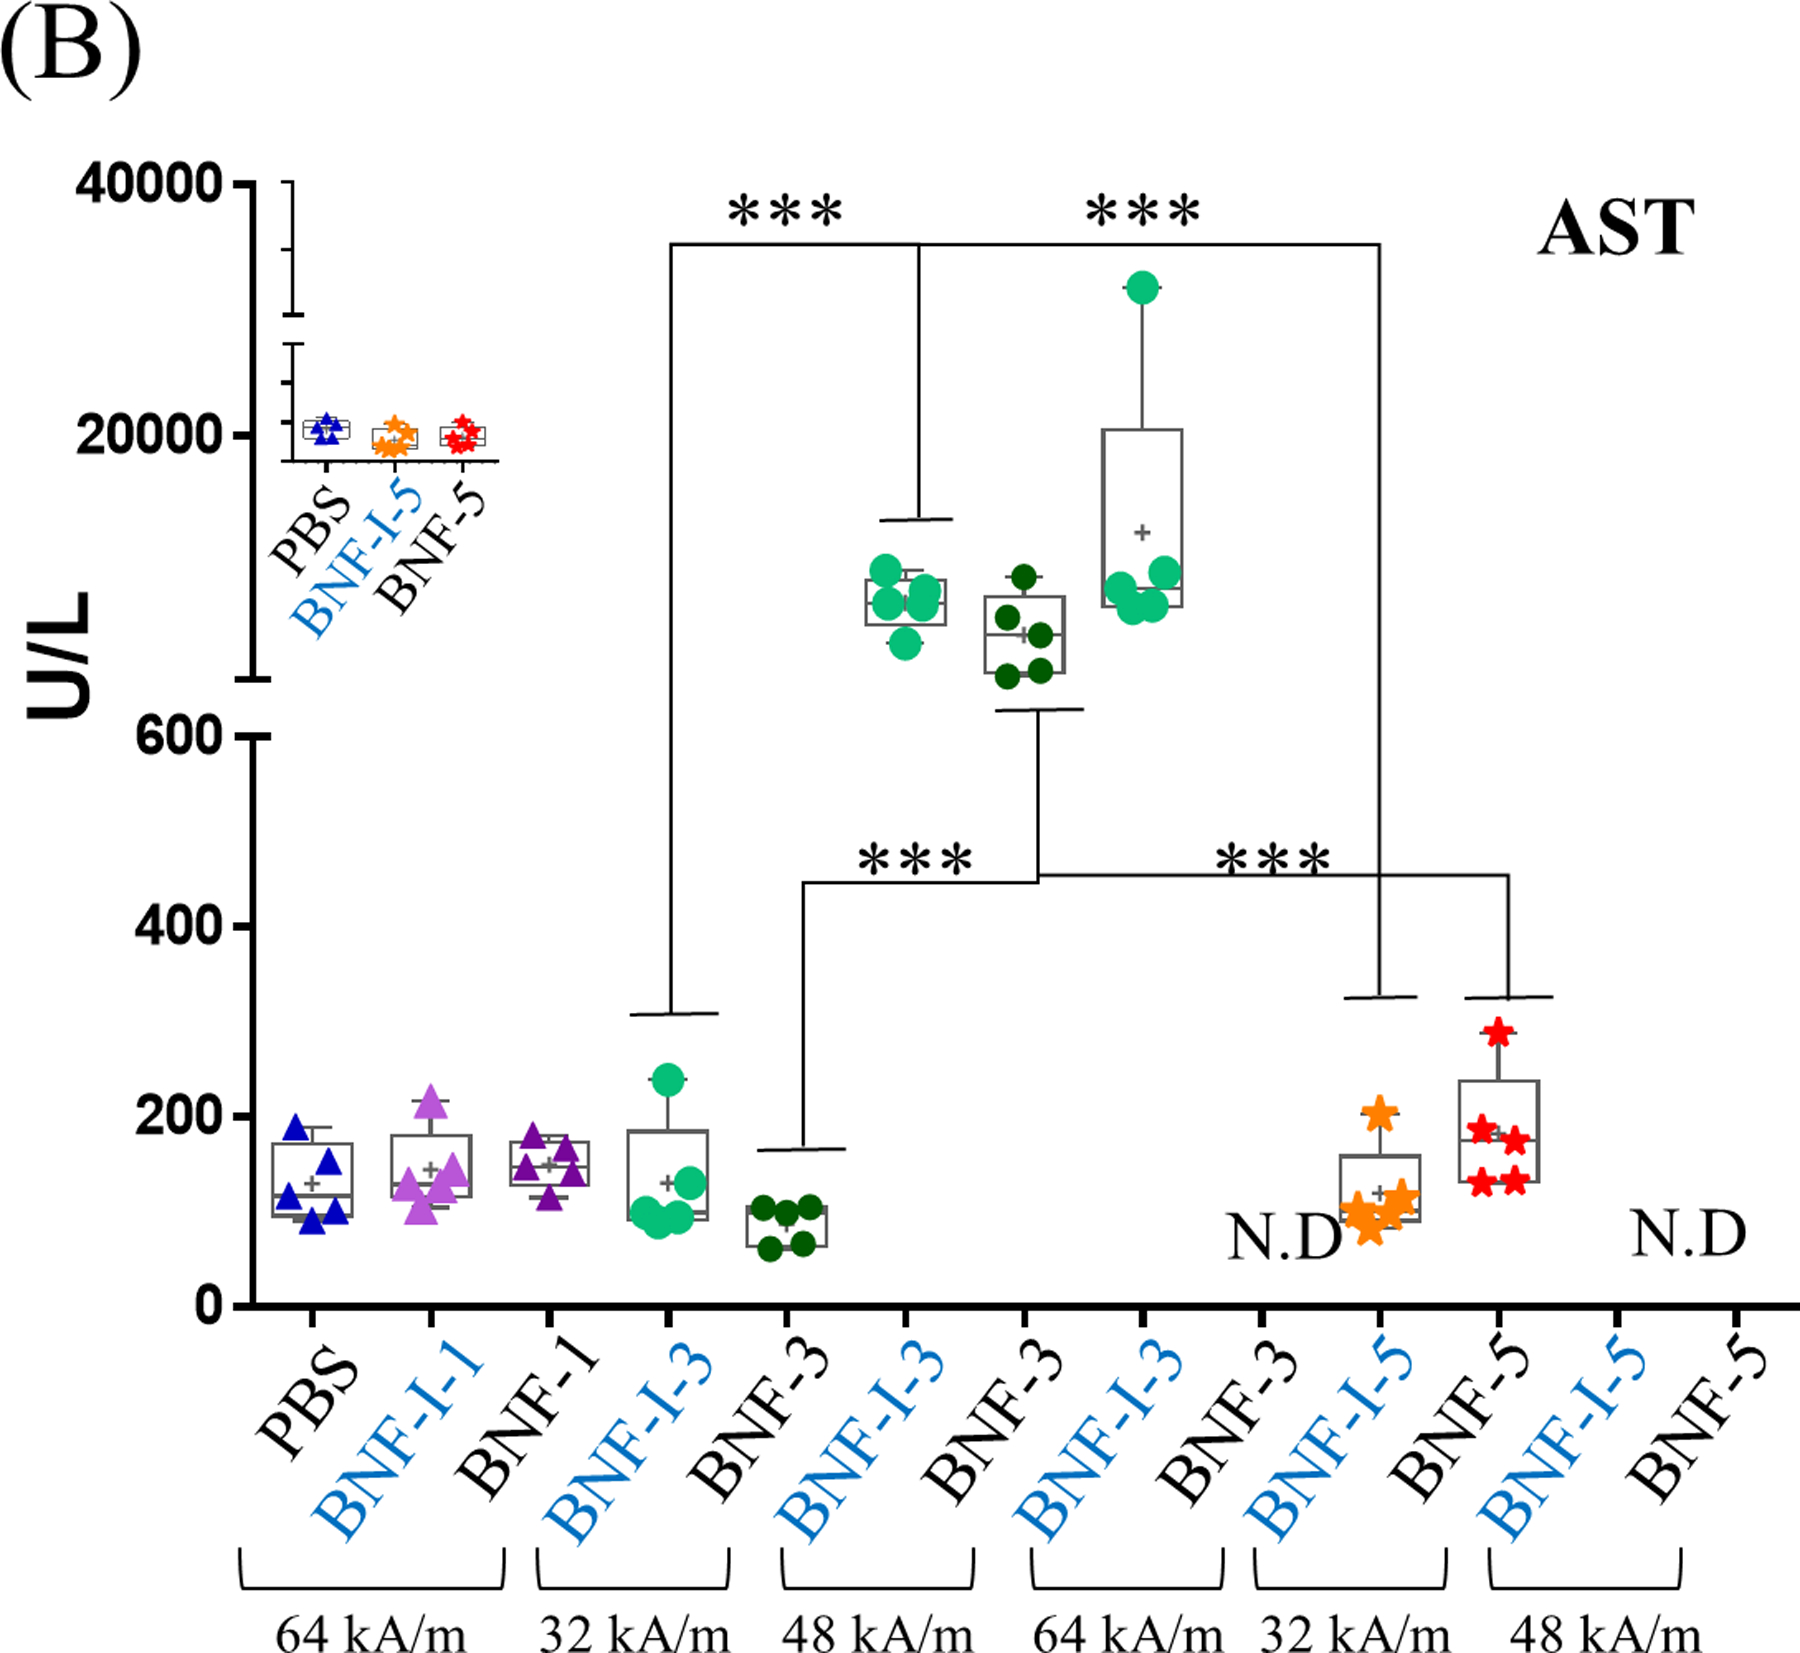
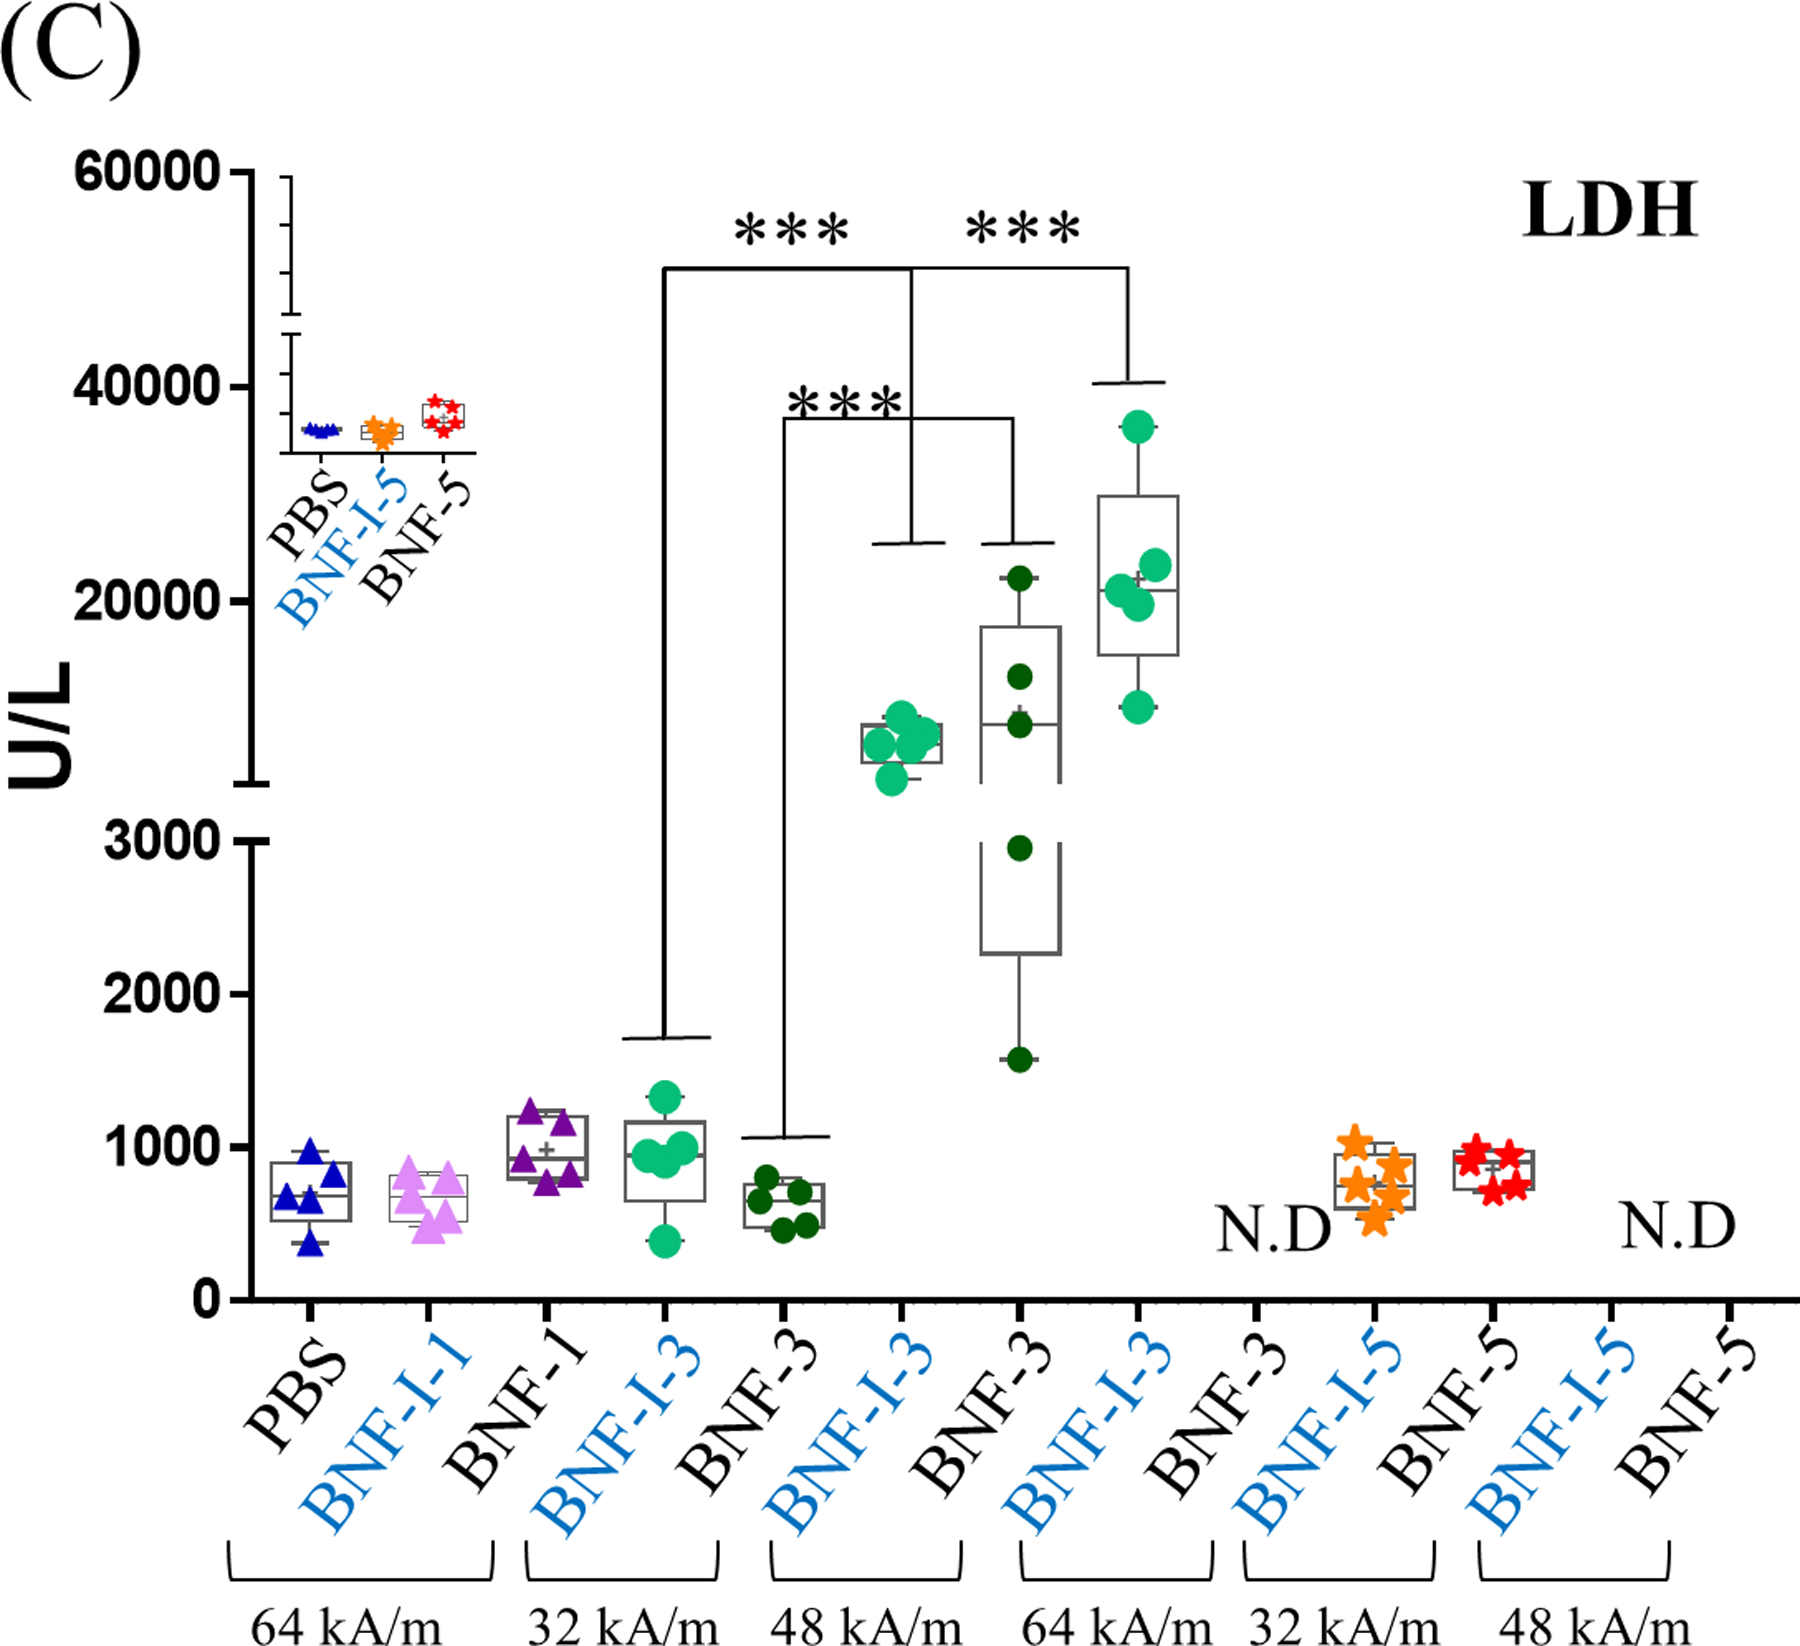
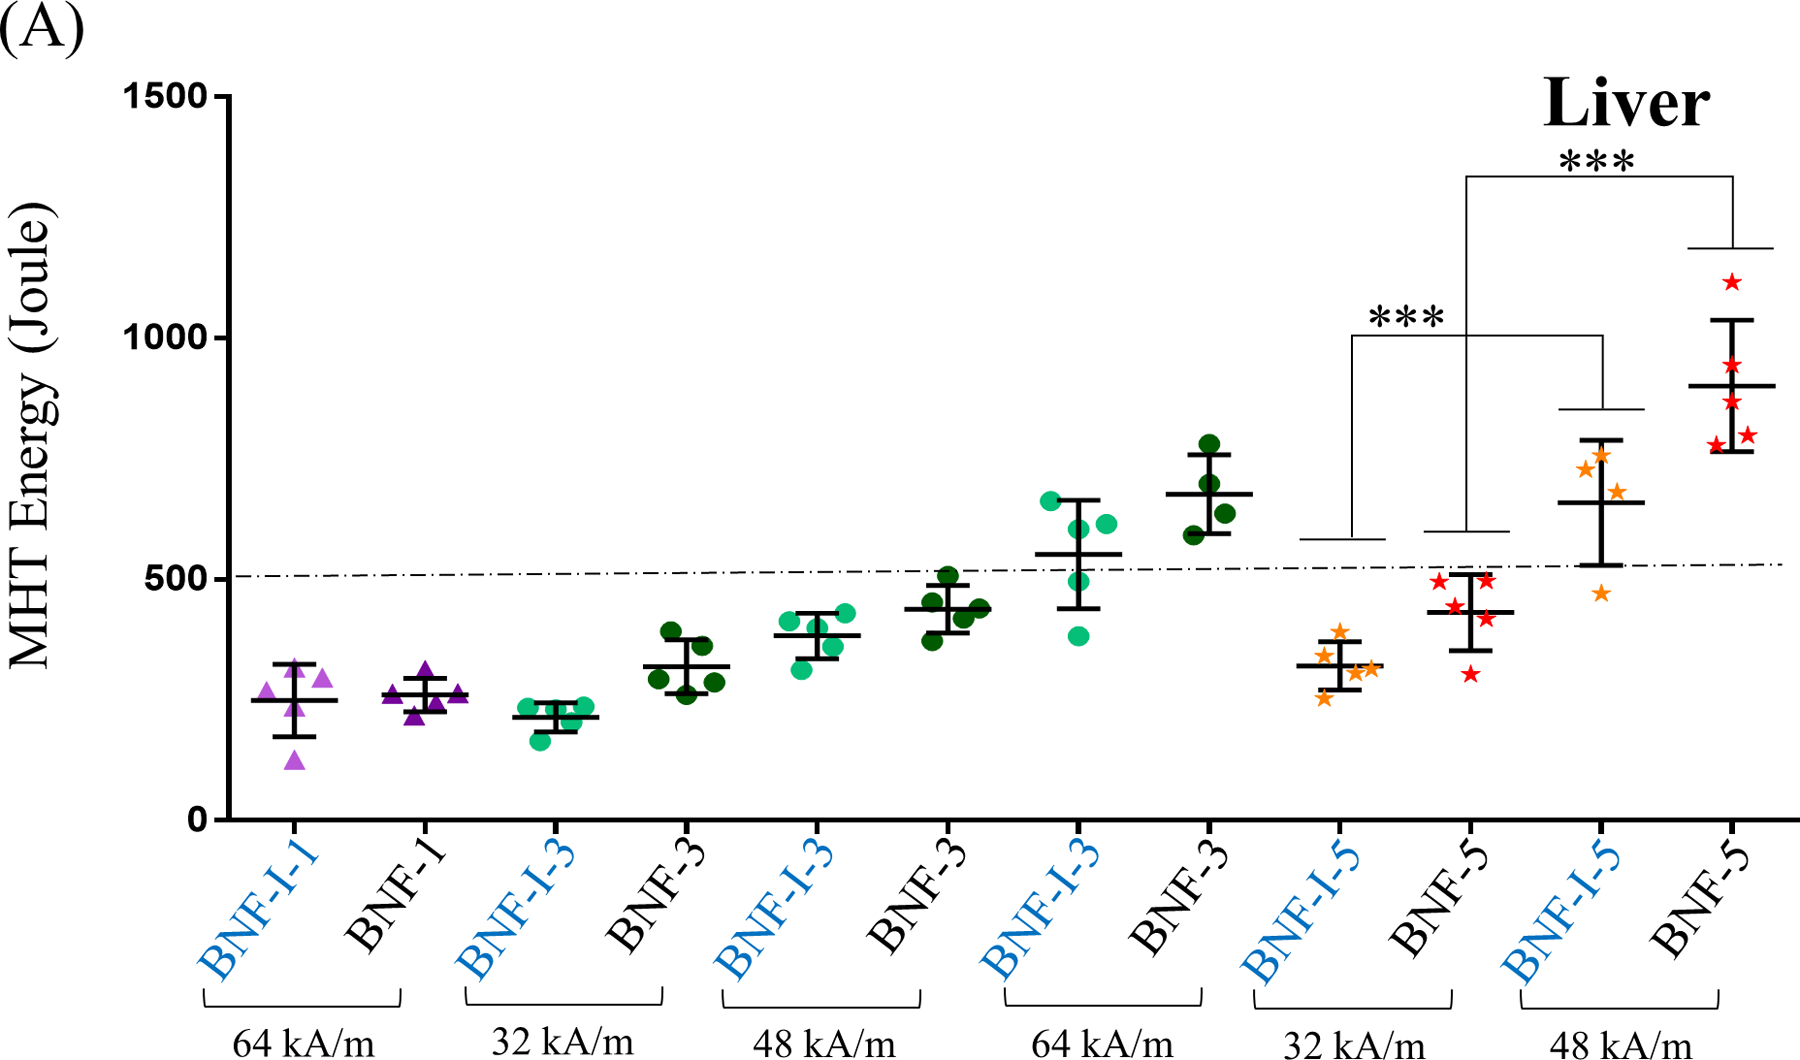
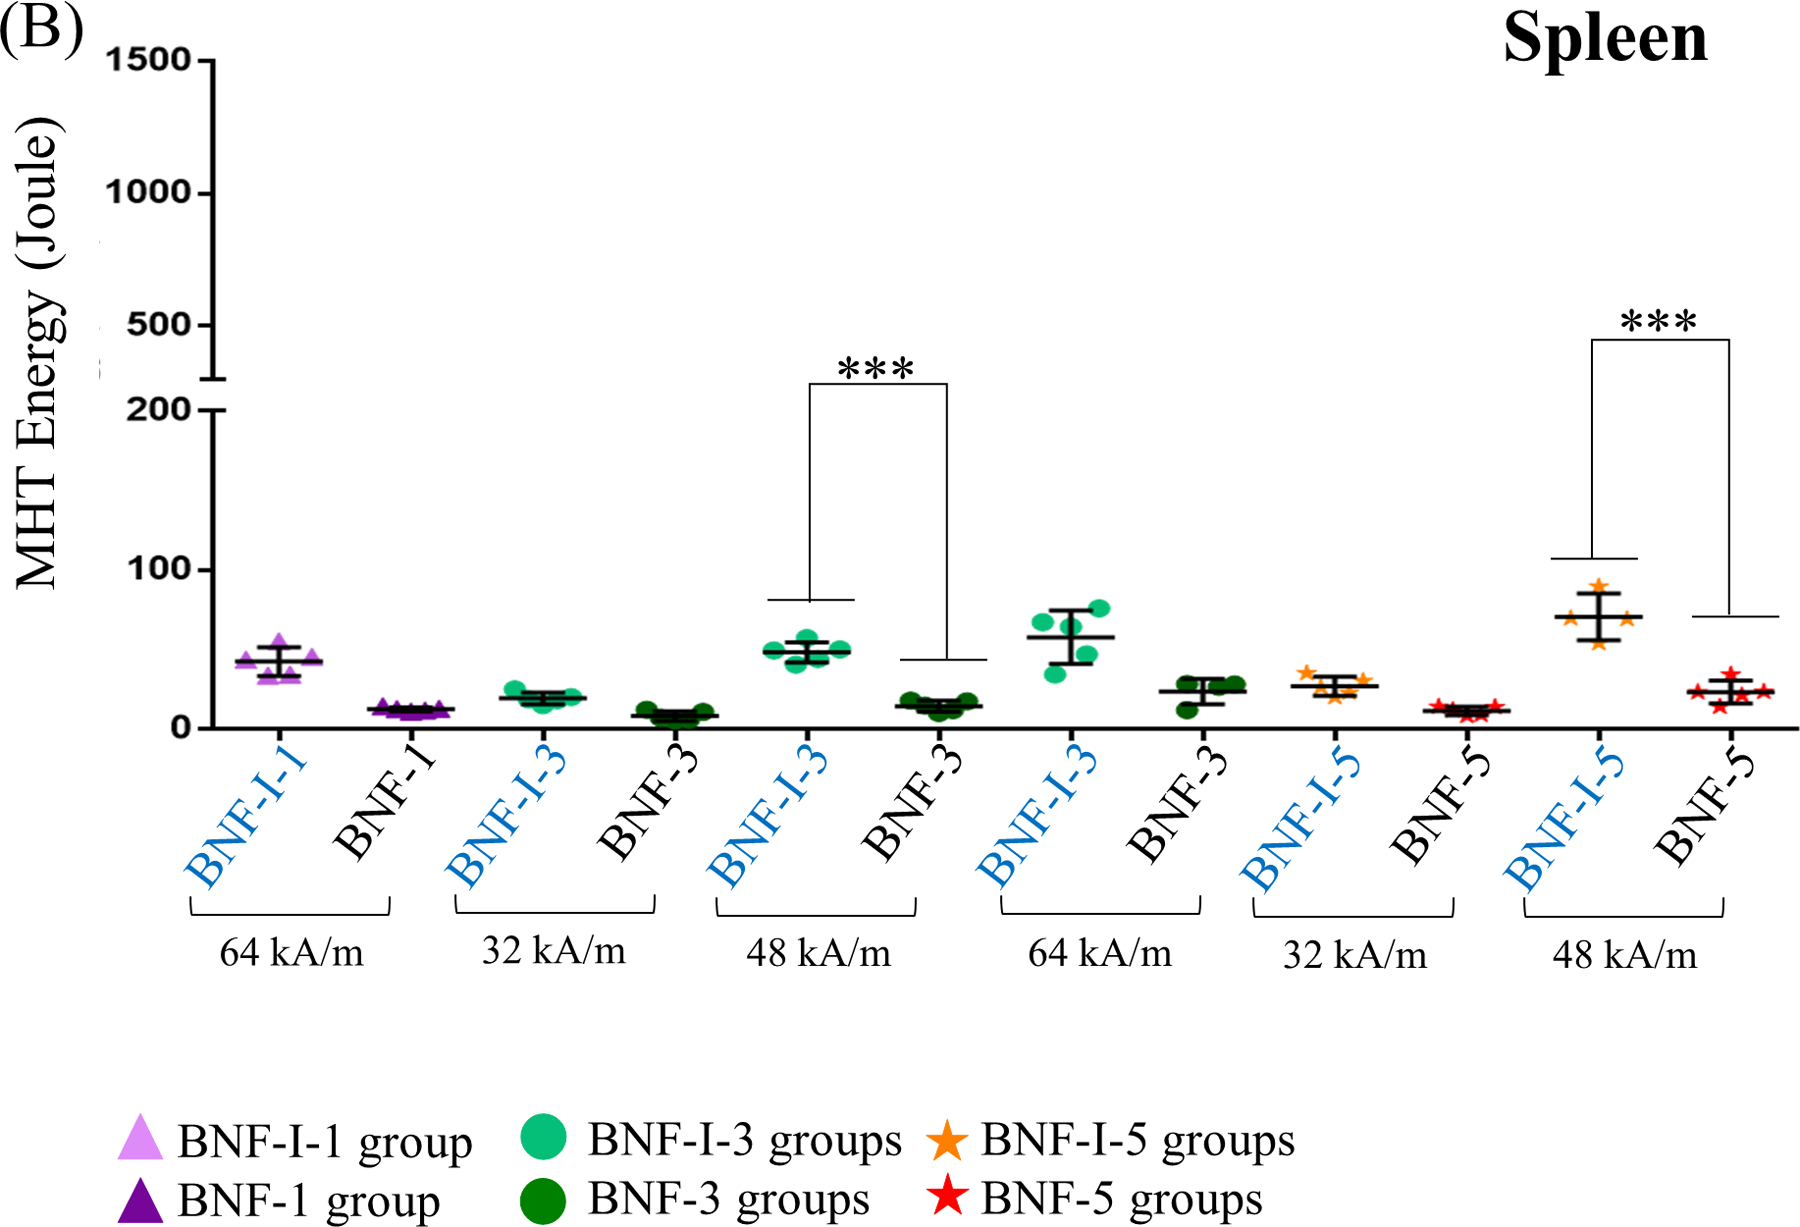
Methods: Eight-week old female nude mice received a single tail vein injection of bionized nanoferrite (BNF) MIONs or a counterpart labeled with a polyclonal human antibody (BNF-IgG) at 1 mg, 3 mg or 5 mg Fe/mouse on day 1. On day 3, mice were exposed to an alternating magnetic field (AMF) having amplitude of 32, 48 or 64 kA/m at ∼145 kHz for 20 min. Twenty-four hours later, blood, livers and spleens were harvested and analyzed.

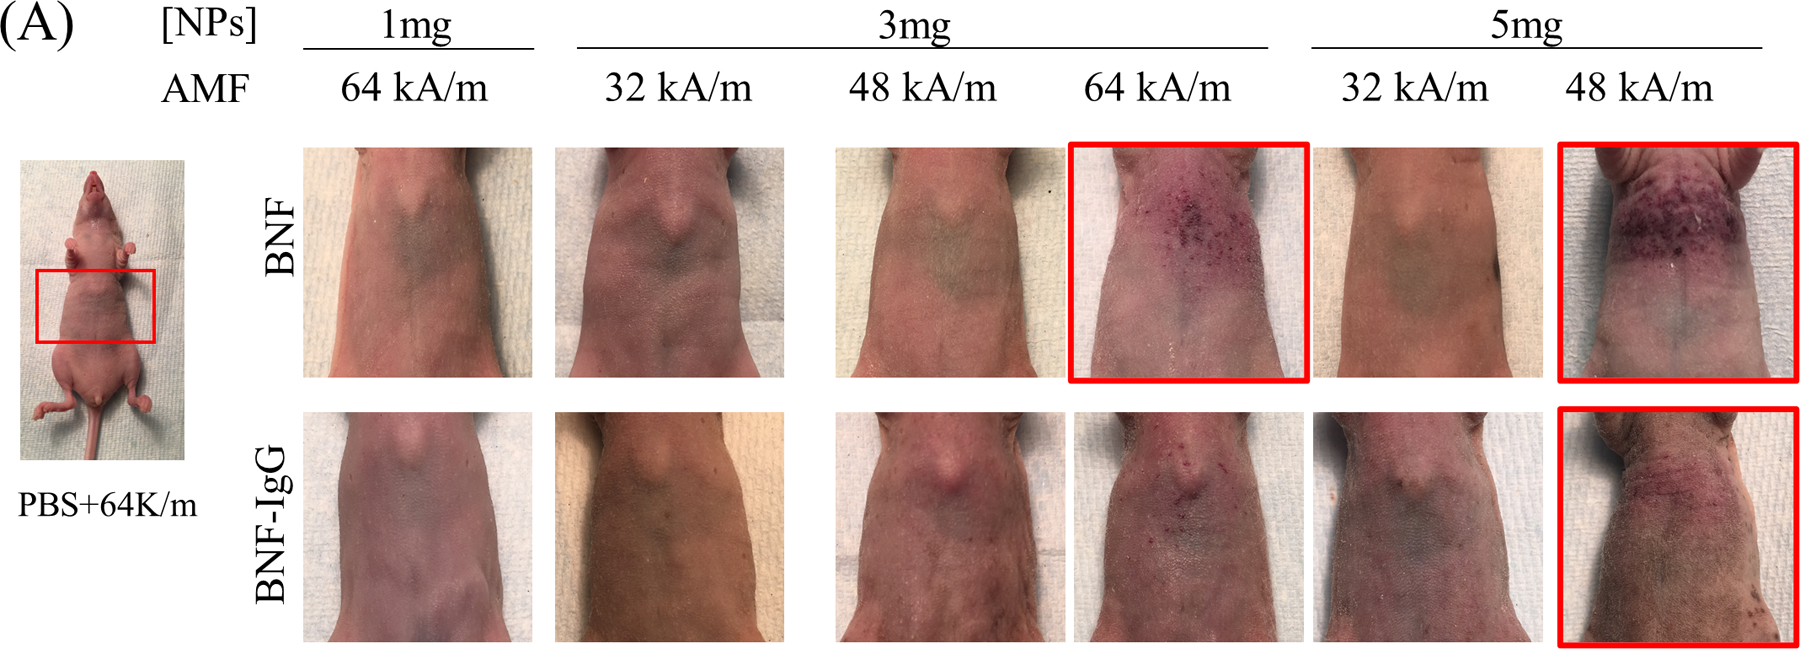
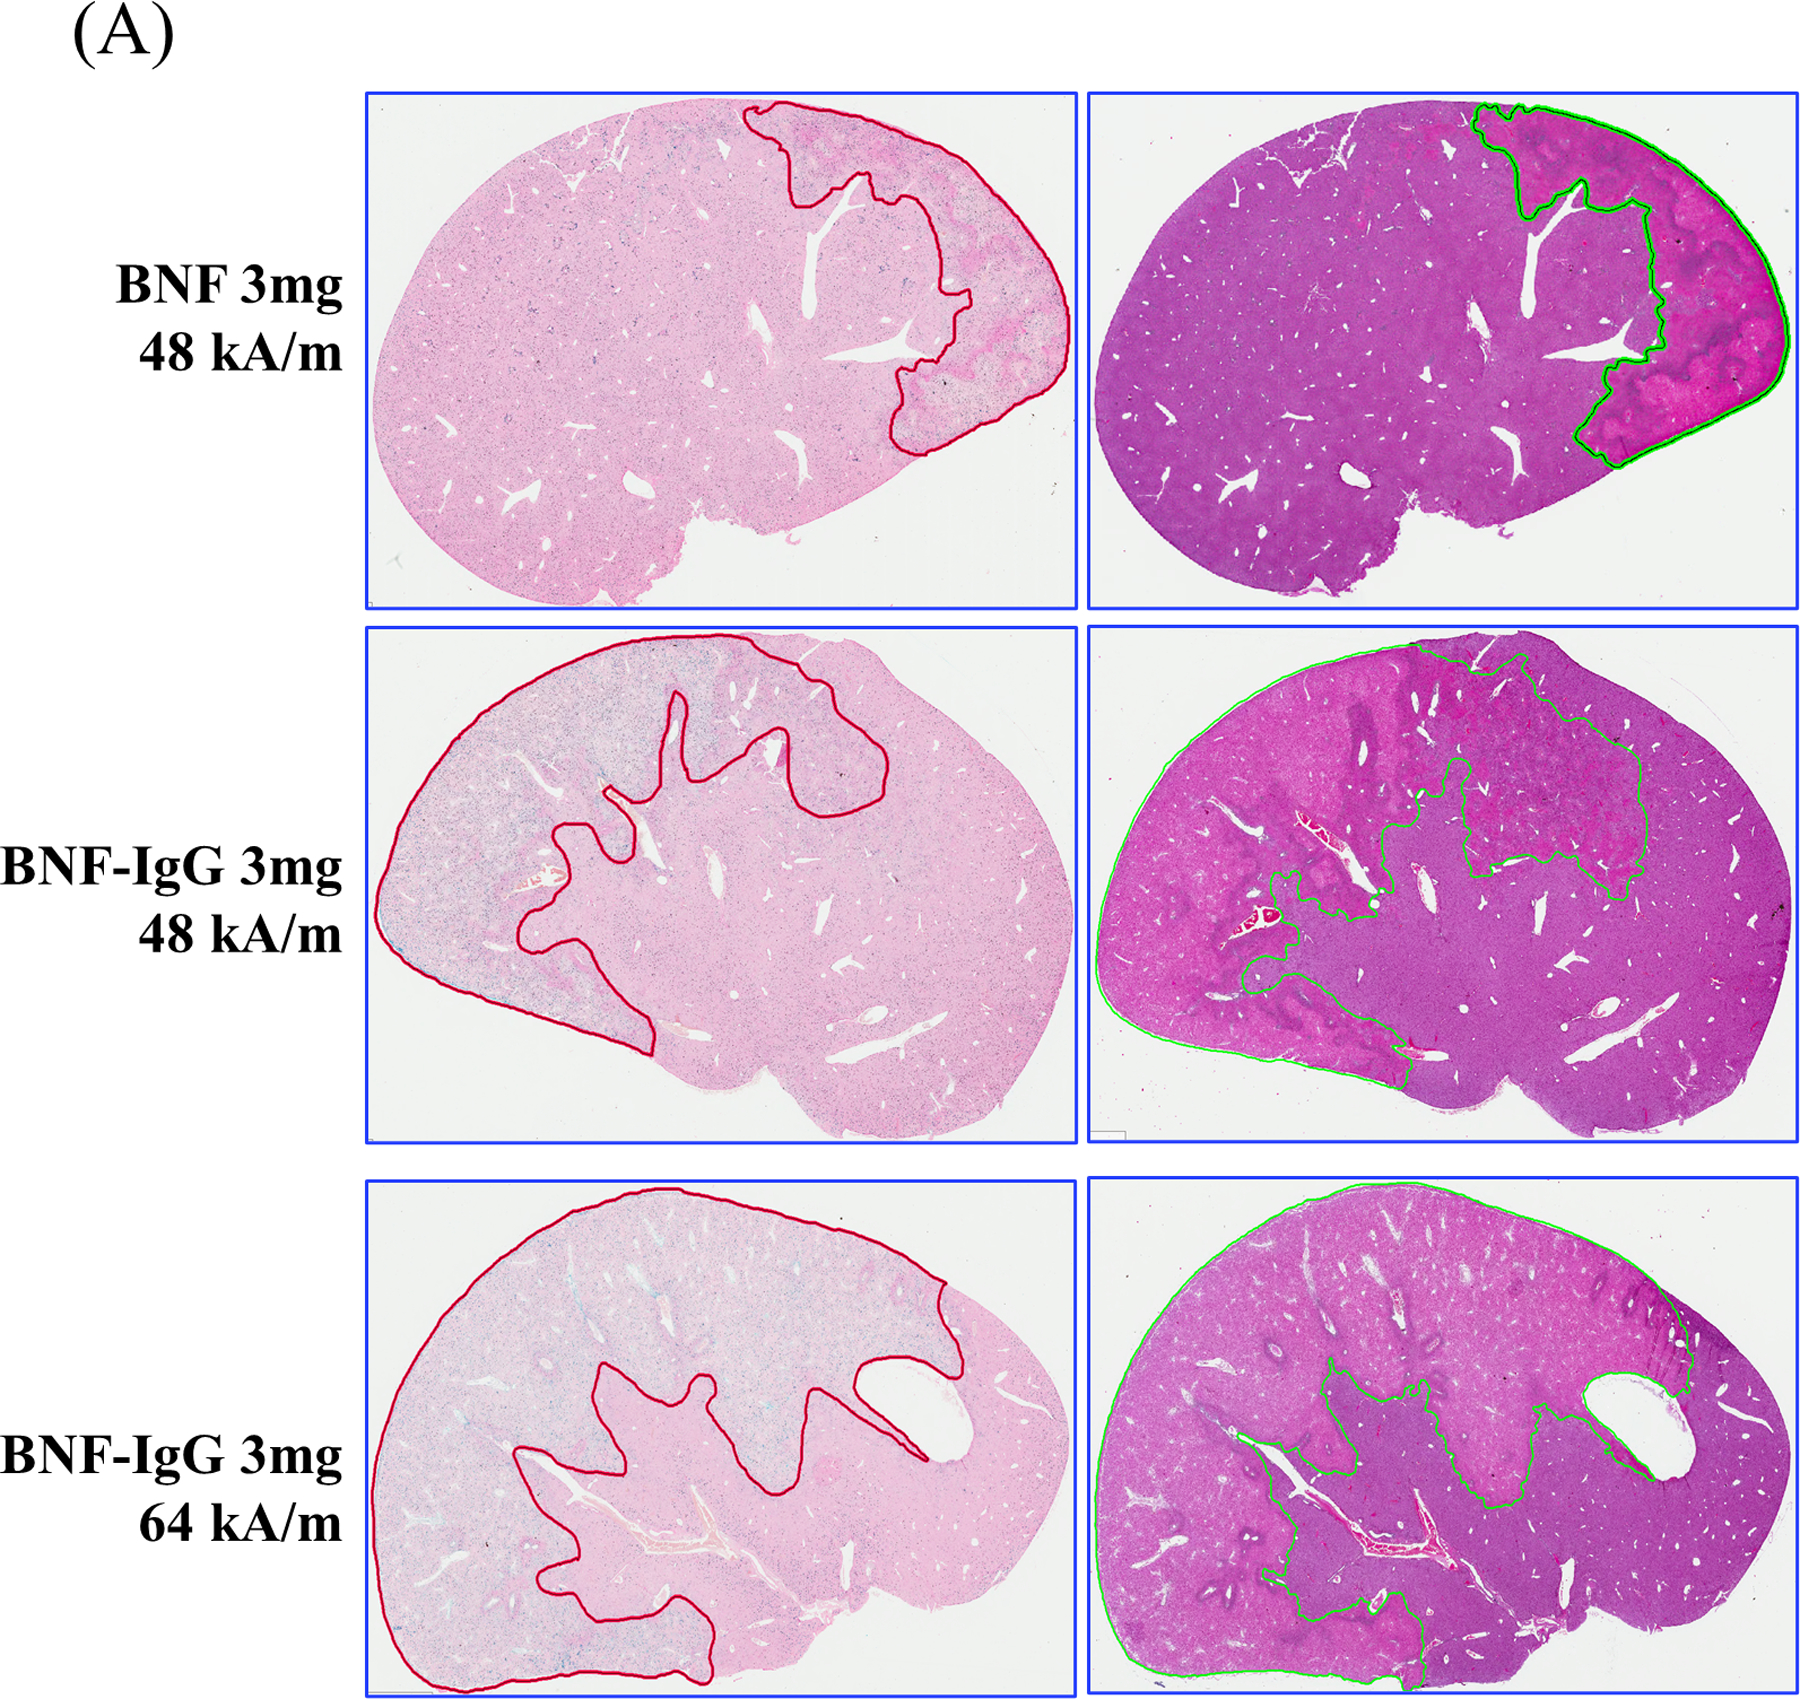
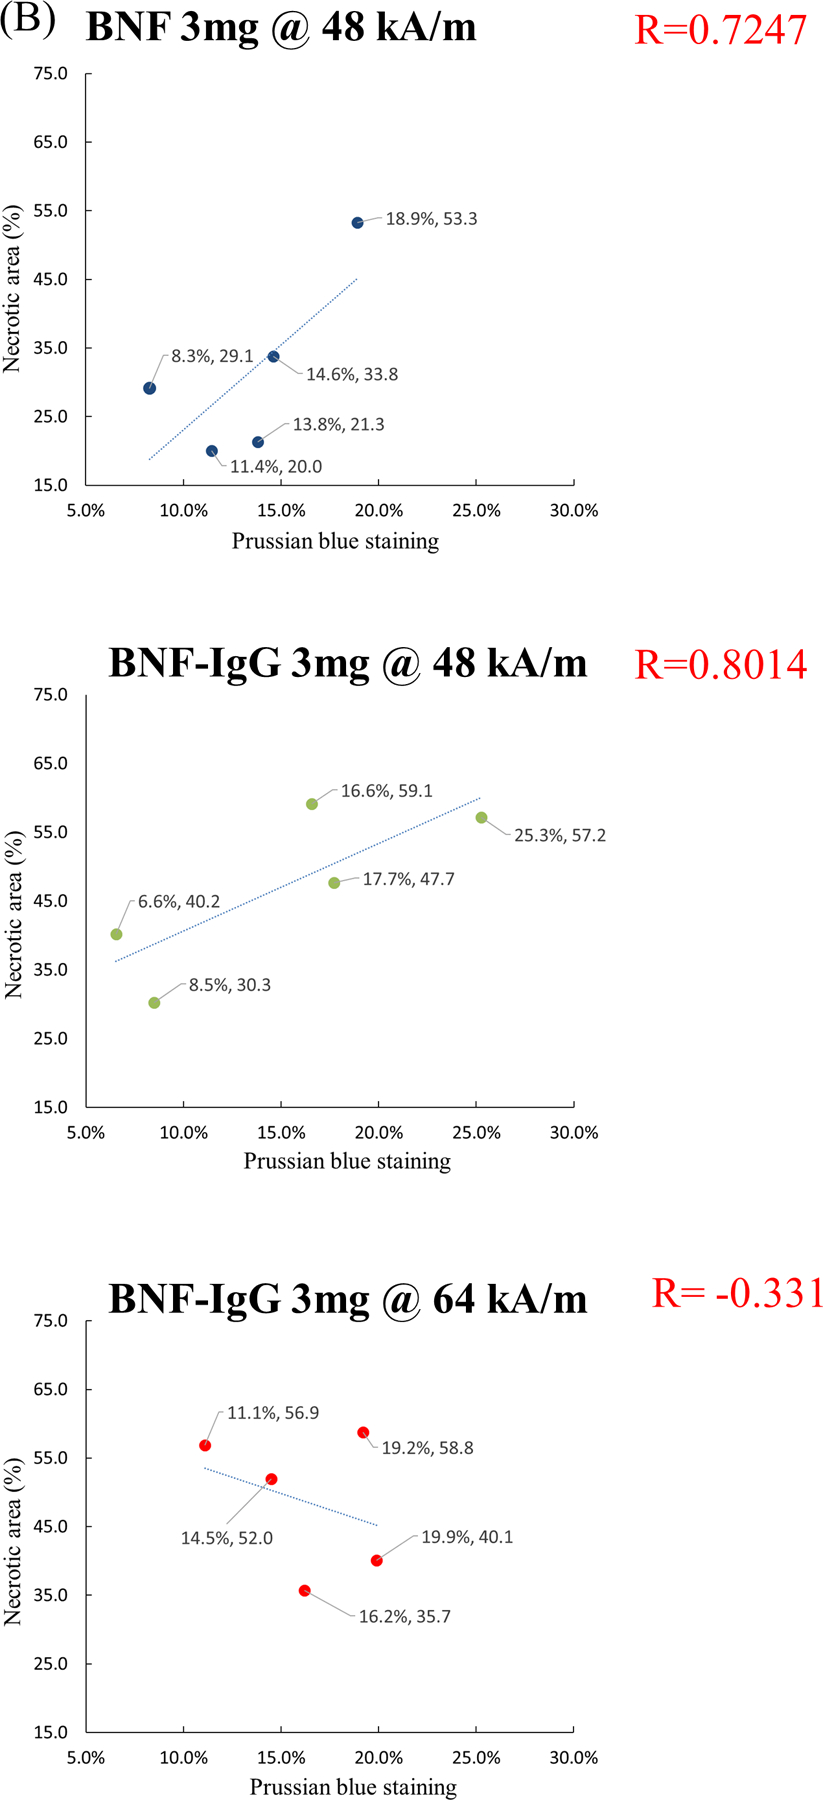
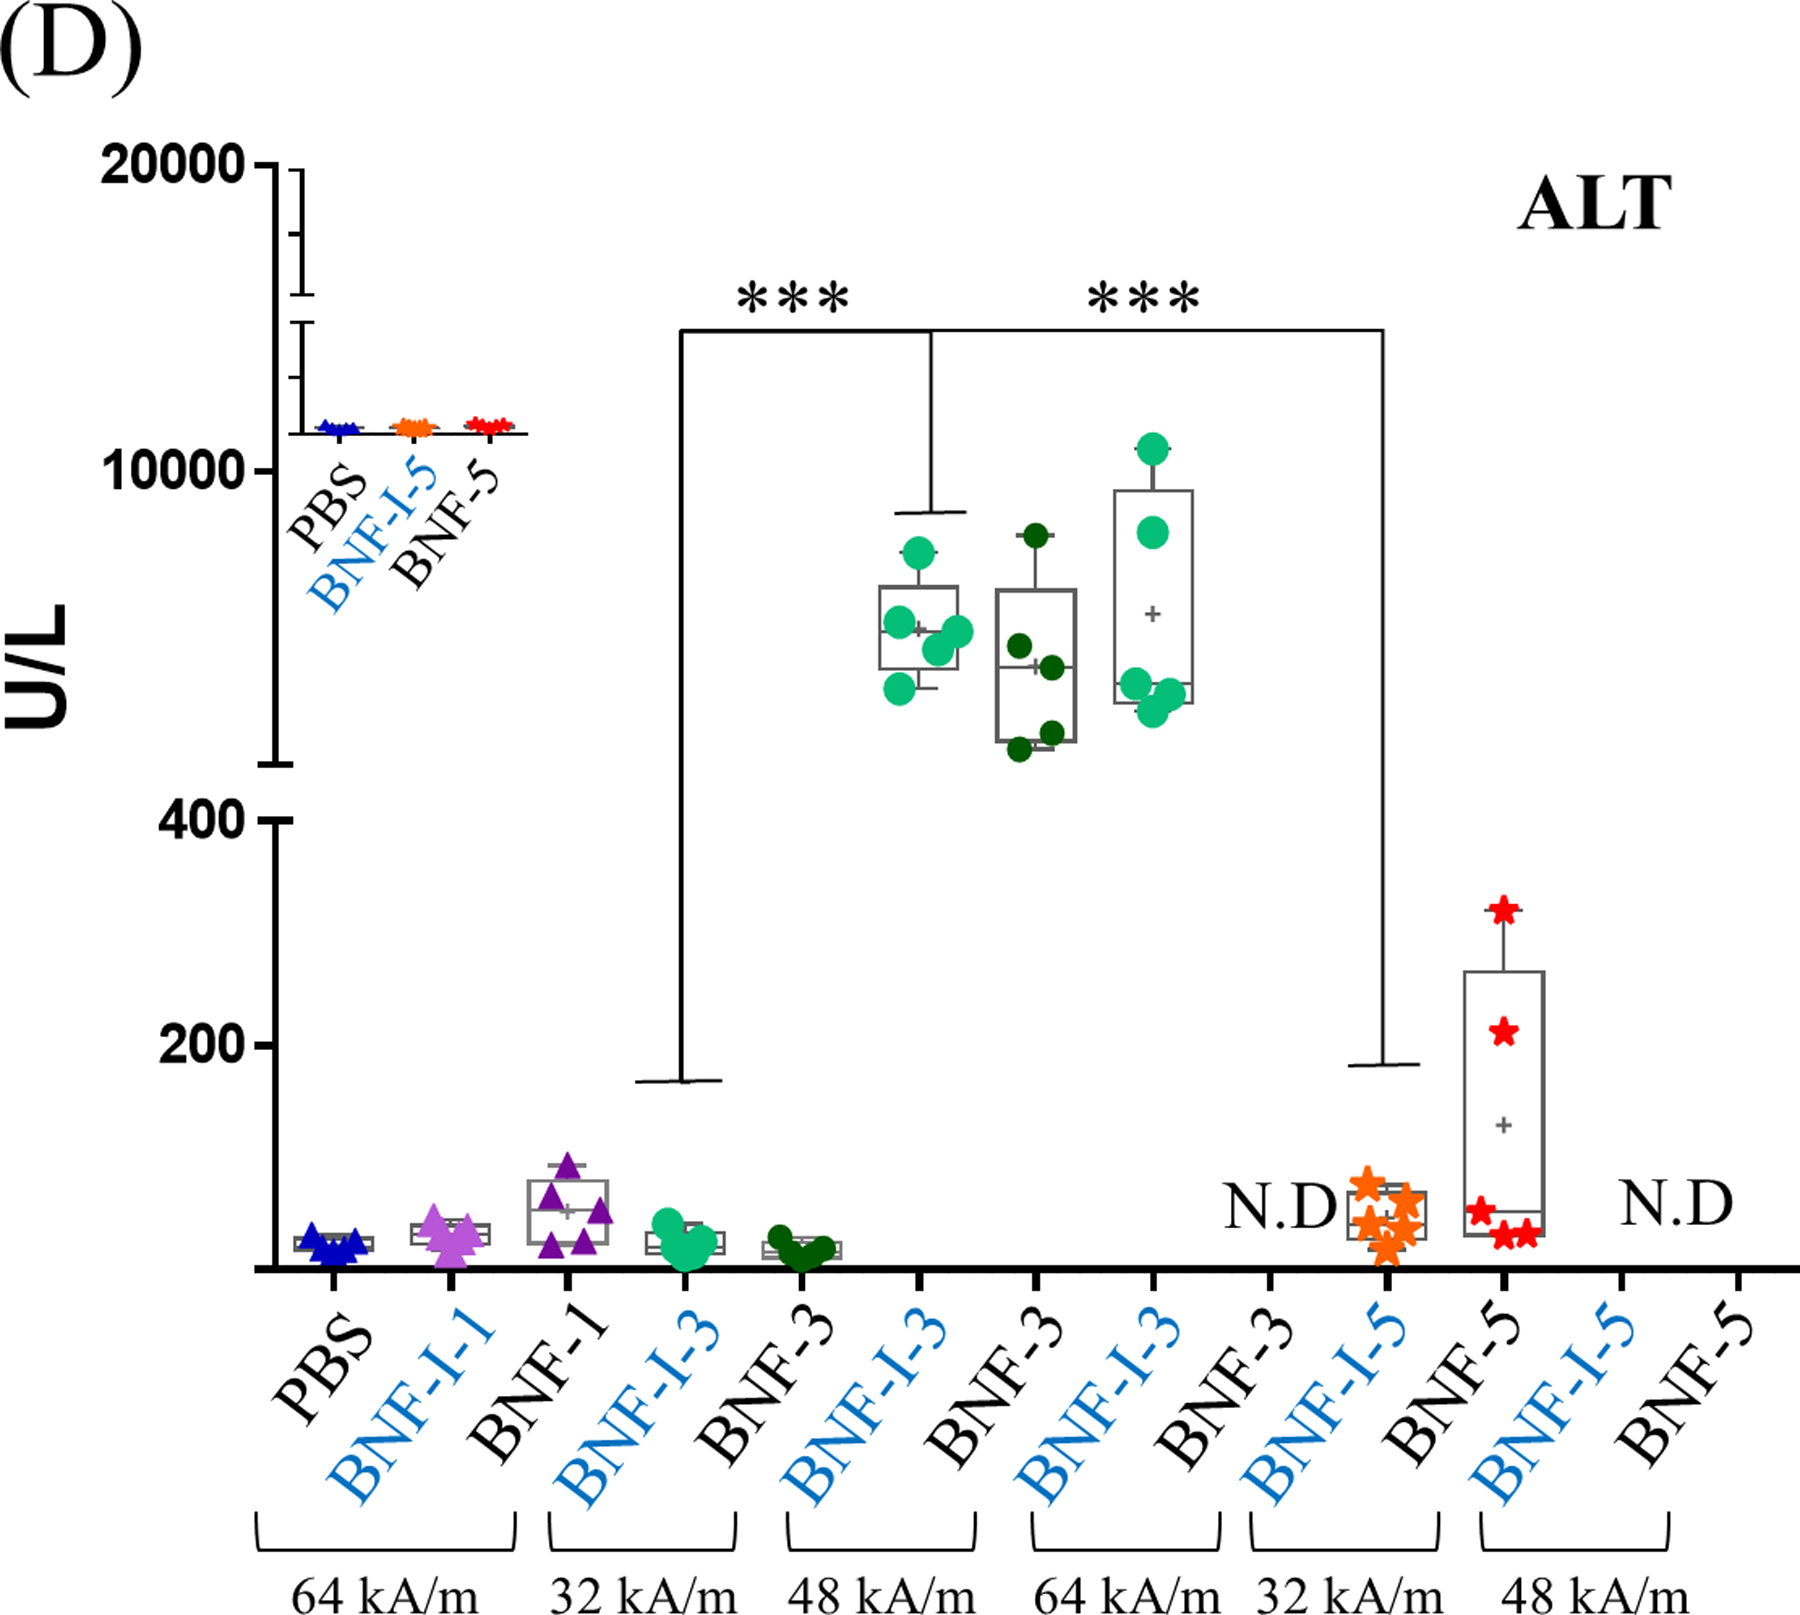
Results: Damage to livers was apparent by histology and serum liver enzymes following MHT with BNF or BNF-IgG at doses ≥3 mg Fe and AMF amplitudes ≥48 kA/m. Differences between effects with BNF vs. BNF-IgG at a dose of 3 mg Fe were noted in all measures, with less damage and increased survival occurring in mice injected with BNF-IgG. Necropsies revealed severe damage to duodenum and upper small intestines, likely the immediate cause of death at the highest MHT doses.

Conclusion: Results demonstrate that the MION coating affects biodistribution, which in turn determines off-target effects. Developments to improve heating capabilities of MIONs may be clinically irrelevant without better control of biodistribution.

Keywords: Iron oxide nanoparticles; alternating magnetic fields; hyperthermia; magnetic nanoparticles; monoclonal antibody.


Figures

Figure 1.
Figure 1.. Schematic and flow chart of experimental design and magnetic iron oxide nanoparticle (MION) heating.
A) Athymic nude female mice (7–8 weeks old) were treated with of bionized nanoferrite (BNF) or BNF-IgG nanoparticles vial tail vein injection (n= 4–5/group). After 48 hours, the mice were exposed to 20 min alternating magnetic field (AMF). The mice were euthanized 24 hours later. Blood from the heart was collected into heparinized tubes for liver function tests and iron quantification by inductively coupled plasma mass spectrometry (ICP-MS). Livers and spleens were also harvested and divided into two portions – one for histology and the other for ICP-MS. B) Mice were randomly assigned into one of nine groups with four to five mice per group. The flowchart shows magnetic hyperthermia (MHT) dose level depending on the concentration of nanoparticles and field conditions used. C) Specific loss power (SLP) measurements of BNF and BNF-IgG nanoparticles versus field amplitude, comparing amplitude-dependent SLP through peak field amplitude among the tested nanoparticles. Note that SLP values of BNF and BNF-IgG are similar. * MION: magnetic iron oxide nanoparticles (BNF and BNF-IgG nanoparticles)
Figure 2.
Figure 2.. Measured skin temperature increases with combined higher dose of MION dose and higher magnetic field amplitudes.
A&B) Temperature probes were affixed to the skin of the abdomen near the region of liver (dark area) and showed minimal increase of temperature in mice treated with 1mg Fe or 3mg Fe MIONs at 64 kA/m or 32 kA/m, respectively. C) A minimal increase of less than 41°C was noted with 5mg Fe of MIONs + 32 kA/m treatment. D) Measured temperatures 3mg Fe of MIONs and 48 kA/m. E) Measured temperatures with BNF nanoparticles at 3mg Fe + 64 kA/m treatment reaching 49°C, showing significantly higher heating than with BNF-IgG at the same condition 3mg Fe + 64 kA/m, ~42 °C. F) A steep increase of temperatures were measured from mice injected with either BNF or BNF-IgG at 5mg Fe and 48 kA/m. The temperatures reached >48°C with either MION construct.
Figure 3.
Figure 3.. Visible burn lesions on skin of chest region and liver damage resulted from treatment with BNF or BNF-IgG at high concentration and high AMF amplitude.
A) Mice injected with varying concentrations of BNF or BNF-IgG (1, 3, 5mg) after 24 hours, exposed to various AMF amplitudes (32, 48, 64 kA/m) demonstrated varying extent of burn injury on the skin of the upper abdomen region after MHT. Burn injuries were most pronounced in mice treated with BNF 3mg + 64 kA/m, BNF 5mg + 48 kA/m or BNF-IgG 5mg + 48 kA/m. B) Mice injected with either BNF-Plain or BNF-IgG nanoparticles manifested clearly darker appearance of liver than did mice in the PBS injected control group due to MION presence. Mice are sacrificed 24 hours after MHT. Evidence of burns in livers is noted by red arrows, which occurred with higher concentrations of nanoparticles and high AMF amplitude.
Figure 4.
Figure 4.. Liver tissue sections stained with H&E revealed widespread damage occurred with combinations of high MION dose and high AMF amplitude.
Mice were sacrificed 24 hours after MHT and tissues were harvested for H&E staining. A representative sample of mouse liver tissue sections showing a wide range of necrotic tissue areas observed following treatment with either BNF 3mg + 48 kA/m, BNF-IgG 3mg + 48 kA/m or BNF-IgG 3mg + 64 kA/m. No differences are seen with low MHT dose groups, compared with controls. Mice exposed to high dose MHT died, and organs harvested less than 1hr after death revealed liver sinus congestion (white arrow). The enlarged images of liver sections show representative normal, necrotic and sinus congestion.
Figure 5.
Figure 5.. Quantification of Prussian blue positive areas demonstrated tissue damage correlated with presence of MIONs when combined with AMF at moderate and high amplitudes.
Mice were sacrificed 24 hours after MHT and harvested for Prussian blue staining. A) Prussian blue positive foci are observed to co-localize more with necrotic tissue than undamaged areas for mice treated with BNF 3mg + 48 kA/m, BNF-IgG 3mg + 48 kA/m or BNF-IgG 3mg + 64 kA/m. B) Quantification of Prussian blue positive areas showed little difference between necrotic areas and MION localization among the study groups. However, necrotic areas in liver correlated with a higher intensity value of blue foci and more wide-range than undamaged areas after MHT, indicating damage was correlated to the presence of MIONs when mice were exposed to AMF.
Figure 6.
Figure 6.. Total iron content in blood, spleens and livers measured by ICP MS revealed higher iron content in spleens of mice injected with antibody-labeled MIONs and correspondingly lower concentrations in livers than mice injected with plain MIONs.
Mice were sacrificed 24 hours after MHT and blood, liver and spleen samples were harvested for ICP-MS. A) ICP-MS analysis of blood samples showed no difference of iron content between PBS injected controls and any treatment groups, indicating complete MION clearance from blood at 24 h after injection. B) Iron measurements of livers showed a dose dependent increase of MION accumulation, and differences between BNF and BNF-IgG accumulation, with less of the latter depositing to the liver for a given dose. C) A dose dependent accumulation of MIONs was measured in spleens of mice. Contrary to liver accumulation, splenic accumulation of BNF-IgG was higher than that of BNF at a comparable injected dose.
Fig 7.
Fig 7.. Hemosiderin foci indicating MION deposits correlated with necrotic tissue in liver.
A) Representative images of serial liver sections stained with Prussian blue (left column) and H&E (right column) showing co-localization of necrotic areas with Prussian blue stained regions. B) Quantification of Prussian blue positive and necrotic areas from Aperio Imagescope analysis software (from A) showed a positive correlation between blue stained foci and areas of necrosis, providing further biological evidence of direct tissue damage from MIONs when exposed to AMF. The negative correlation coefficient for the highest AMF condition (64 kA/m) indicates heating zones away from MION deposits due to heat transfer, a demonstration of effects of local ‘hotspots’ created by MIONs inflicting tissue damage to more distant portions of the liver.
Figure 8.
Figure 8.. Analysis of liver enzyme panel revealed higher concentrations associated with liver damage following treatment with MIONs and high AMF amplitudes.
A) Blood-ALP levels showed higher variability with BNFI3+48 kA/m and BNFI3+64 kA/m groups when compared to controls. Blood-ALP levels did not show any difference in any of the BNF treated groups when compared to that of controls. All other groups were in the normal range. B) BNF and BNF-IgG3+48 kA/m and BNFI3+64 kA/m groups showed increased AST in blood. All other groups were in the normal range. C) Measured blood-LDH levels were increased following BNF3 + 48 kA/m, BNFI3 + 48 kA/m and BNFI3 + 64 kA/m treatment combinations. D) Measured blood-ALT levels were also increased following treatment with BNF3 + 48 kA/m, BNFI3 + 48 kA/m and BNFI3 + 64 kA/m groups. An increase was also noted in BNF5 + 32 kA/m treated mice. *N.D: Blood samples were not collected due to death of animals in BNF3 + 64 kA/m, BNF5 + 48 kA/m and BNFI5 + 48 kA/m treatment groups.
Figure 9.
Figure 9.. Estimates of MION energy deposited in livers was higher than that in spleens.
A) Total energy deposited was estimated using MION SLP values from Figure 1C, mean iron recovered from organs (Figures 6B and 6C), and AMF amplitude and treatment time (1,200 s). Considerable energy was deposited in livers with BNF/BNF-IgG 3mg Fe and 64 kA/m and BNF/BNF-IgG 5mg Fe and 48 kA/m. The dashed horizontal line represents an estimated maximum tolerated total energy deposition to livers using data from Table 3. B) Results of estimates as in A), but for data obtained from spleens. Unlike for livers, iron recovery from spleens was higher for BNF-IgG than for spleens of mice injected with BNF; but, the total iron load in spleens was less thus the overall energy deposited to spleens was significantly lower than that deposited in livers.

Similar articles

Cited by

References

    1. Gilchrist R, Medal R, Shorey WD, Hanselman RC, Parrott JC & Taylor CB Selective inductive heating of lymph nodes. Annals of surgery, 146; 596 (1957). - PMC - PubMed
    1. Weinstein JS, Varallyay CG, Dosa E, Gahramanov S, Hamilton B, Rooney WD, Muldoon LL & Neuwelt EA Superparamagnetic iron oxide nanoparticles: diagnostic magnetic resonance imaging and potential therapeutic applications in neurooncology and central nervous system inflammatory pathologies, a review. J Cereb Blood Flow Metab, 30, 15–35 (2010). - PMC - PubMed
    1. Ivkov R Magnetic nanoparticle hyperthermia: A new frontier in biology and medicine? Taylor & Francis, 29(8), 703–705 (2013). - PubMed
    1. Kandasamy G & Maity D Recent advances in superparamagnetic iron oxide nanoparticles (SPIONs) for in vitro and in vivo cancer nanotheranostics. Int J Pharm, 496, 191–218 (2015). - PubMed
    1. Theil EC Iron, ferritin, and nutrition. Annual Review of Nutrition, 24, 327–343 (2004). - PubMed

Publication types