. 2021 Feb 1;125(2):358-384.
doi: 10.1152/jn.00561.2020. Epub 2020 Dec 2.

The detailed organization of the human cerebellum estimated by intrinsic functional connectivity within the individual

Affiliations

The detailed organization of the human cerebellum estimated by intrinsic functional connectivity within the individual

Aihuiping Xue et al. J Neurophysiol. .

Abstract

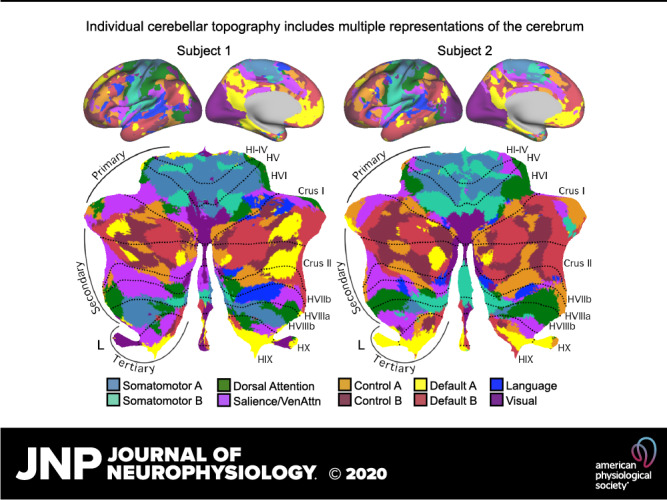
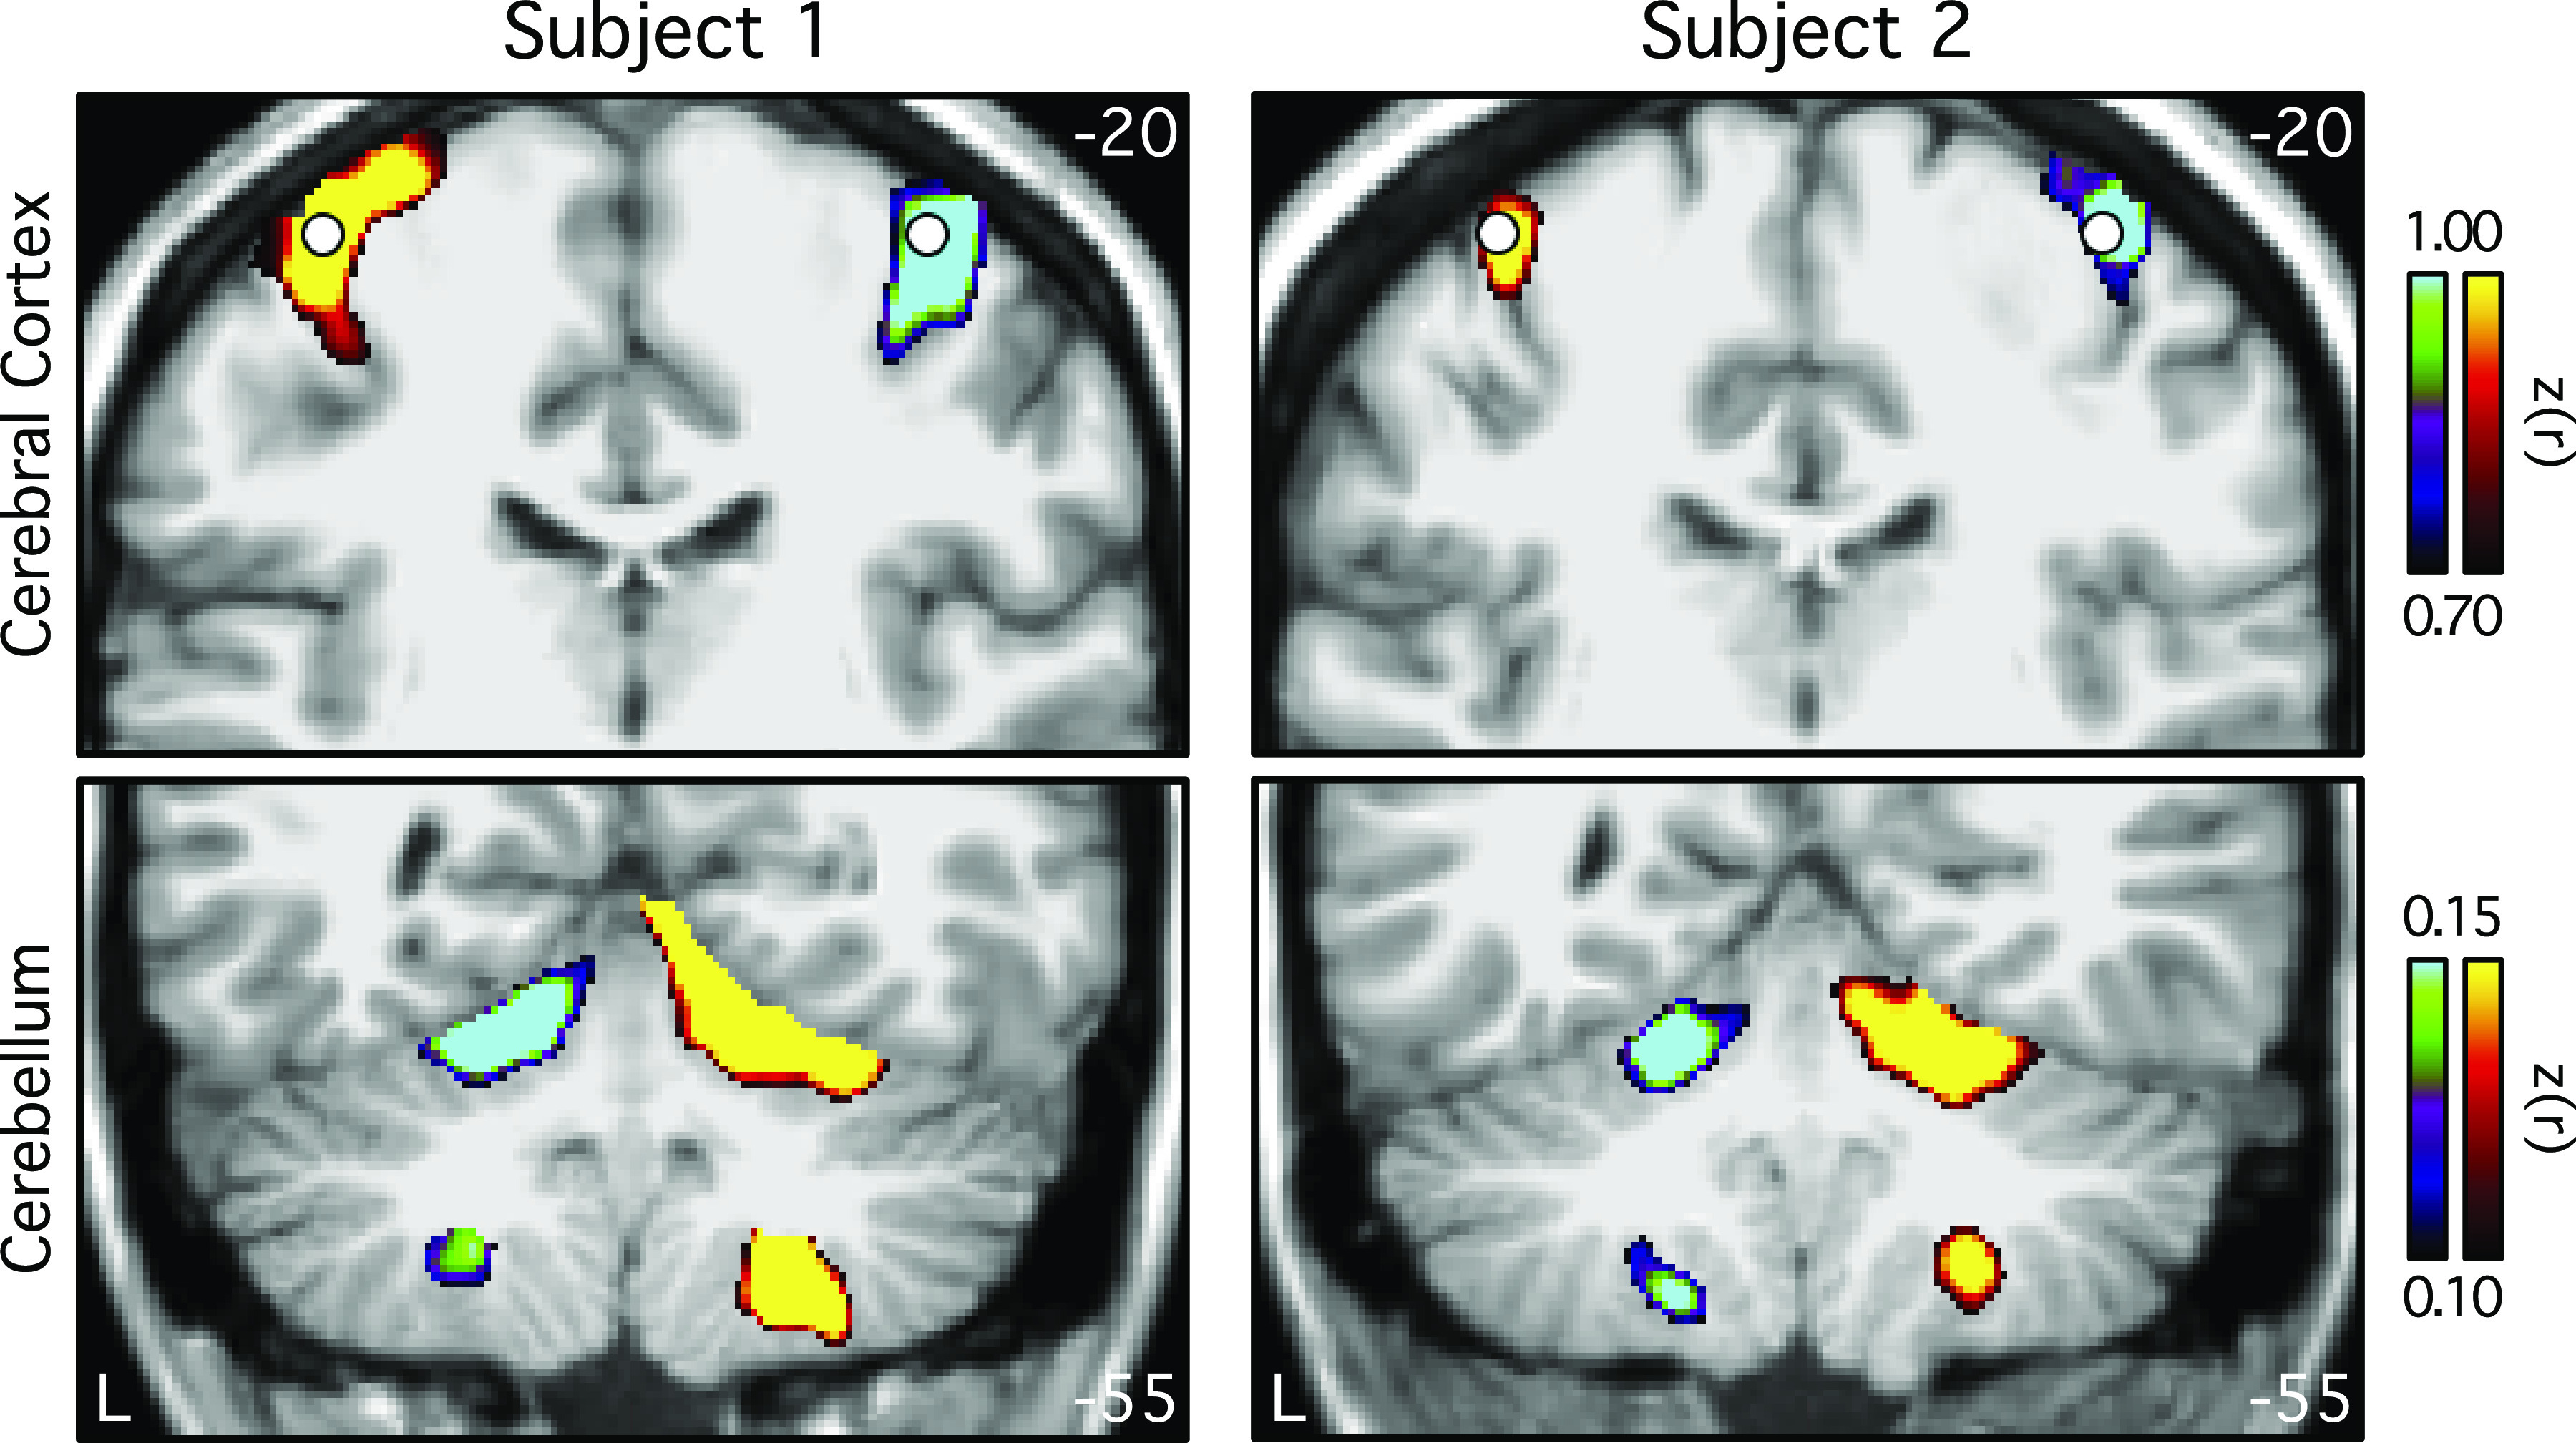
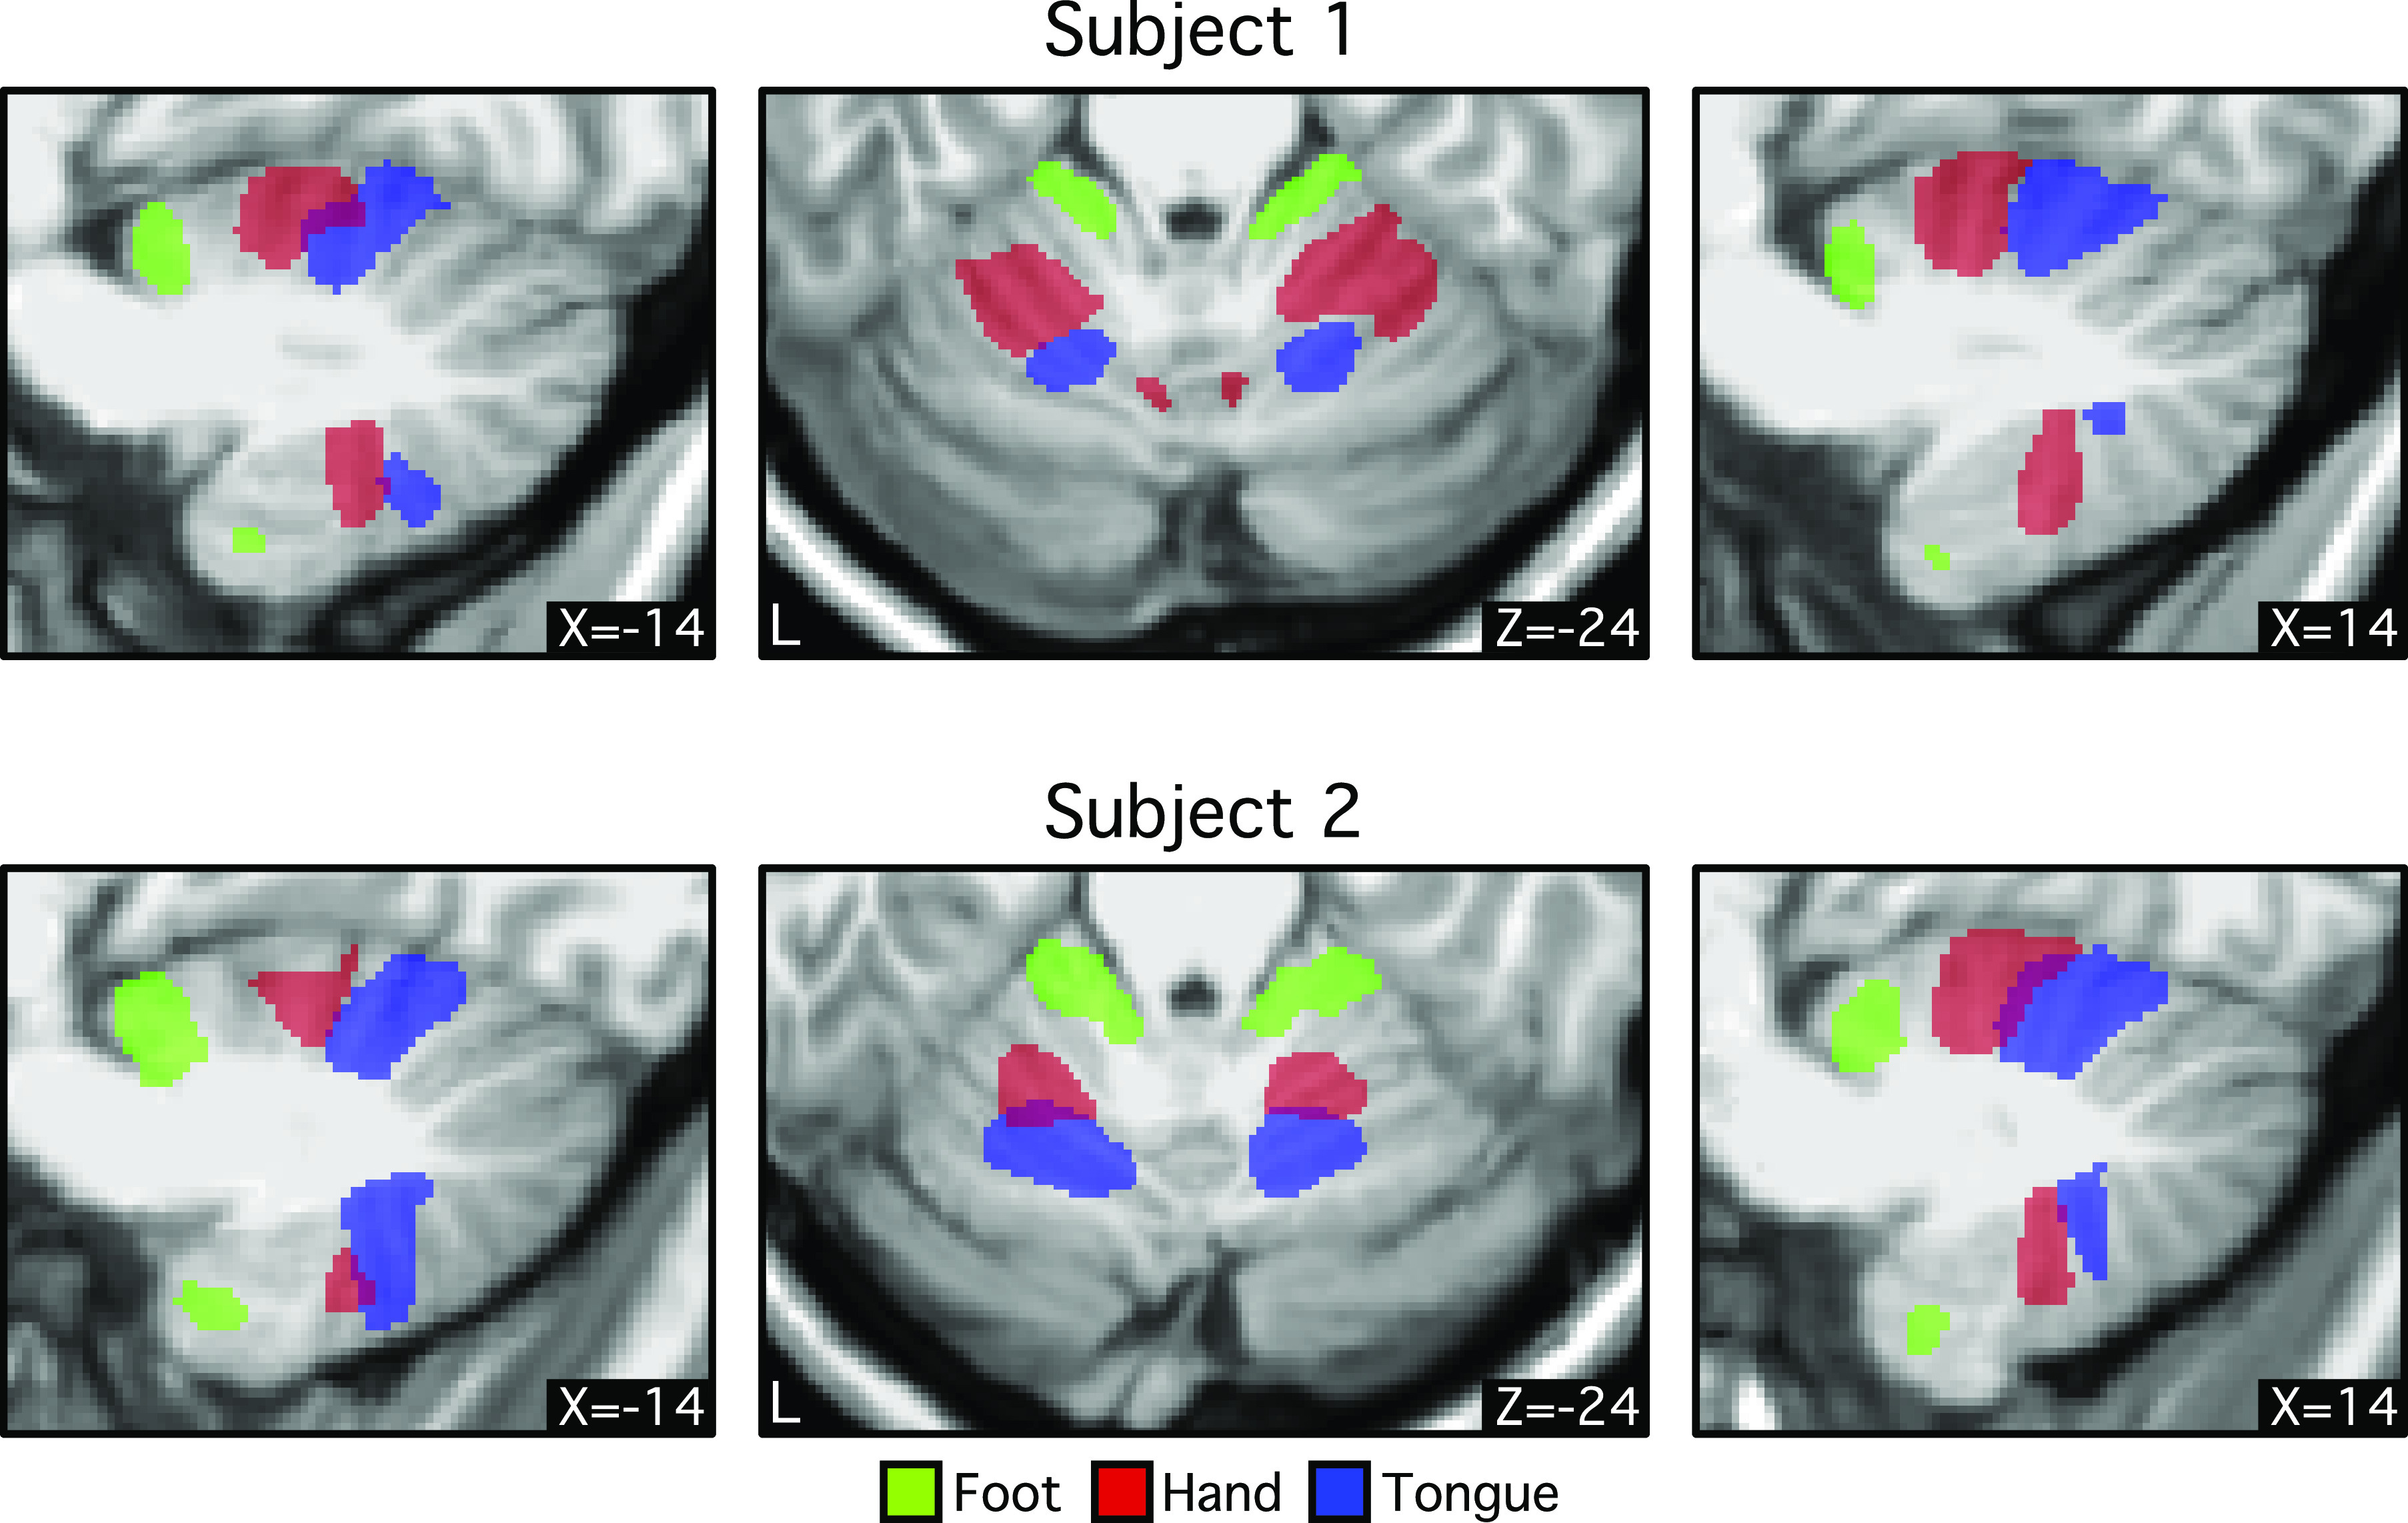
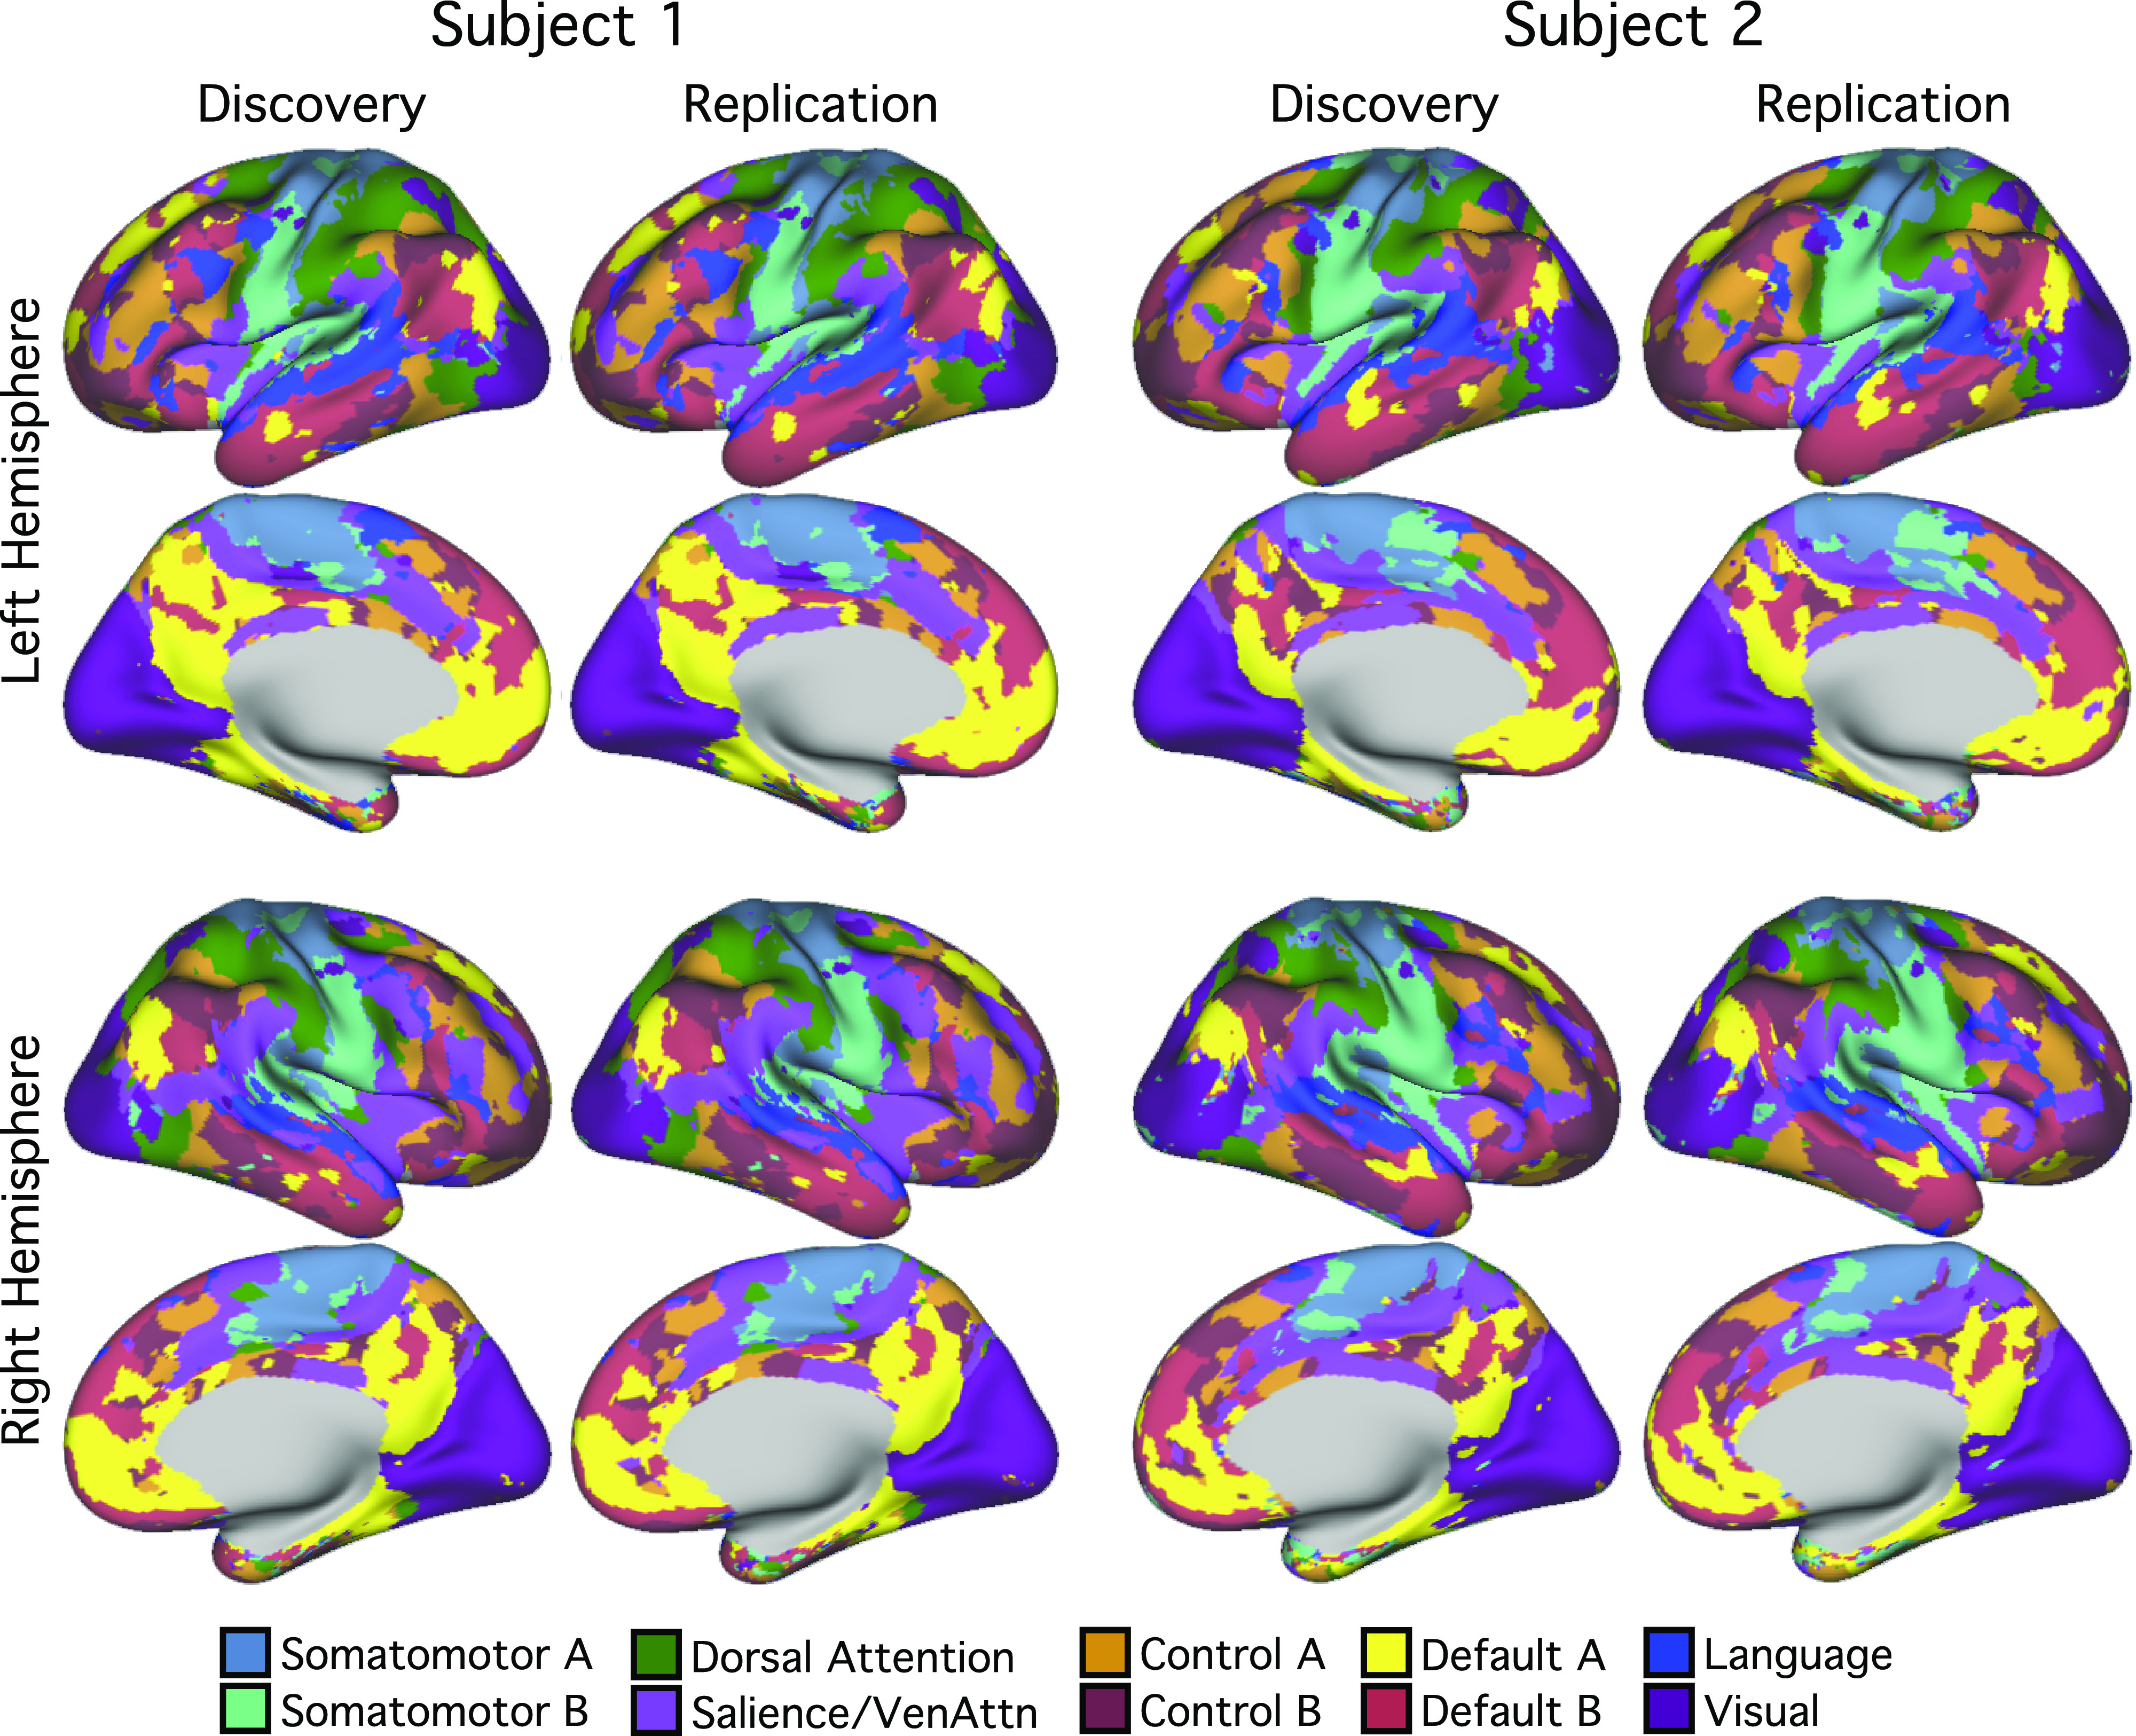
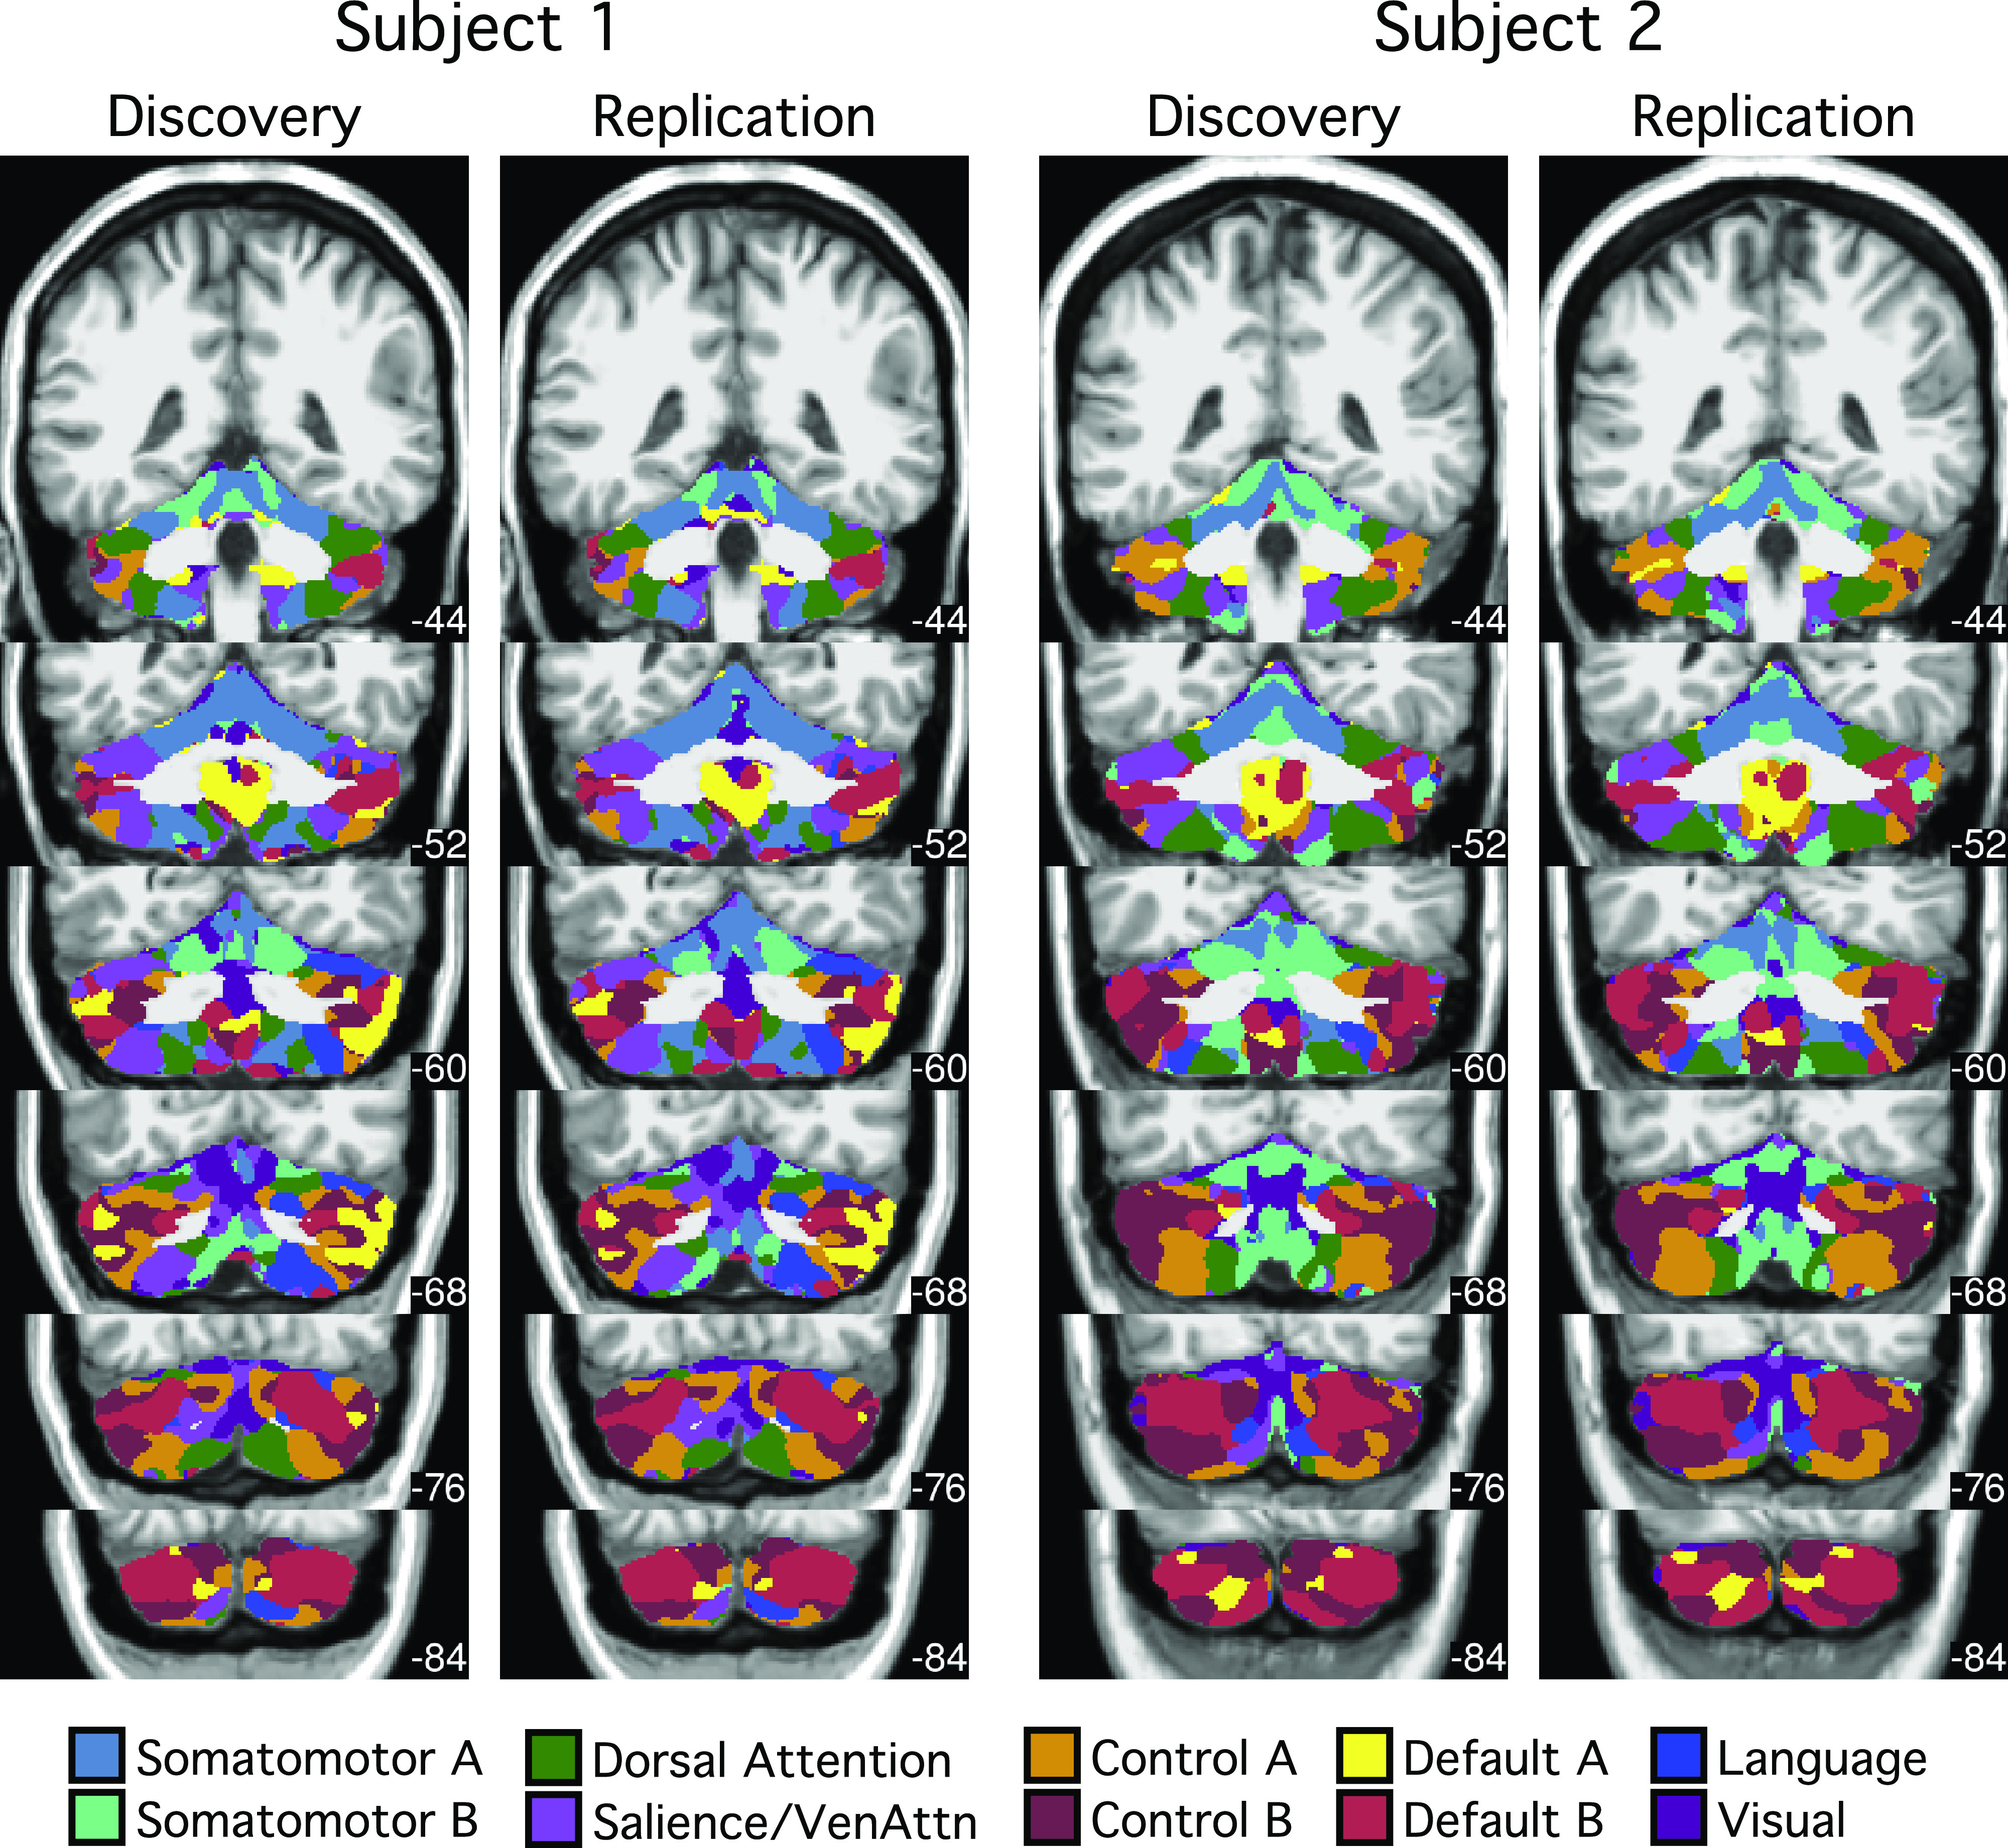
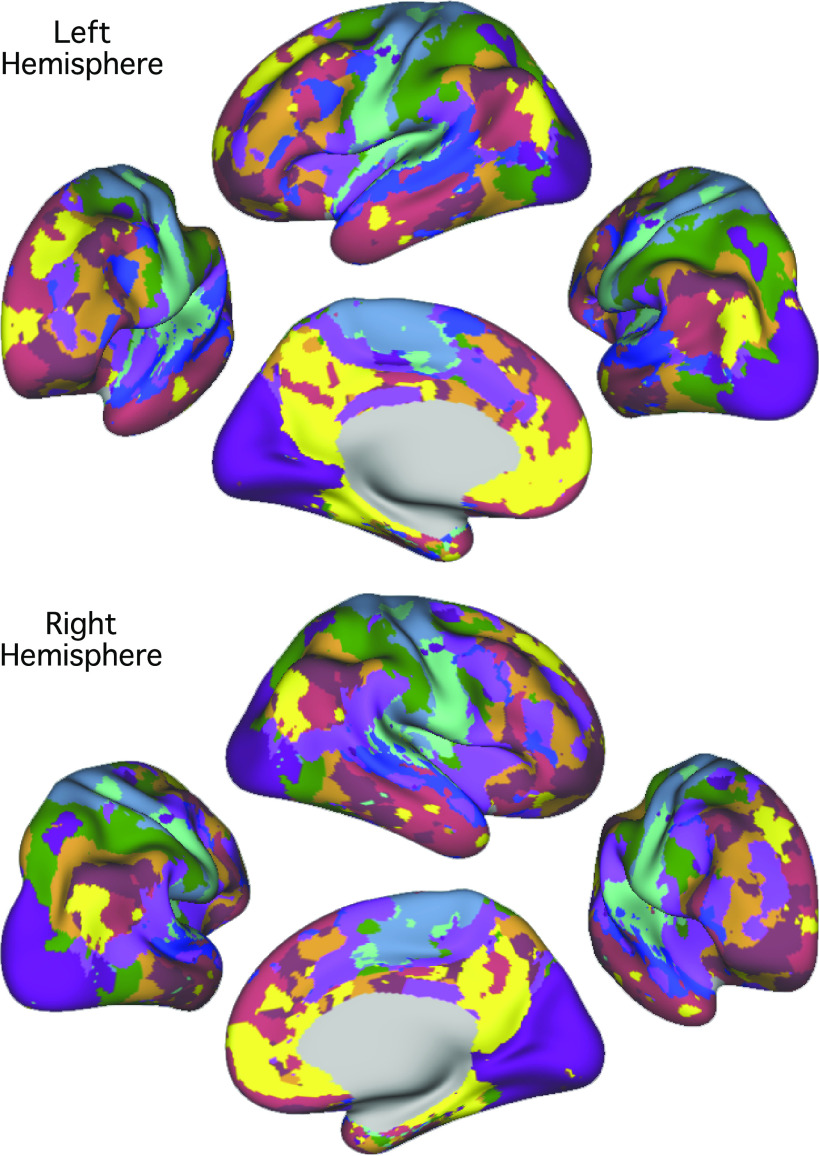
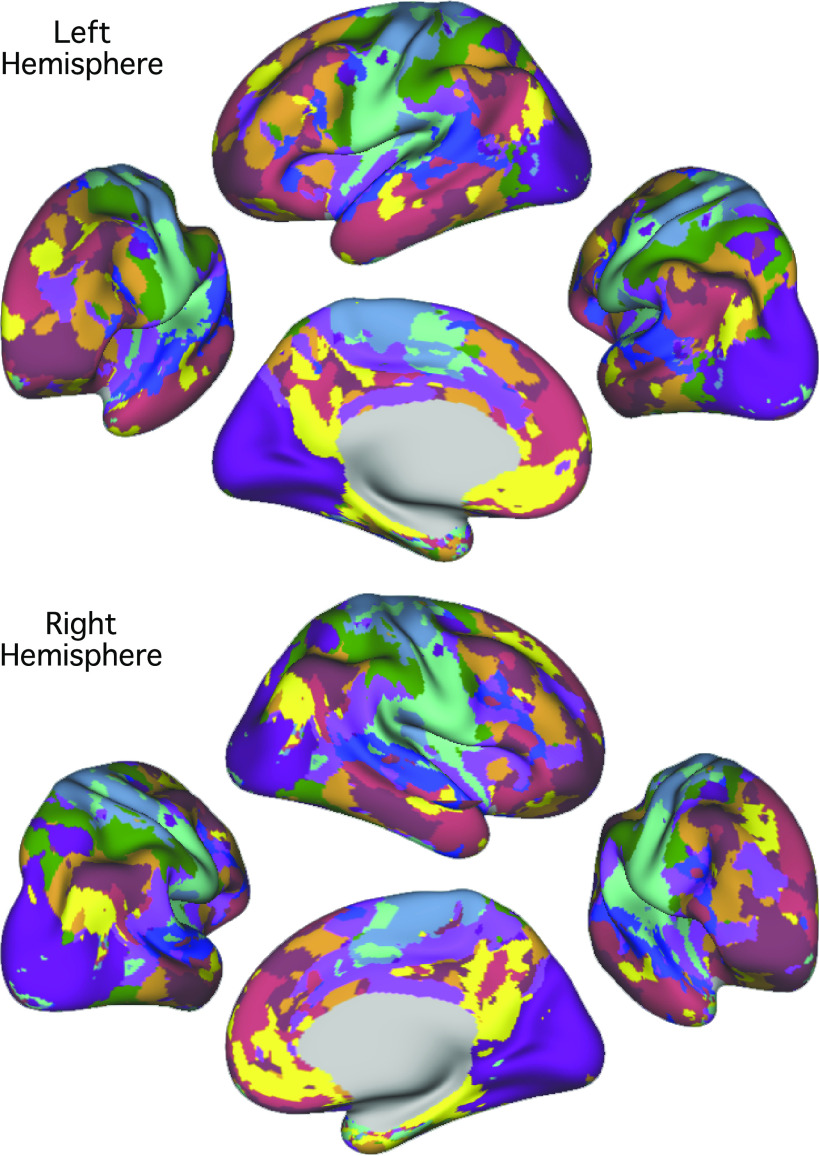
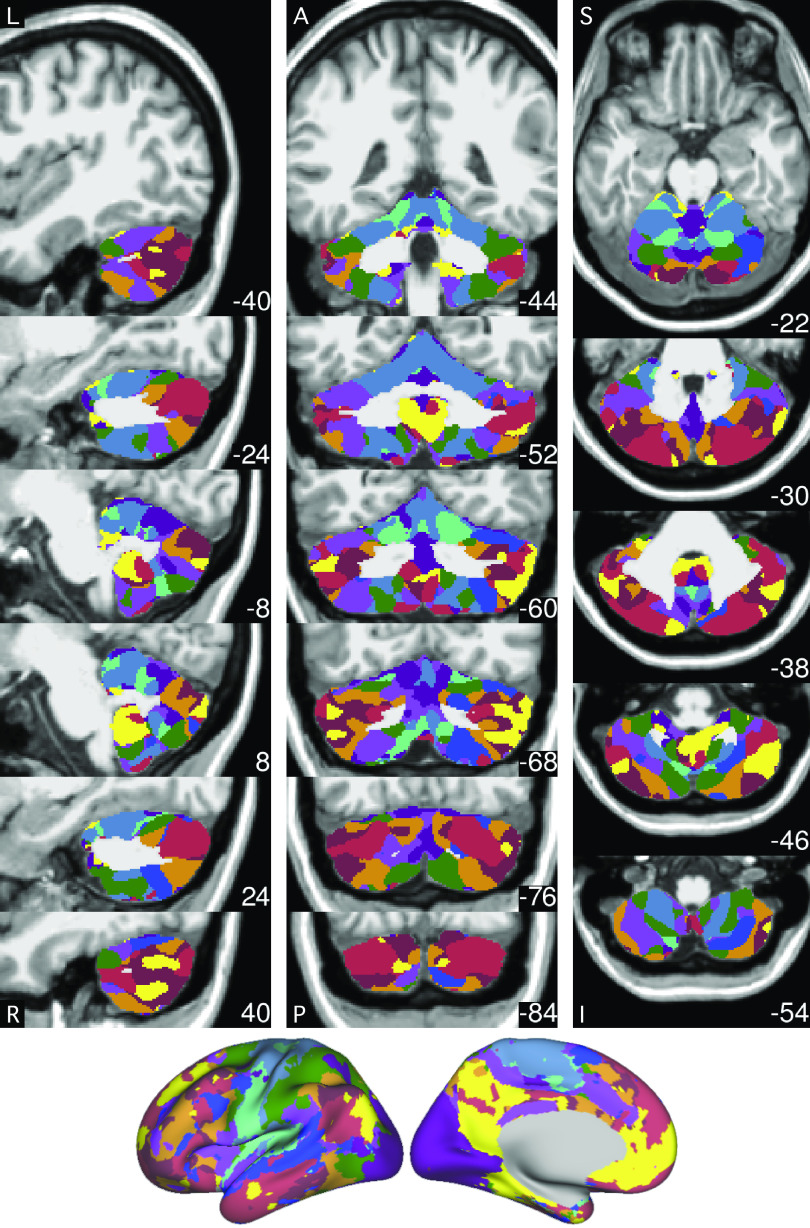
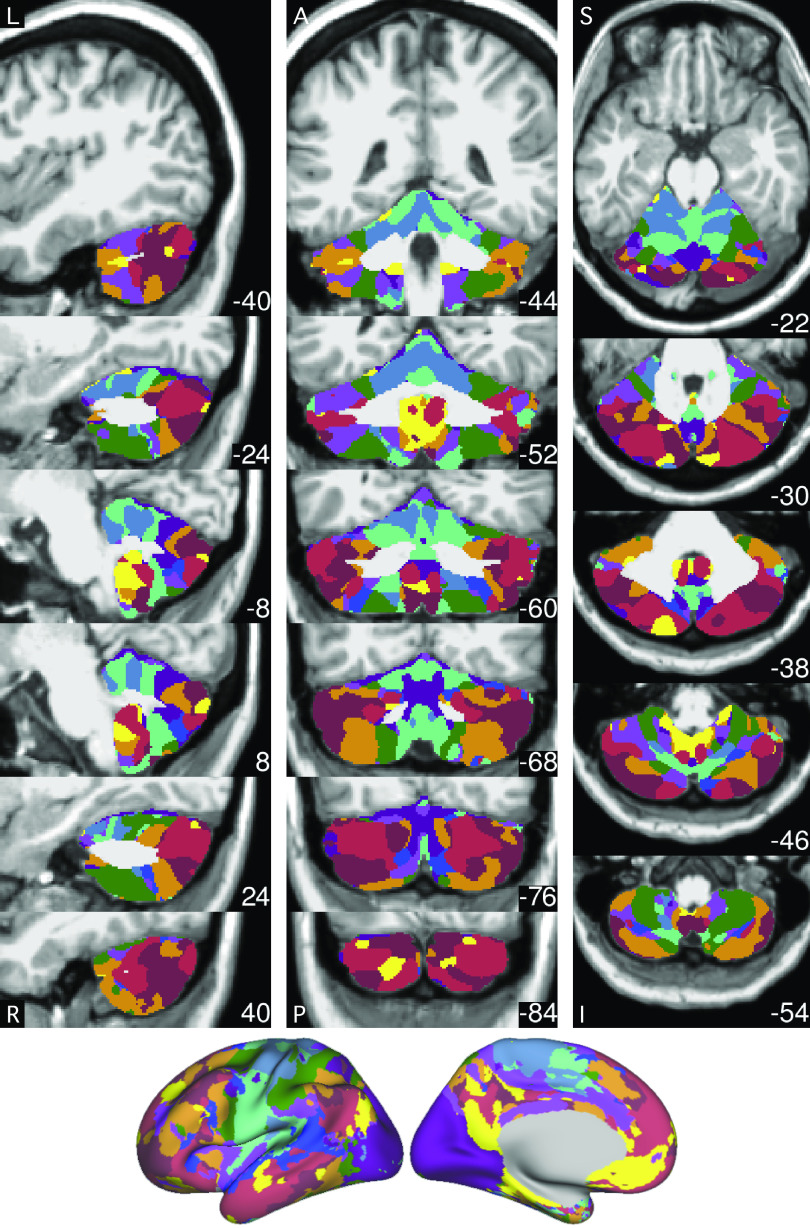
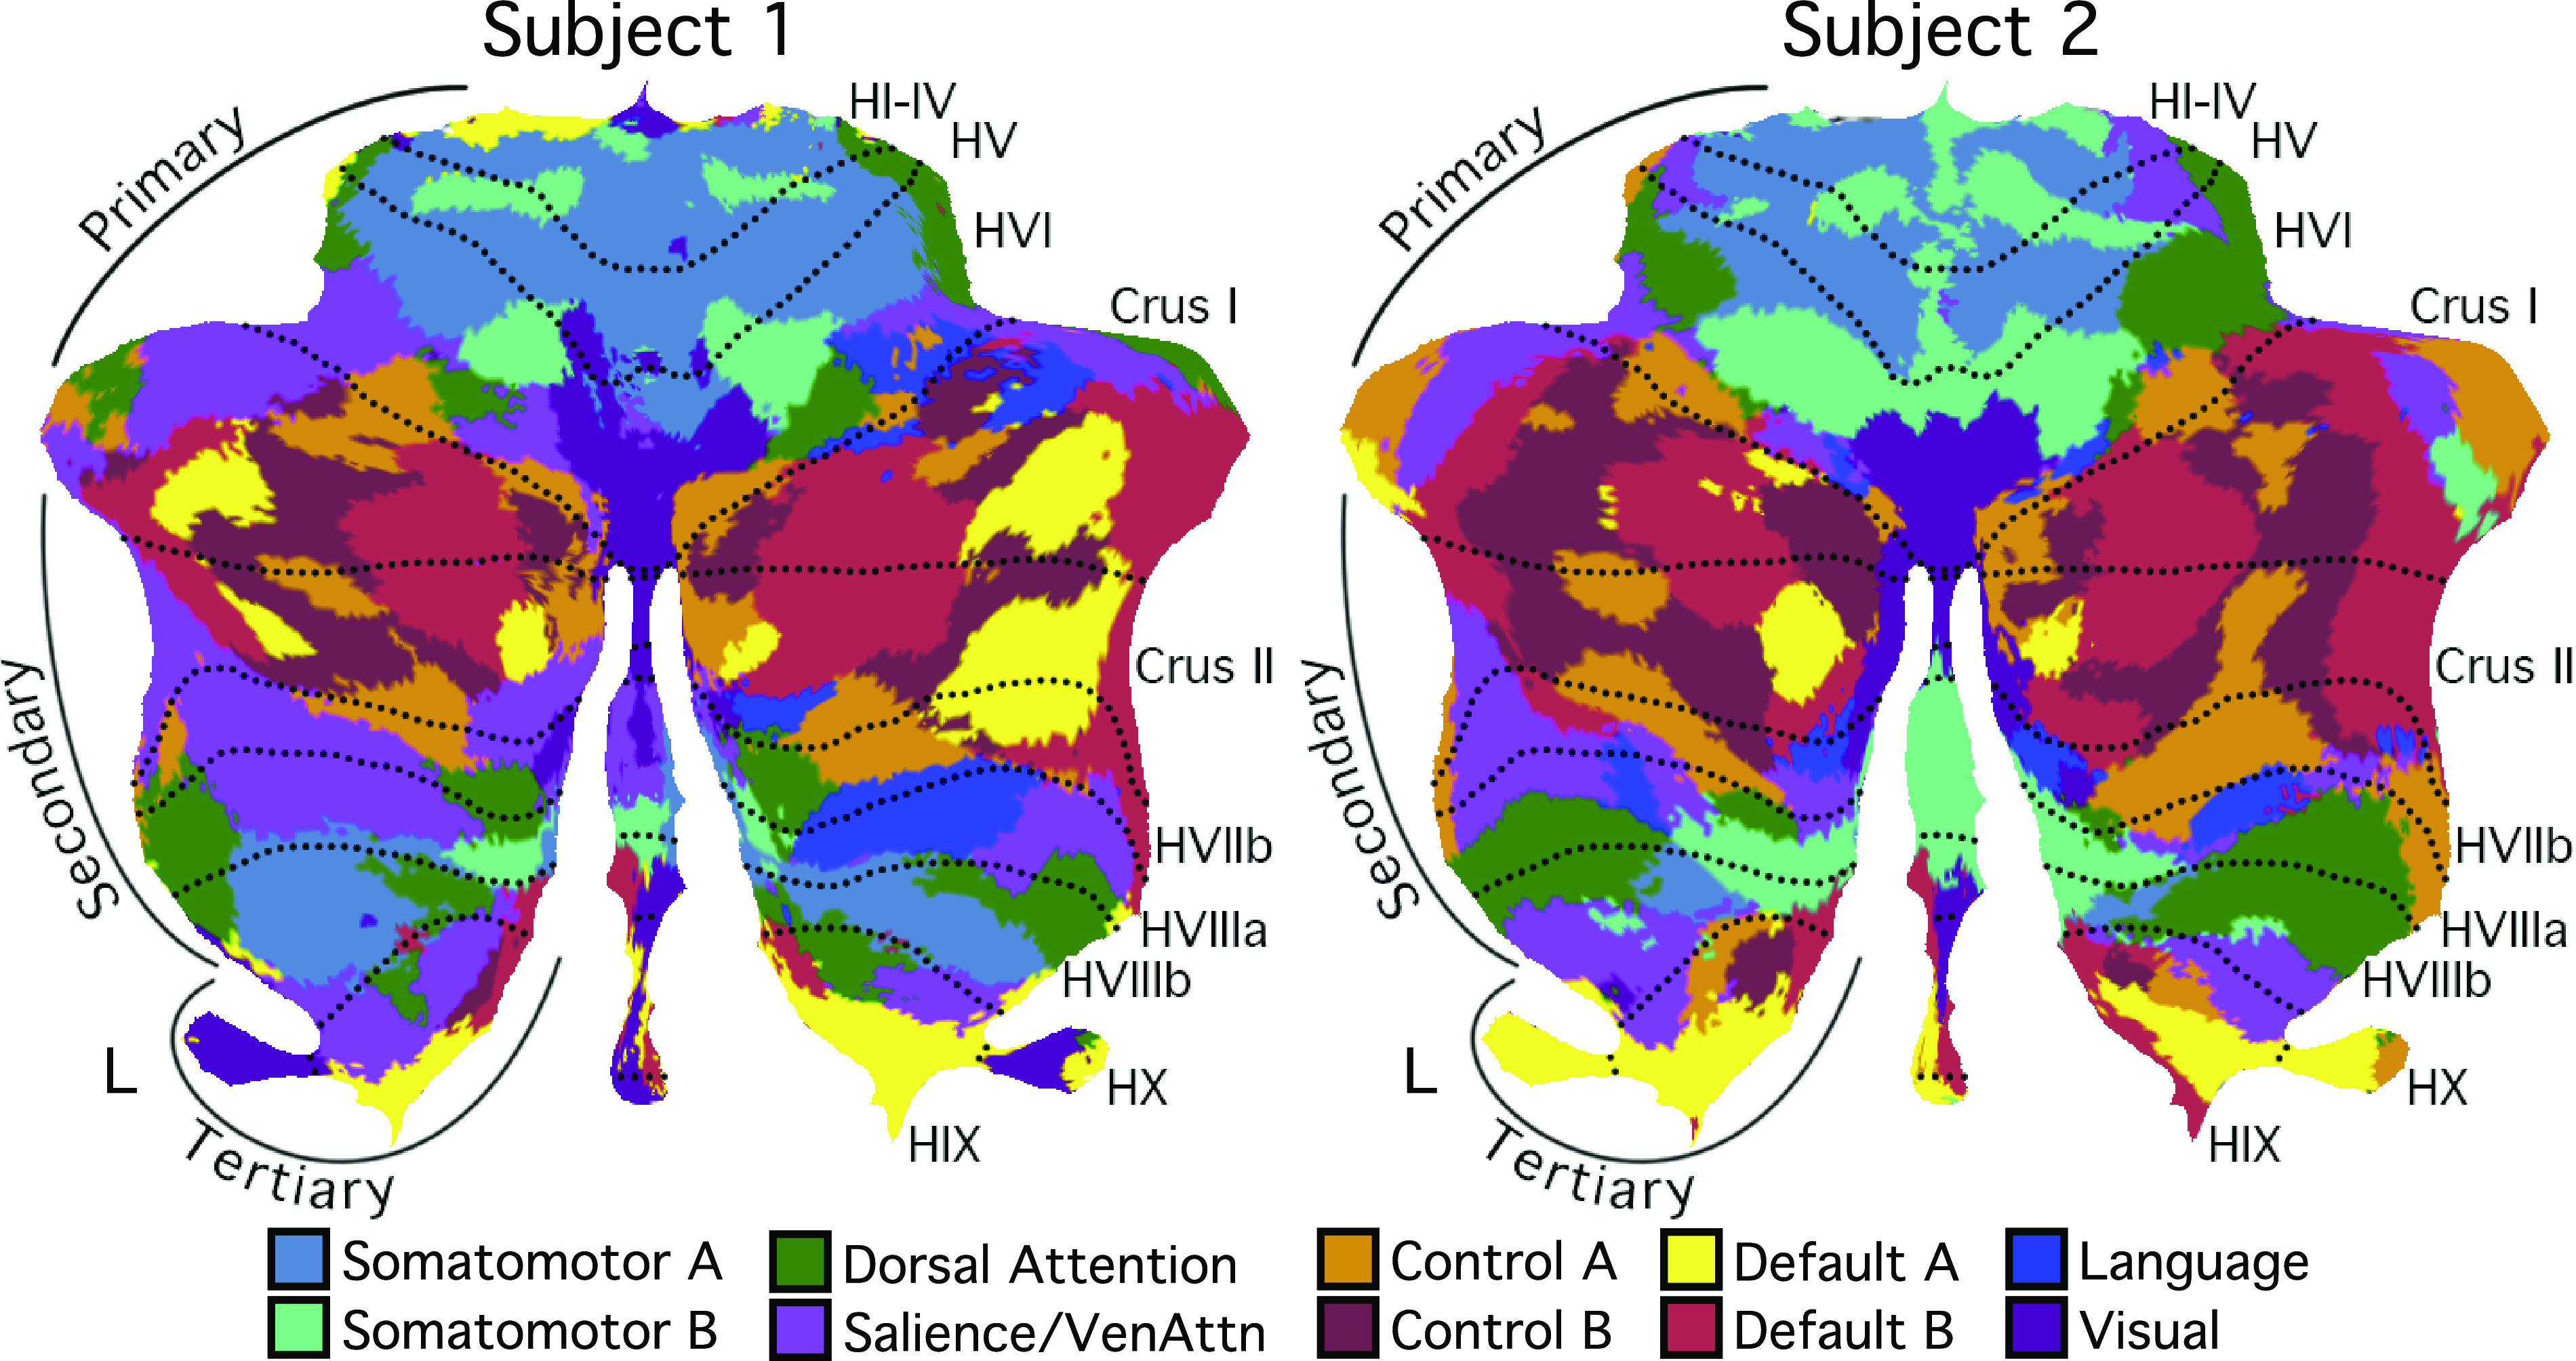
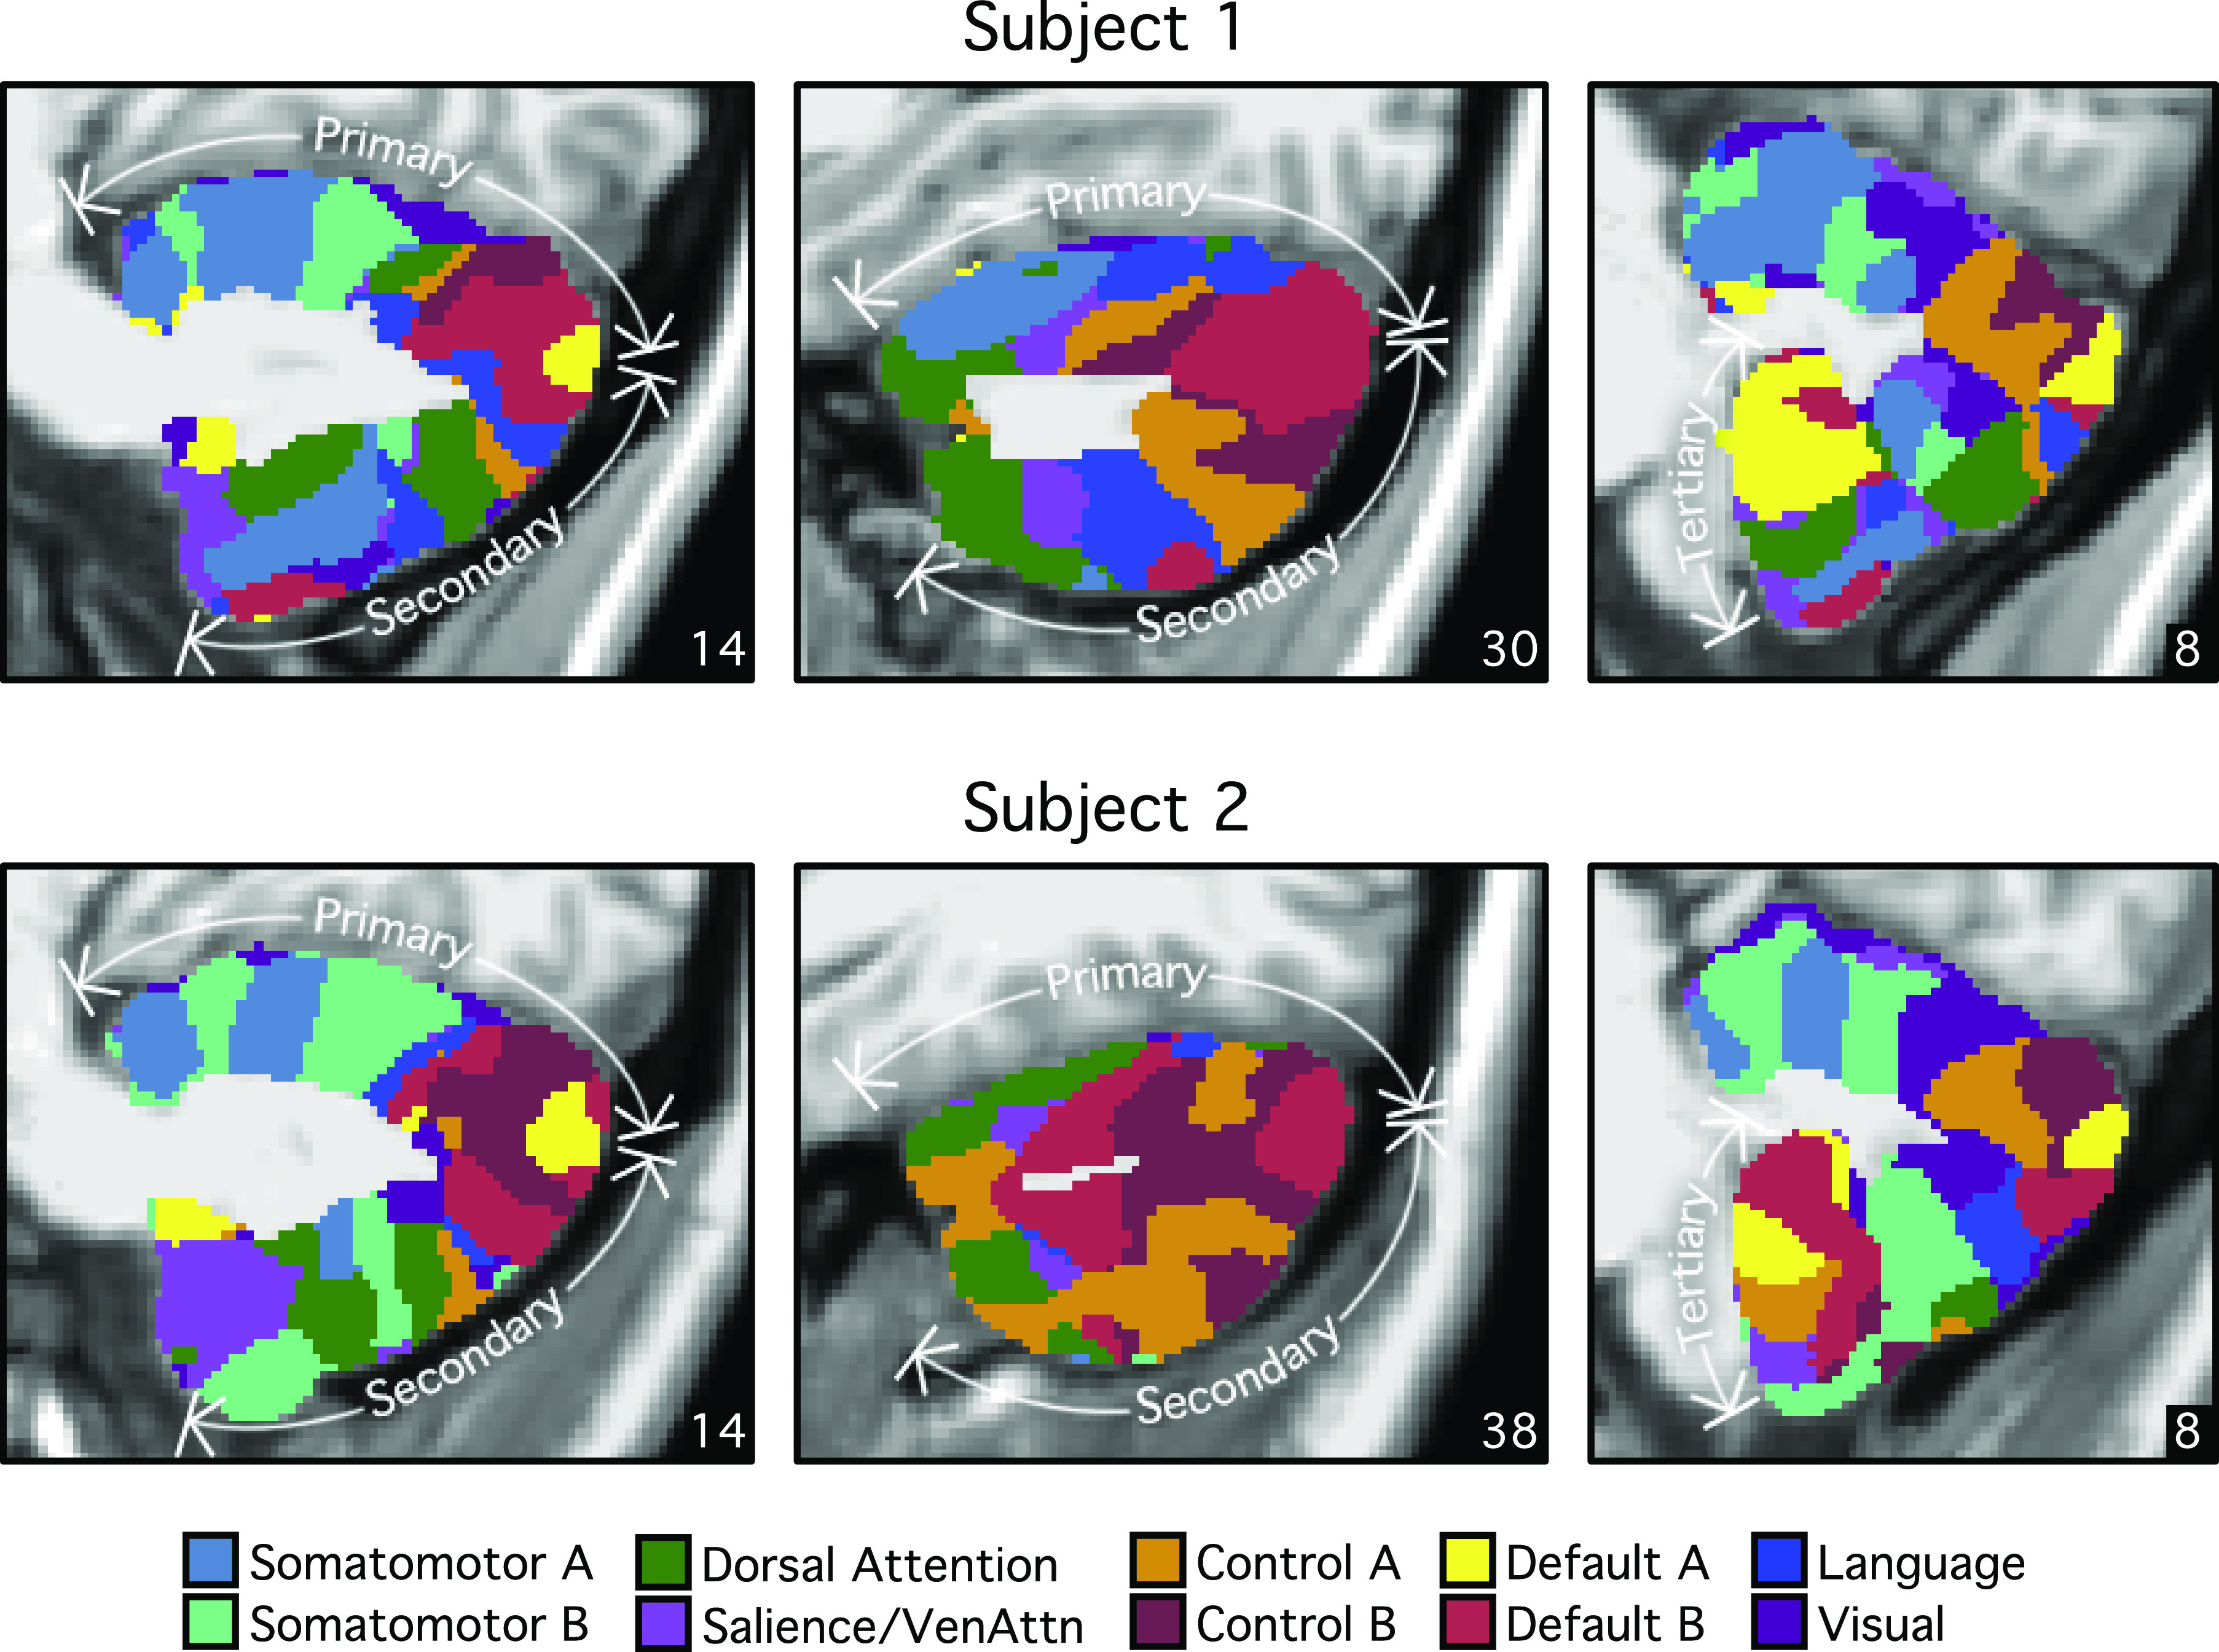
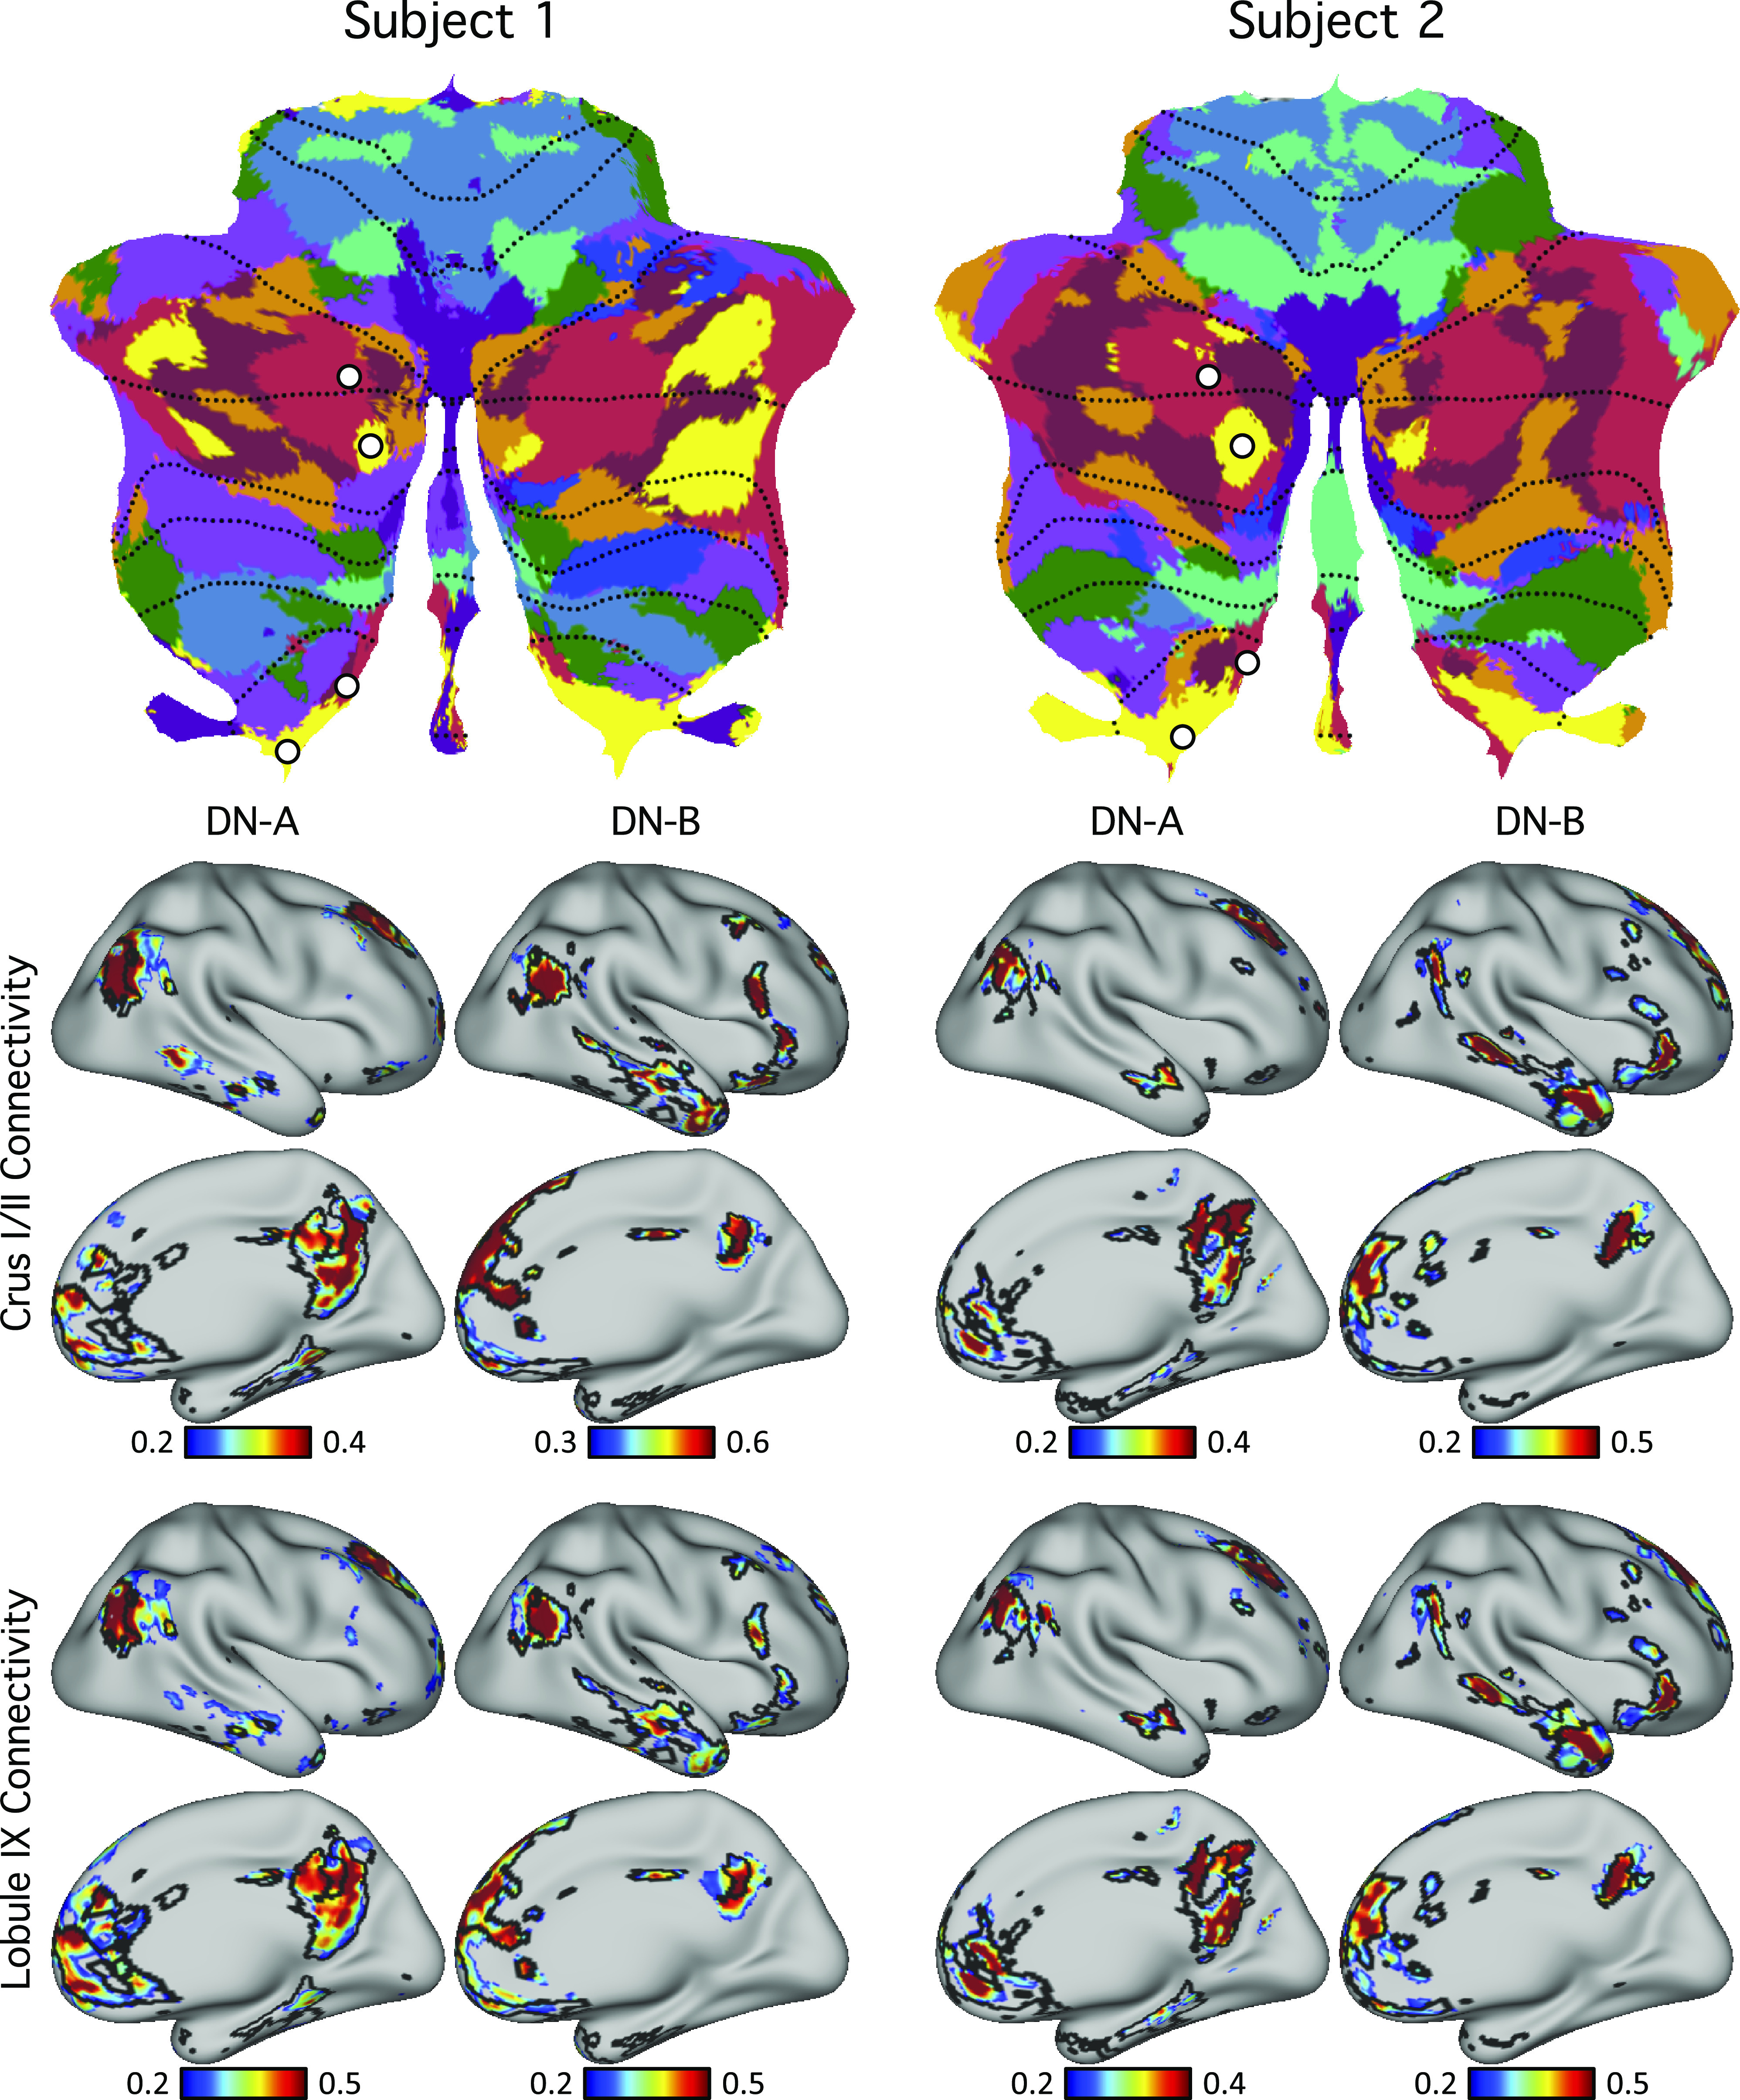
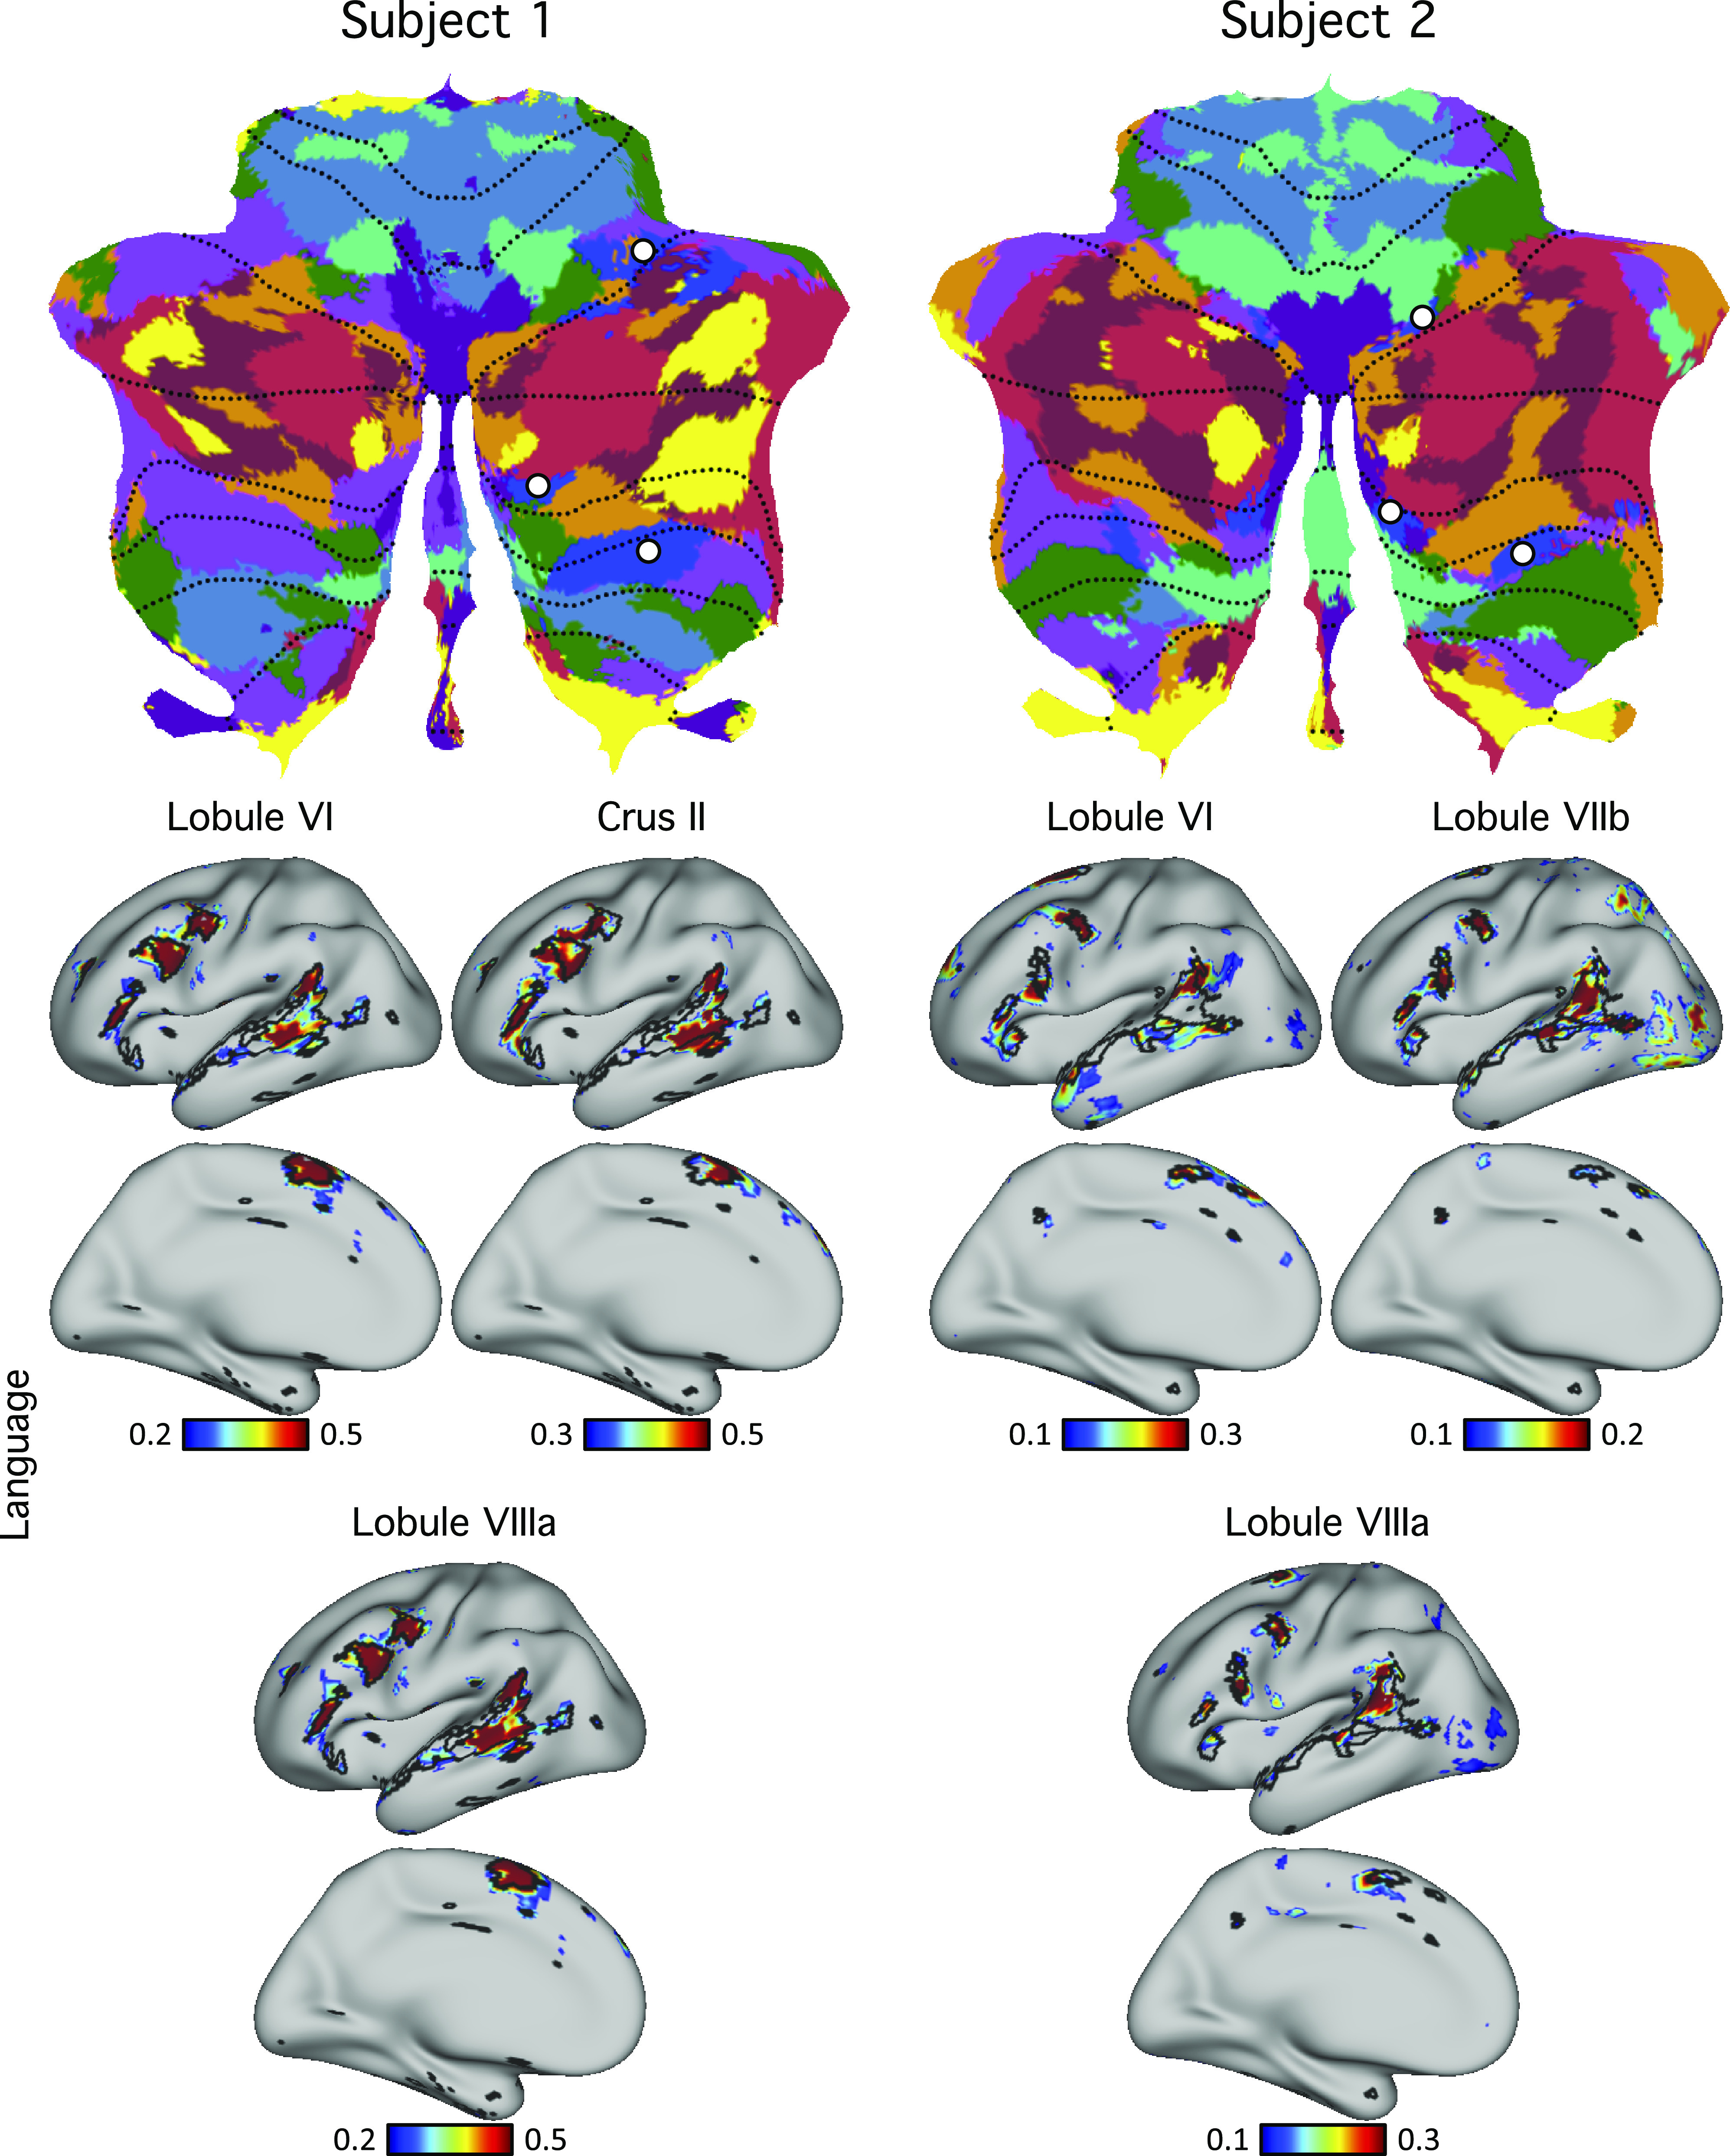
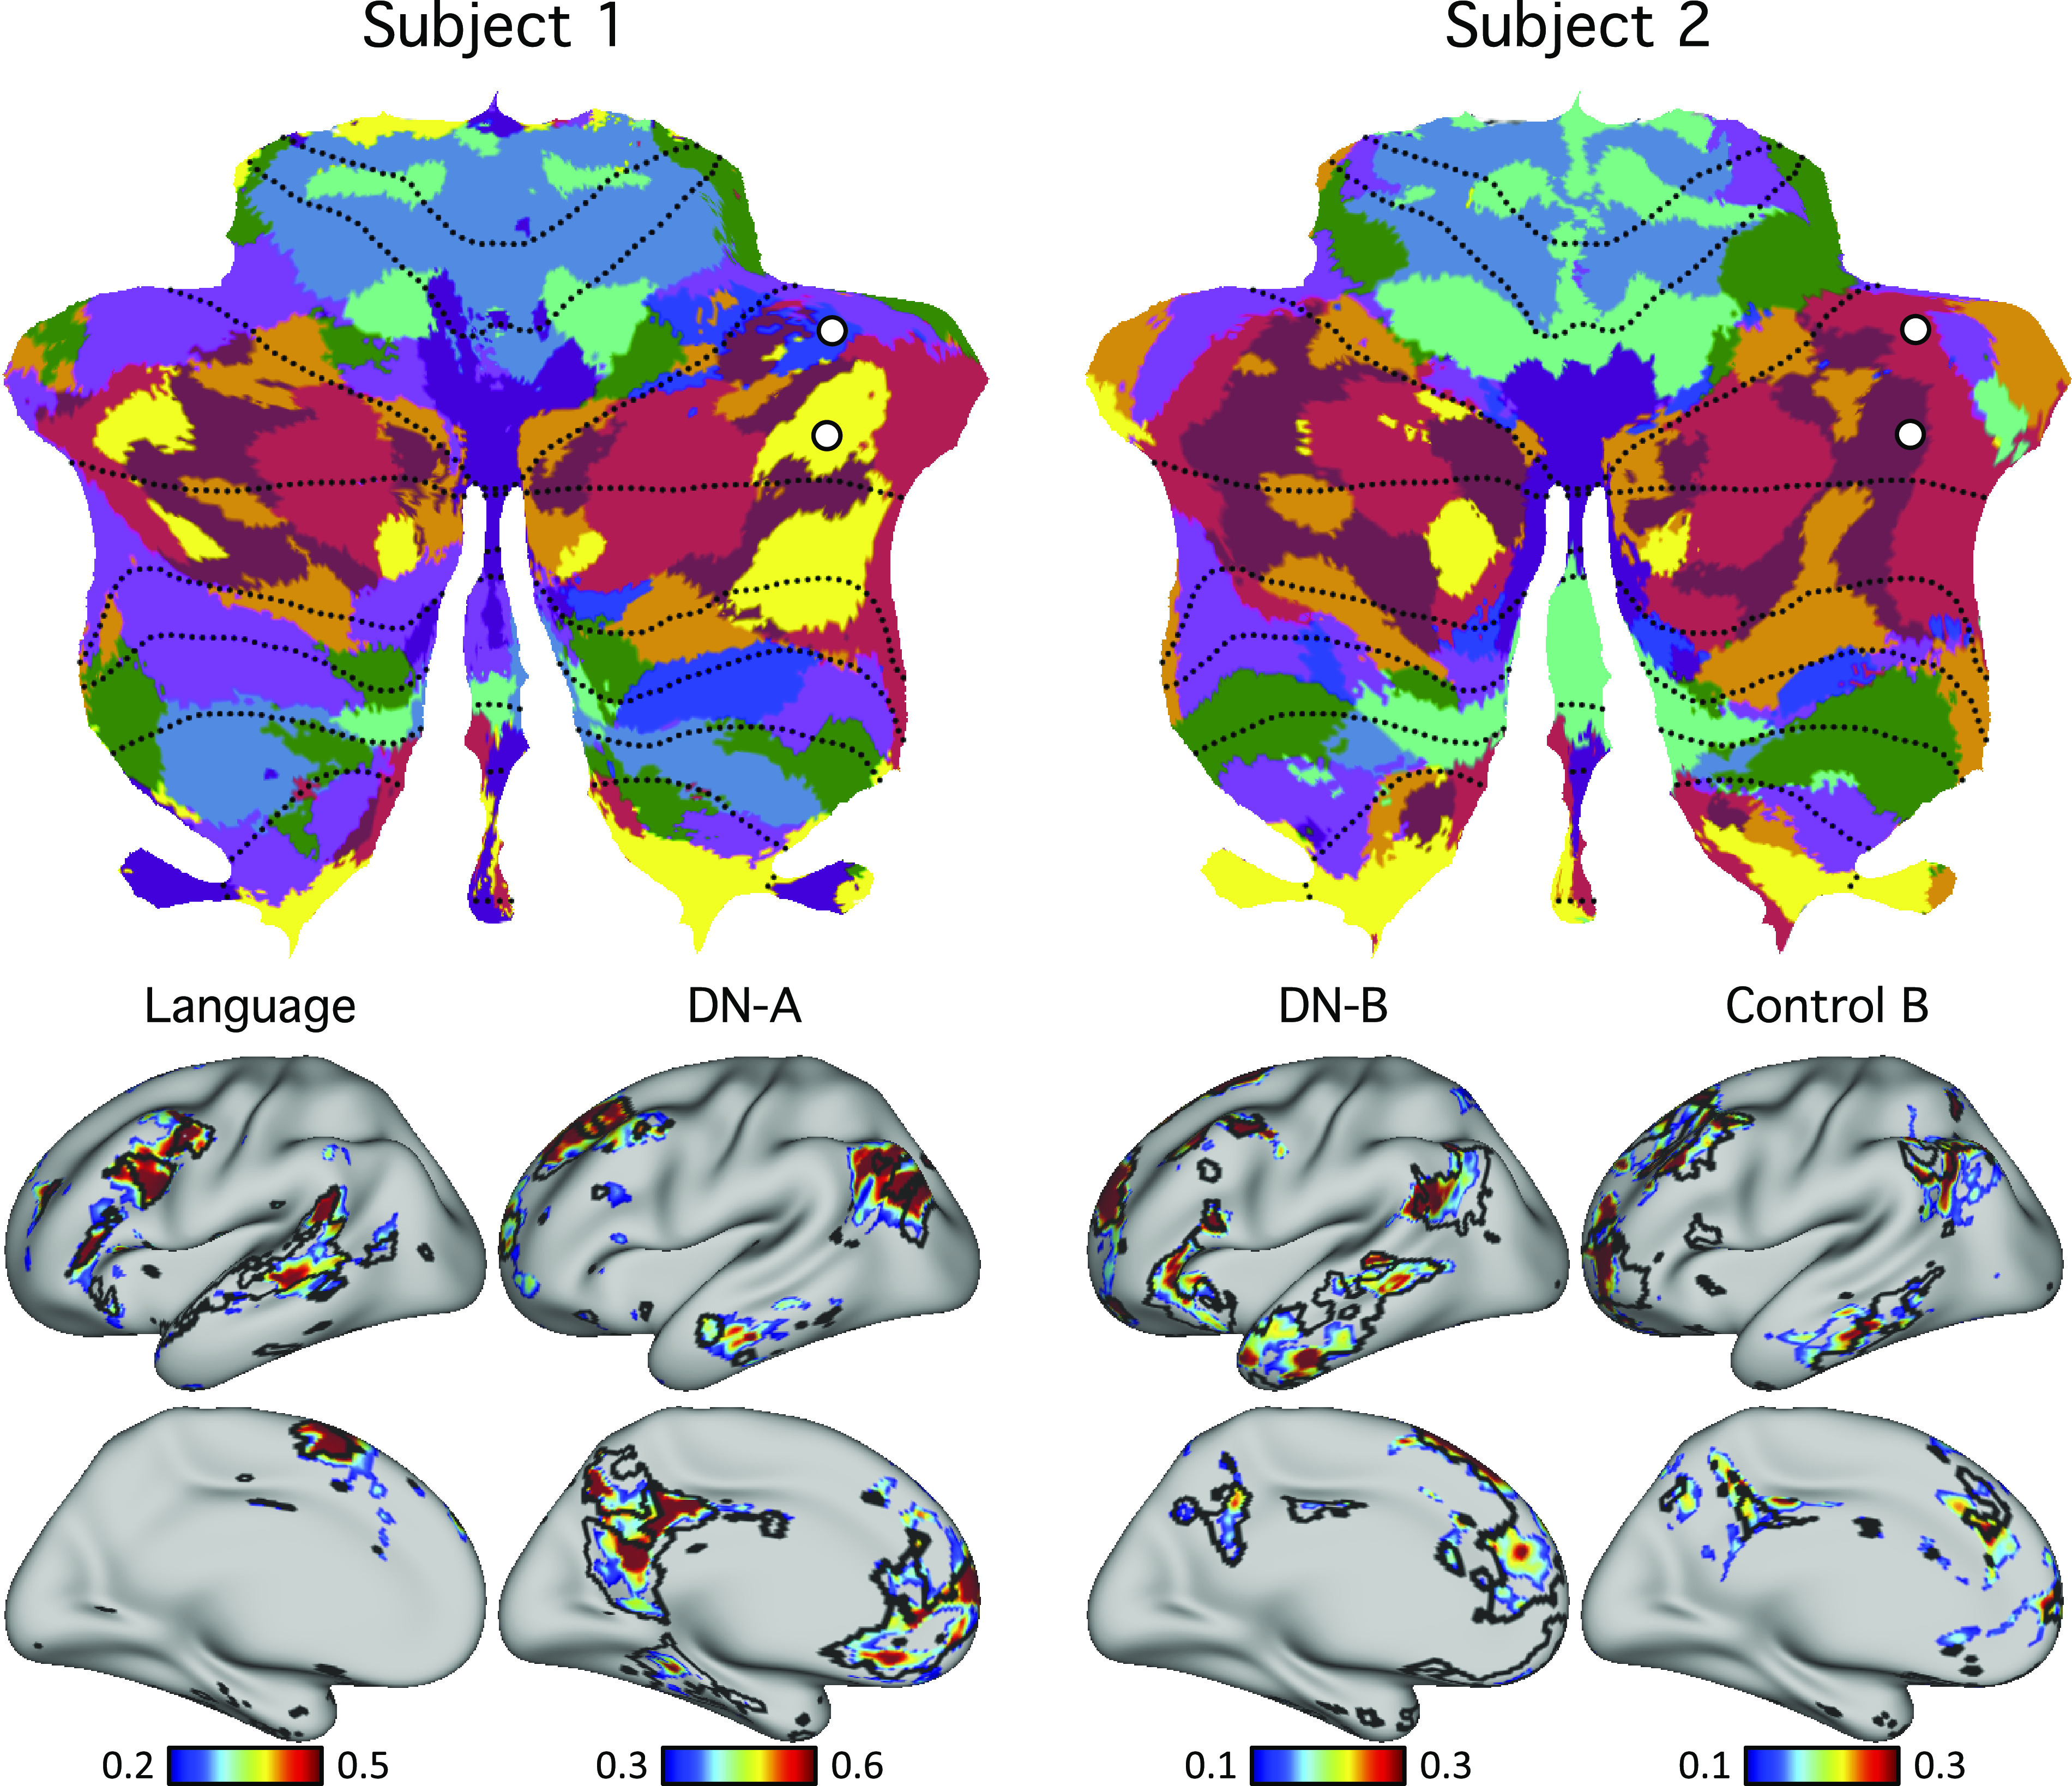
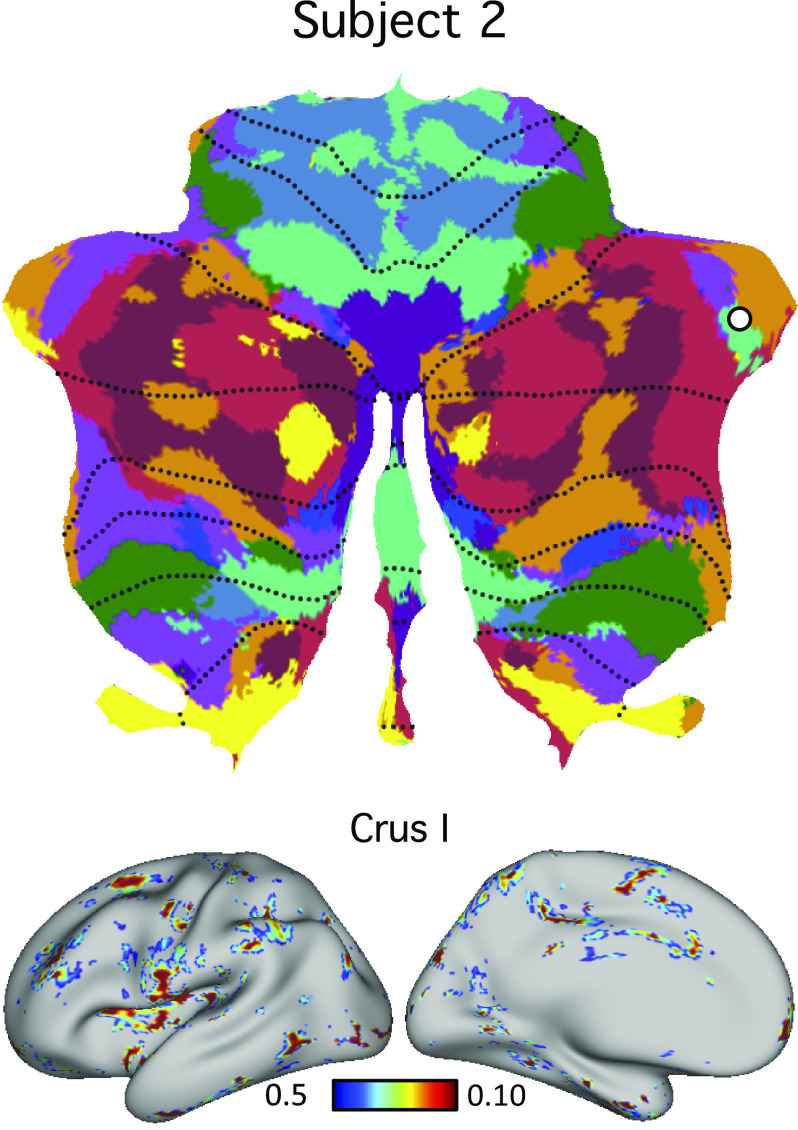
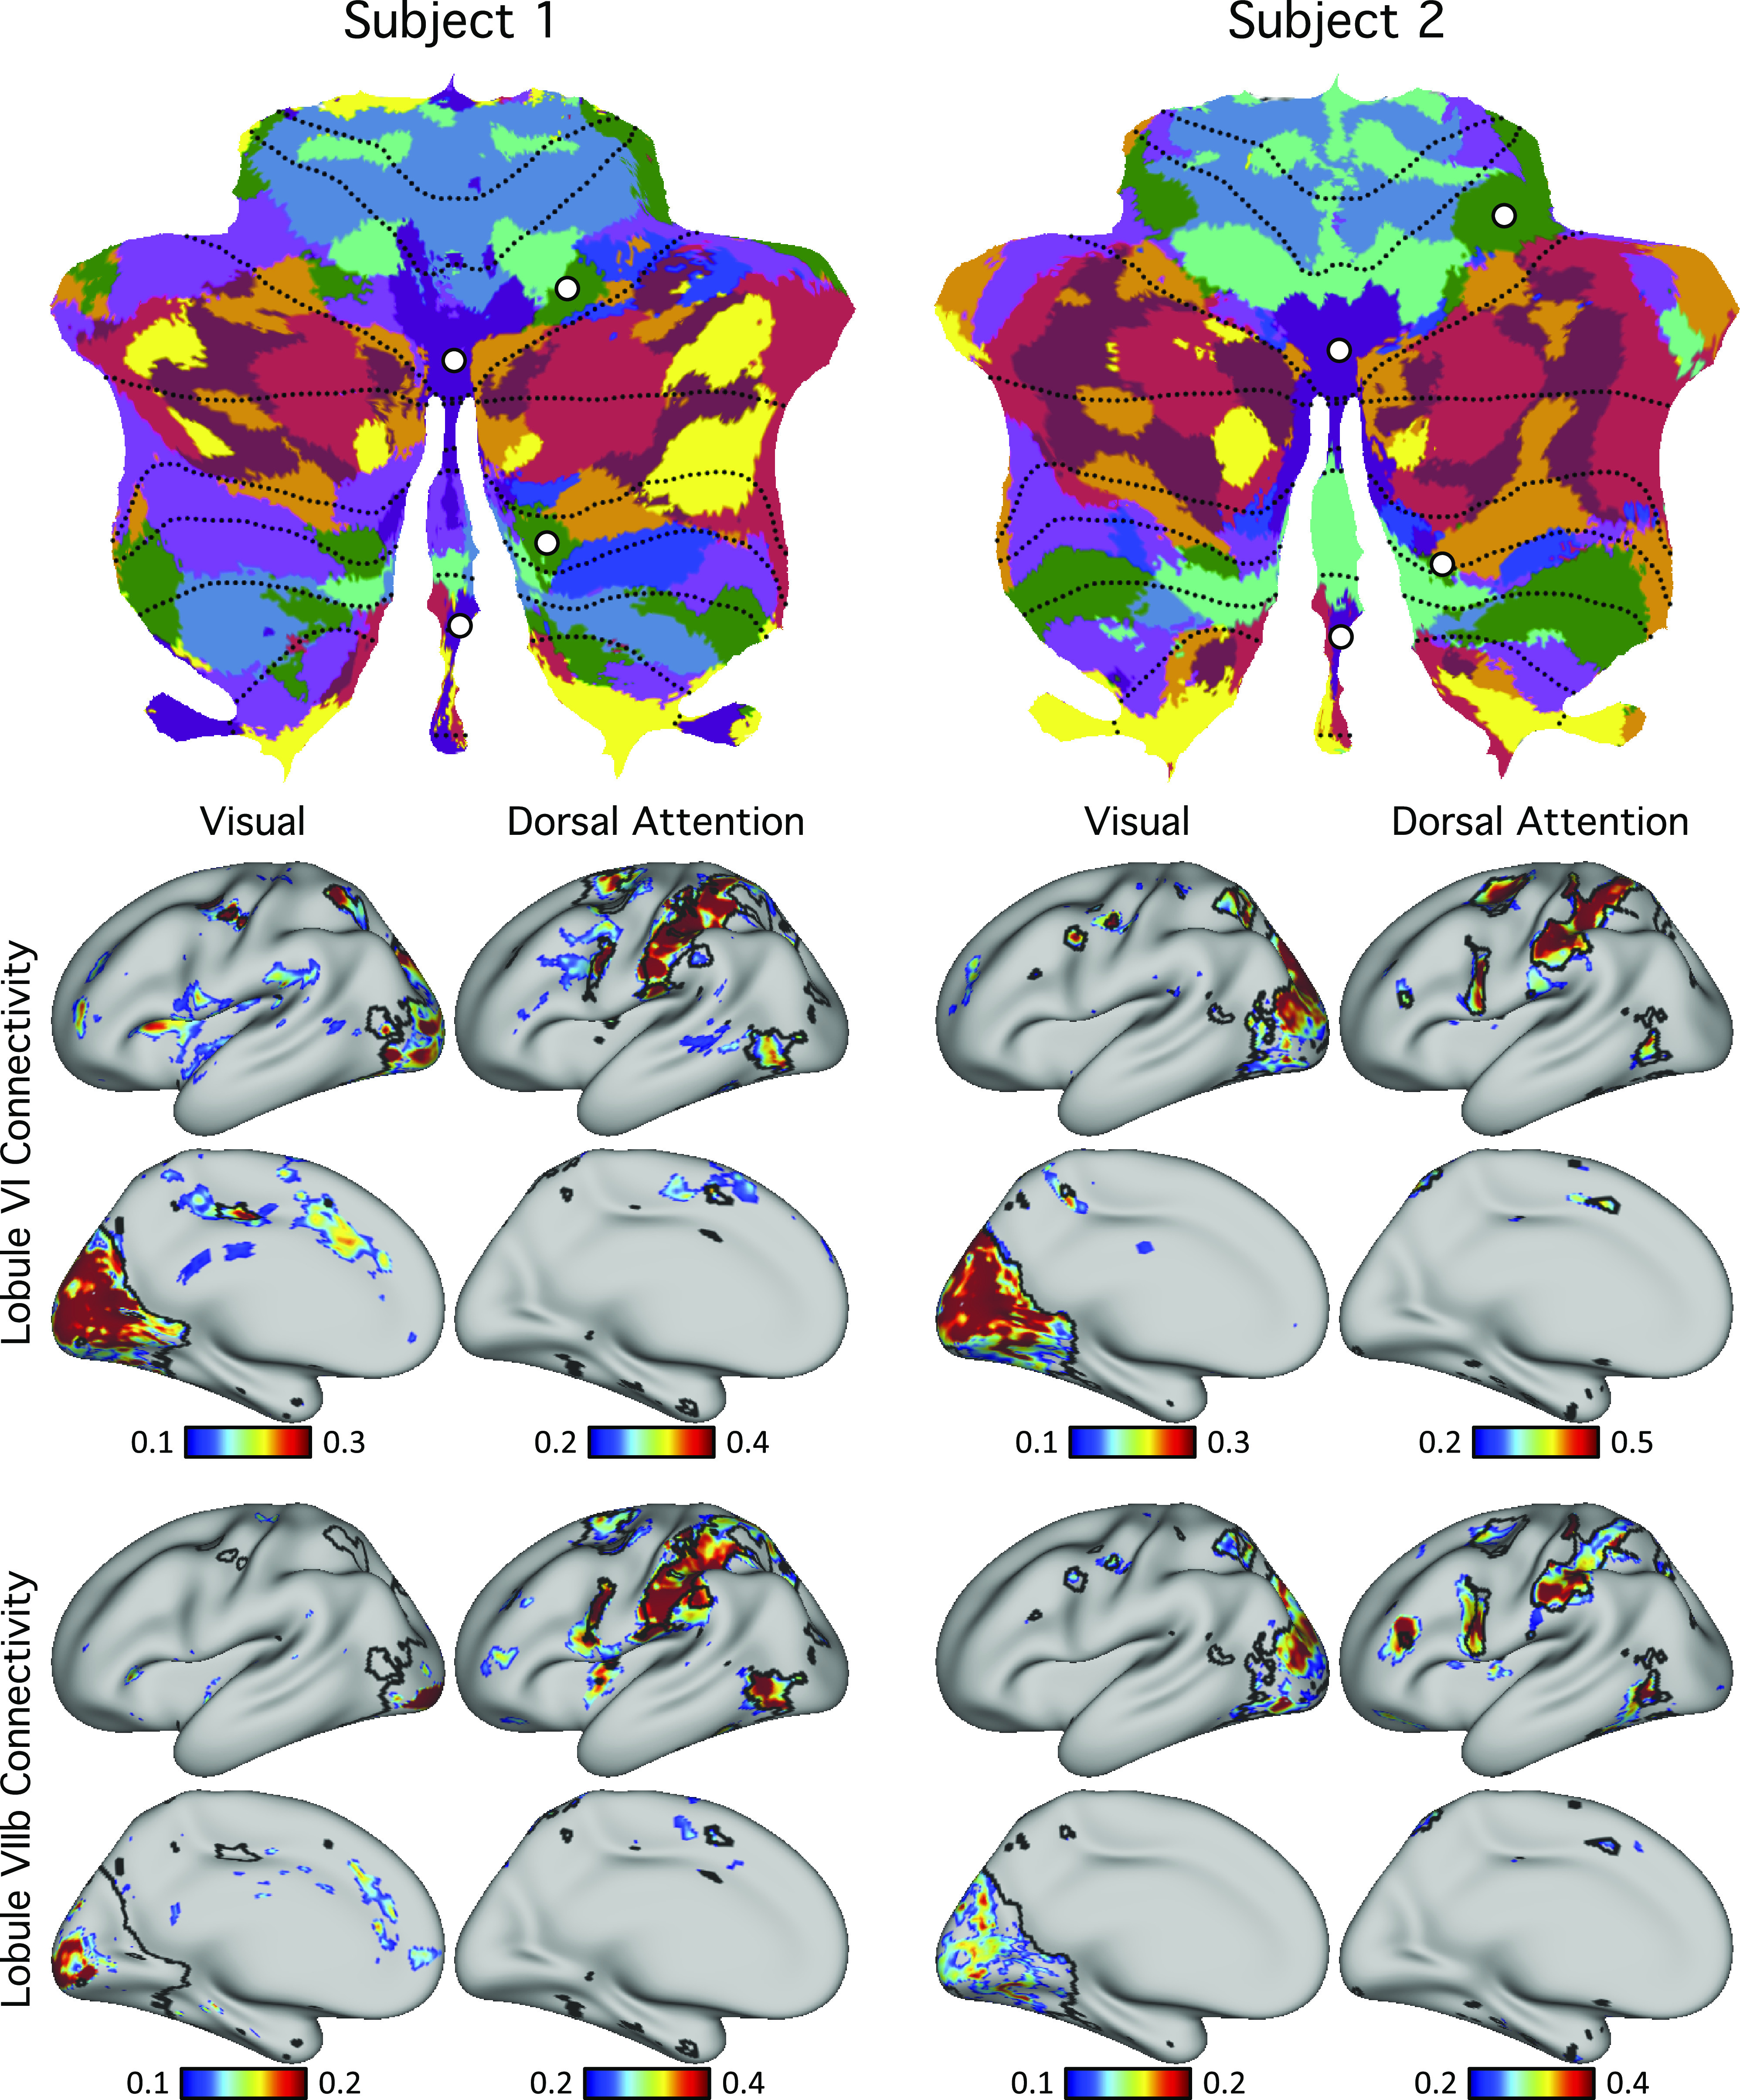
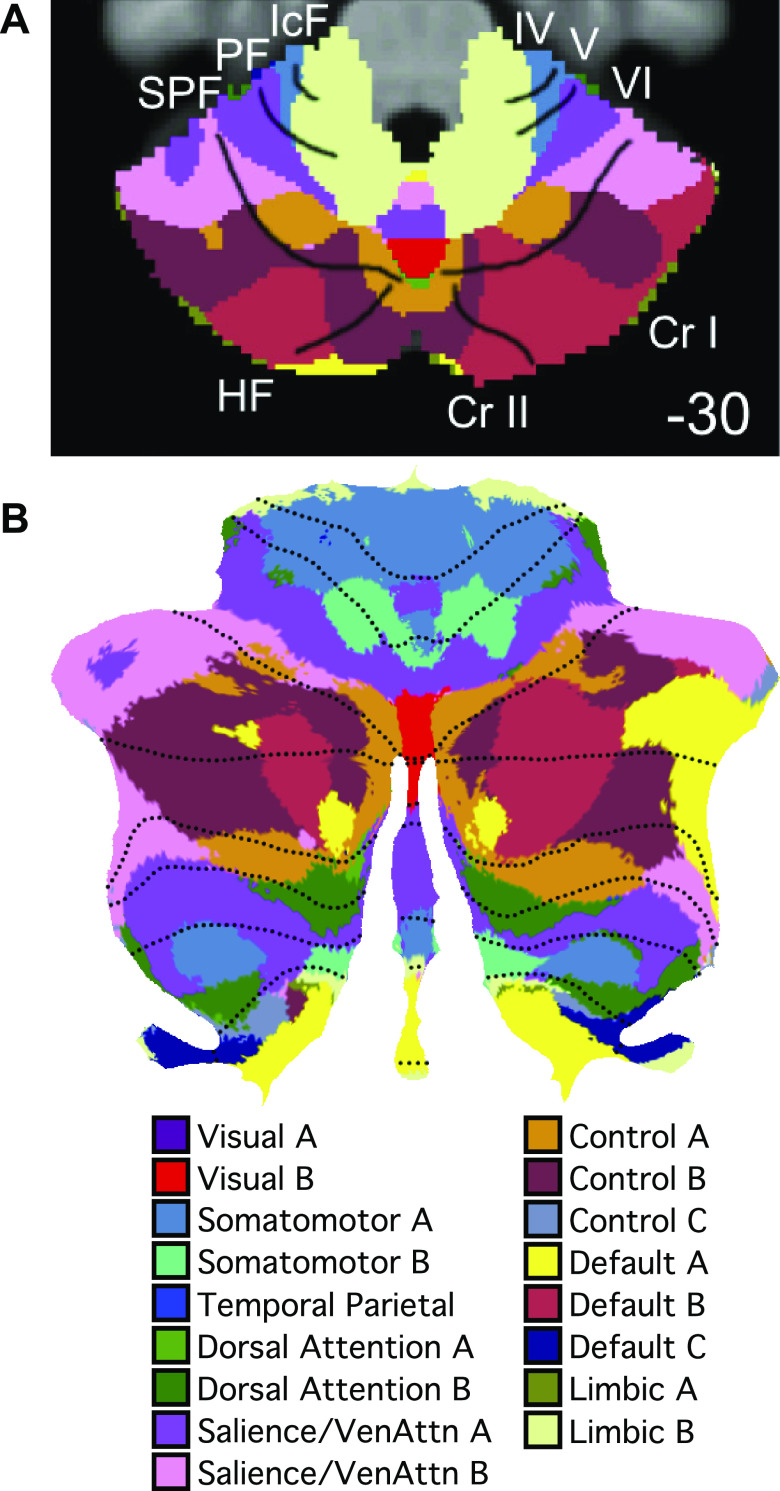
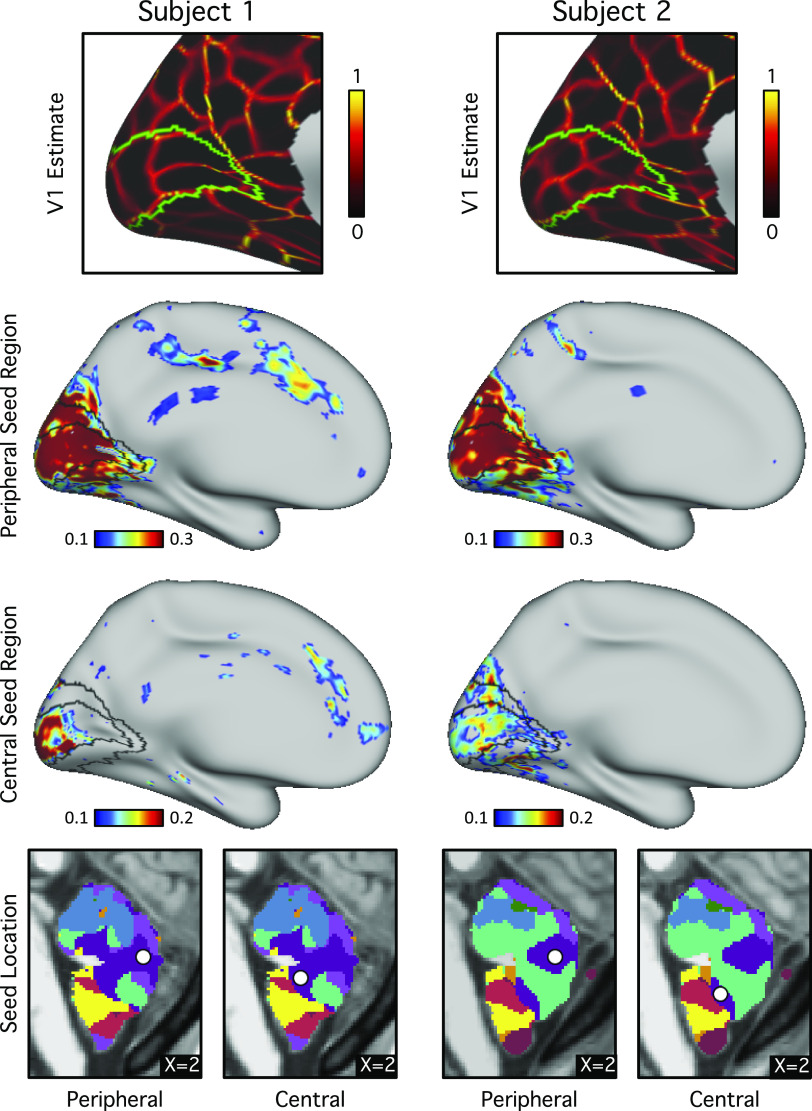
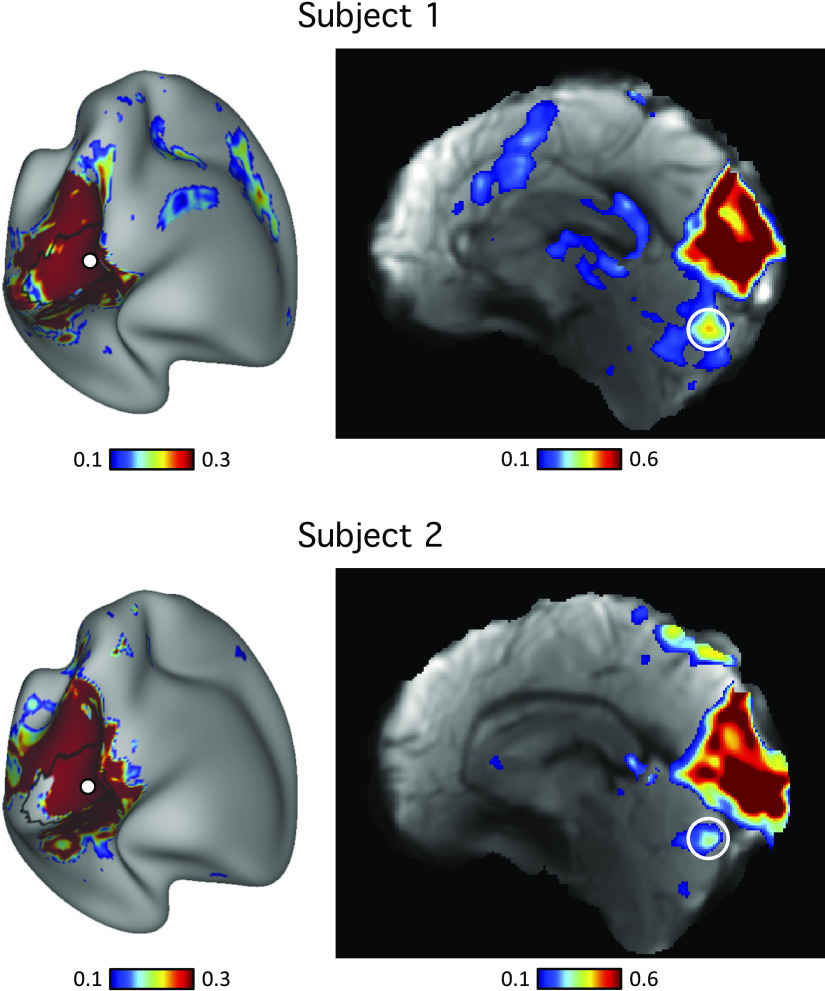
Distinct regions of the cerebellum connect to separate regions of the cerebral cortex forming a complex topography. Although cerebellar organization has been examined in group-averaged data, study of individuals provides an opportunity to discover features that emerge at a higher spatial resolution. Here, functional connectivity MRI was used to examine the cerebellum of two intensively sampled individuals (each scanned 31 times). Connectivity to somatomotor cortex showed the expected crossed laterality and topography of the body maps. A surprising discovery was connectivity to the primary visual cortex along the vermis with evidence for representation of the central field. Within the hemispheres, each individual displayed a hierarchical progression from the inverted anterior lobe somatomotor map through to higher-order association zones. The hierarchy ended at Crus I/II and then progressed in reverse order through to the upright somatomotor map in the posterior lobe. Evidence for a third set of networks was found in the most posterior extent of the cerebellum. Detailed analysis of the higher-order association networks revealed robust representations of two distinct networks linked to the default network, multiple networks linked to cognitive control, as well as a separate representation of a language network. Although idiosyncratic spatial details emerged between subjects, each network could be detected in both individuals, and seed regions placed within the cerebellum recapitulated the full extent of the spatially specific cerebral networks. The observation of multiple networks in juxtaposed regions at the Crus I/II apex confirms the importance of this zone to higher-order cognitive function and reveals new organizational details.NEW & NOTEWORTHY Stable, within-individual maps of cerebellar organization reveal orderly macroscale representations of the cerebral cortex with local juxtaposed zones representing distinct networks. In addition, individuals reveal idiosyncratic organizational features.

Keywords: Bayesian; association cortex; default network.


Conflict of interest statement

No conflicts of interest, financial or otherwise, are declared by the authors.

Figures

None
Graphical abstract
Figure 1.
Figure 1.
Extracted cerebellar boundaries for subjects 1 and 2 in MNI152 atlas space. The top row of each panel displays the T2* blood oxygenation level-dependent (BOLD) images. The bottom row of each panel shows the T1-weighted images. The green line shows the boundary of the cerebellum mask manually delineated based on each individual subject’s T1-weighted image. There is good agreement between the green line and the cerebellum in the T2* images, suggesting good T1–T2* alignment. Imperfections in the BOLD data are also visible, e.g., signal dropout near the green cerebellar boundary.
Figure 2.
Figure 2.
Functional connectivity of the cerebral cortical motor hand regions reveals contralateral somatomotor representations in the cerebellum of individual subjects. Coronal sections (top: y = −20; bottom: y = −55) display differences between functional connectivity of seed motor regions for each individual subject. Seed locations at or near the left- and right-hand motor representations are indicated by white circles. Warm colors show the connectivity of the right seed region subtracted from the connectivity of the left seed region. Cool colors represent the reverse subtraction. Color bars indicate correlation strength [z(r)]. The left hemisphere is displayed on the left (L). These results suggest that functional connectivity possesses sensitivity to detect known somatomotor representations within the individual.
Figure 3.
Figure 3.
Foot-hand-tongue representation in the cerebellum revealed by functional connectivity for individual subjects. Three different bilateral cortical regions were selected on the cerebral surface based on the discovery set (Table 1). Functional connectivity of these regions was computed using the replication set. Thresholds were set at z ≥ 0.1 for foot, z ≥ 0.2 for hand, and z ≥ 0.1 for tongue. Green, red, and blue colors represent foot, hand, and tongue, respectively. Coordinates at the bottom right indicate the section level in MNI152 space. In both individuals, the order of the somatomotor representation in the anterior lobe is foot-hand-tongue, whereas the order in the posterior lobe is inverted. Note the consistent spatial gap between the foot and hand representations that may reflect the intervening body representation. These results suggest that functional connectivity possesses specificity to detect the known spatial topography of somatomotor representations within the individual.
Figure 4.
Figure 4.
Cerebral cortical network parcellations were highly reliable across discovery and replication sets within individuals. 10-network individual-specific cerebral network parcellations were estimated by applying a multisession hierarchical Bayesian model (43) to the discovery (16 sessions) and replication (15 sessions) datasets independently. The individual-specific cortical parcellations were replicable within subjects. In subject 1, 91.4% cortical vertices were assigned to the same networks across discovery and replication datasets. In subject 2, 90.2% cortical vertices were assigned to the same networks across discovery and replication datasets. Networks are colored as labeled in the bottom legend using network names common in the literature for convenience. The names should not be taken to mean that networks code solely for functions associated with their assigned names, which are often derived from an evolving literature.
Figure 5.
Figure 5.
Cerebellar network parcellations were highly reliable across discovery and replication sets within individuals. Individual-specific cerebellar parcellations were estimated using discovery (16 sessions) and replication (15 sessions) datasets independently. Each cerebellar voxel was assigned to the most frequent cortical network among 400 cortical vertices with the strongest correlation (functional connectivity) with the voxel. Individual-specific cerebral parcellations were replicable within subjects. In subject 1, 83.8% voxels were assigned to the same networks across discovery and replication datasets. In subject 2, 84.2% voxels were assigned to the same networks across discovery and replication datasets. Networks are colored as labeled in the bottom legend.
Figure 6.
Figure 6.
The best estimate of 10-network cerebral cortical parcellation of subject 1. Multiple views for each hemisphere are provided to show the details of the parcellation. This parcellation represents the best estimate of cortical network organization using the present approach applied to all available data (62 runs from 31 independent sessions). Colors use the network labels as shown in Fig. 4. Note the presence of juxtaposed interdigitated networks in high-order association cortex that include default network A (yellow) and default network B (red), a candidate language network (blue), and cognitive control networks (orange and brown).
Figure 7.
Figure 7.
The best estimate of 10-network cerebral cortical parcellation of subject 2. Multiple views for each hemisphere are provided to show the details of the parcellation. This parcellation represents the best estimate of cortical network organization using the present approach applied to all available data (61 runs from 31 independent sessions). Colors use the network labels as shown in Fig. 4. Note the presence of juxtaposed interdigitated networks in high-order association cortex that include default network A (yellow) and default network B (red), a candidate language network (blue), and cognitive control networks (orange and brown).
Figure 8.
Figure 8.
The best estimate of 10-network cerebellar parcellation of subject 1. Each cerebellar voxel was assigned to the most frequent cortical network among the 400 cortical vertices with the strongest correlation (functional connectivity) with the voxel. The 10 cerebral networks of subject 1 are shown at the bottom for reference. Colors use the network labels as shown in Fig. 5. The three sections display sagittal (left), coronal (middle), and axial (right) views. L, left; R, right; A, anterior; P, posterior; S, superior; and I, inferior. The left hemisphere is displayed on the left. Coordinates at the bottom right of each panel indicate the section level in MNI152 space. Each network identified in the cerebral cortex has multiple representations in the cerebellum. The organization is broadly symmetric between the cerebellar hemispheres, with asymmetries paralleling the cerebral network asymmetries. For example, the language network (blue) shows a markedly expanded representation in the right hemisphere consistent with the leftward asymmetry in the cerebral cortex.
Figure 9.
Figure 9.
The best estimate of 10-network cerebellar parcellation of subject 2. Each cerebellar voxel was assigned to the most frequent cortical network among the 400 cortical vertices with the strongest correlation (functional connectivity) with the voxel. The 10 cerebral networks of subject 2 are shown at the bottom for reference. Colors use the network labels as shown in Fig. 5. The three sections display sagittal (left), coronal (middle), and axial (right) views. L, left; R, right; A, anterior; P, posterior; S, superior; and I, inferior. The left hemisphere is displayed on the left. Coordinates at the bottom right of each panel indicate the section level in MNI152 space. Each network identified in the cerebral cortex has multiple representations in the cerebellum.
Figure 10.
Figure 10.
Cerebellar network parcellations within individuals are shown on flatmaps. The individual-specific parcellations were generated using all sessions for each subject projected using the SUIT toolbox (16). Dotted lines indicate lobular boundaries. L indicates left cerebellar hemisphere. Different lobules are marked on the right side. Networks are colored as labeled at bottom. Despite the complex topography, the cerebellum contained three representations of the cerebral cortex labeled as the putative primary, secondary, and tertiary maps. The primary map begins with the anterior lobe somatomotor representation, passes through dorsal attention and salience/ventral attention networks, and ends in the apex association networks centered at the Crus I/II border, including clear representation of default networks A and B. The secondary map then progresses in reverse through to a second somatomotor representation in the posterior lobe (within HVIIIb). Evidence for the tertiary map is the final representation of networks between HVIIIb and HIX that possesses representation of default networks A and B in HIX.
Figure 11.
Figure 11.
Cerebellar network parcellations within individuals shown in the volume to reveal multiple repeating maps. The topographic ordering of the cerebral networks from Fig. 10 is illustrated for three sagittal sections of the right cerebellum. Three distinct representations are observed for both subjects, labeled as primary, secondary, and tertiary. Each map is a roughly duplicated ordering of the adjacent map (with some variation).
Figure 12.
Figure 12.
Evidence for specificity of default networks A and B. Top: seed regions from default networks A (DN-A) and B (DN-B) were selected within the discovery set (plotted as white circles). Note two pairs of seed regions were selected, centered on adjacent default network A and B representations separately for the Crus I/II representation and the spatially distant HIX representation. This allowed the network topography of each separated cerebellar map to be examined in the cerebral cortex. Bottom: functional connectivity maps from the cerebellar seed regions were estimated for the cerebral cortex using the replication set. Black lines indicate boundaries of individual-specific default network A or B from the original cerebral parcellation (Fig. 4, replication set). Each pair of juxtaposed cerebellar seed regions yielded the full, distributed cerebral networks associated with the separate default network A or B; seed regions from the same networks in Crus I/II and lobule IX exhibited highly similar functional connectivity patterns. These results illustrate remarkable specificity of the cerebellar parcellations.
Figure 13.
Figure 13.
Evidence for specificity of the language network. Top: cerebellar seed regions from the language network were selected using the discovery set. Three separate seed regions were selected within each individual that included representations in the spatially distant HVI and HVIIIa regions. Bottom: functional connectivity maps of these seed regions were estimated using the replication set. Black lines indicate boundaries of the individual-specific language network and highlight agreement between the network estimates from each of the three cerebellar representations.
Figure 14.
Figure 14.
Differences in cerebellar topography between individuals were supported by seed-based functional connectivity. Top: pairs of seed regions were selected in the discovery dataset to highlight topographic differences between the two individuals. To make this point most clear, seed regions were selected for the same MNI coordinates in both subjects, with the corresponding networks they aligned to differing between subjects. The first cerebellar seed region was within the language network in subject 1 and within the default network B in subject 2. The second cerebellar seed region was within default network A in subject 1 and within control network B in subject 2. Bottom: functional connectivity maps of these seed regions were estimated using the replication sets. Black lines indicate boundaries of corresponding individual-specific networks and highlight strong agreement with functional connectivity maps. These results demonstrate how zones of the cerebellum that are located in similar volumetric positions between individuals can correspond to starkly different functional networks.
Figure 15.
Figure 15.
A failed test of an ectopic cerebellar functional zone. Top: a cerebellar seed region was selected using the discovery set in a region that showed an ectopic network assignment. The region was assigned to a somatomotor network in a zone of the lateral hemisphere near Crus I that is otherwise surrounded by higher-order association networks. Bottom: the functional connectivity map of the seed region estimated using the replication set reveals a distributed, noisy pattern. This pattern is not easily interpreted and may either represent an alternative biological arrangement or experimental noise that we presently do not understand. Failures of this type were rare.
Figure 16.
Figure 16.
Evidence for specificity of a visual network representation in the cerebellum. Top: cerebellar seed regions were selected using the discovery set within a region of the vermis assigned to the visual network (purple) and a spatially separate region assigned to the dorsal attention network. Bottom: functional connectivity maps of these seed regions were estimated using the replication set. Black lines indicate boundaries of individual-specific visual and dorsal attention networks and highlight agreement with functional connectivity maps. The functional connectivity maps support the existence of early visual representation within the vermis of the cerebellum. Of note, the cerebral cortical regions coupled to the cerebellar vermis included early retinotopic visual cortex at or near V1.
Figure 17.
Figure 17.
Evidence for visual network representation in group-averaged data. Group-level 17-network cerebellar parcellation from Ref. also revealed visual representation (visual B in red) in the vermis. A: an axial section shows visual network B in the vermis. B: the same data projected to a flatmap. The visual region appeared in roughly the same location in both the group-level and individual-specific cerebellar parcellations (see Fig. 16). Cr I, Crus I; Cr II, Crus II; HF, horizontal fissure; IcF, intraculminate fissure; IV, lobule IV; PF, primary fissure; SPF, superior posterior fissure; V, lobule V; VI, lobule VI.
Figure 18.
Figure 18.
Evidence for central and peripheral visual representations coupled to primary visual cortex within the cerebellum. Top row: V1 is estimated in each individual based on projected histology (green line) and within-individual functional connectivity gradients (red-yellow lines). Histological estimates are derived from the Juelich atlas in FreeSurfer (61, 62). The functional connectivity gradient maps (32, 64) show sharp transitions in functional connectivity patterns across the cerebral cortex and align with the histological V1 boundaries. Middle rows: cerebral functional connectivity maps are displayed from seed regions placed in the visual zone of the cerebellar vermis. Histological V1 and V2 boundaries from the Juelich atlas in FreeSurfer are overlaid in black. Note that functional connectivity patterns strongly overlap with the estimate of primary visual cortex (V1). Separate regions are associated more with the peripheral and central visual zones, particularly evident for subject 1. Bottom row: the locations of the cerebellar seed regions are displayed in sagittal sections.
Figure 19.
Figure 19.
Primary visual cortex connectivity reveals selective representation in the cerebellum within individuals. Seed regions were selected in the visual cerebral cortex in the discovery set. The seeds regions are shown as white circles in the left panels. Functional connectivity maps of the seed regions were computed in the volume using the replication dataset and shown in the right panels. Cerebellar islands (white circles) show high connectivity with cortical visual regions that are separate from the correlation within and around the seed region in the cerebral cortex (the large region above), suggesting that the visual representation within the vermis is unlikely to be the result of signal leakage from the occipital lobe.
Figure 20.
Figure 20.
Relationship between the extent of cerebral and contralateral cerebellar cortices assigned to distinct functional networks. Each colored circle represents a different network as labeled at bottom. The x-axis shows the percentage of cortical vertices assigned to each network. The y-axis shows the percentage of cerebellar voxels assigned to each network in the contralateral hemisphere. The black lines indicate best-fit regression lines.

Similar articles

Cited by

References

    1. Sereno MI, Diedrichsen J, Tachrount M, Testa-Silva G, d’Arceuil H, De Zeeuw C. The human cerebellum has almost 80% of the surface area of the neocortex. Proc Natl Acad Sci USA 117: 19538–19543, 2020. doi:10.1073/pnas.2002896117. - DOI - PMC - PubMed
    1. Schmahmann JD, Pandya DN. The cerebrocerebellar system. Int Rev Neurobiol 41: 31–60, 1997. doi:10.1016/S0074-7742(08)60346-3. - DOI - PubMed
    1. Strick PL, Dum RP, Fiez JA. Cerebellum and nonmotor function. Annu Rev Neurosci 32: 413–434, 2009. doi:10.1146/annurev.neuro.31.060407.125606. - DOI - PubMed
    1. Leiner HC, Leiner AL, Dow RS. Does the cerebellum contribute to mental skills? Behav Neurosci 100: 443–454, 1986. doi:10.1037/0735-7044.100.4.443. - DOI - PubMed
    1. Leiner HC, Leiner AL, Dow RS. Reappraising the cerebellum: what does the hindbrain contribute to the forebrain? Behav Neurosci 103: 998–1008, 1989. doi:10.1037/0735-7044.103.5.998. - DOI - PubMed

Publication types

LinkOut - more resources