. 2020 Dec;8(2):e000725.
doi: 10.1136/jitc-2020-000725.

Obesity diminishes response to PD-1-based immunotherapies in renal cancer

Affiliations

Obesity diminishes response to PD-1-based immunotherapies in renal cancer

Shannon K Boi et al. J Immunother Cancer. 2020 Dec.

Abstract

Background: Obesity is a major risk factor for renal cancer, yet our understanding of its effects on antitumor immunity and immunotherapy outcomes remains incomplete. Deciphering these associations is critical, given the growing clinical use of immune checkpoint inhibitors for metastatic disease and mounting evidence for an obesity paradox in the context of cancer immunotherapies, wherein obese patients with cancer have improved outcomes.

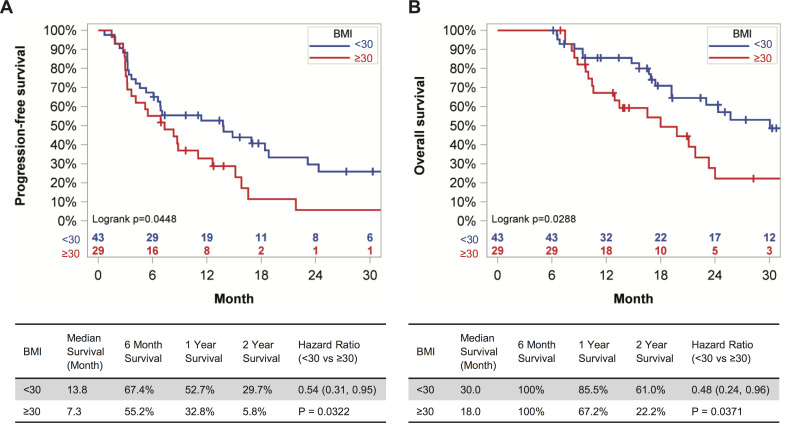
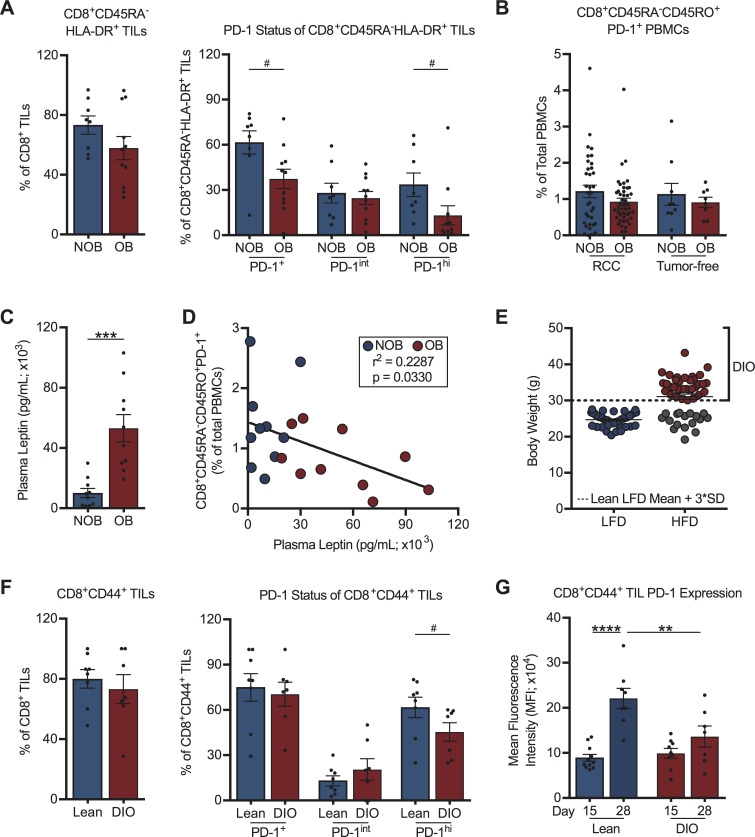
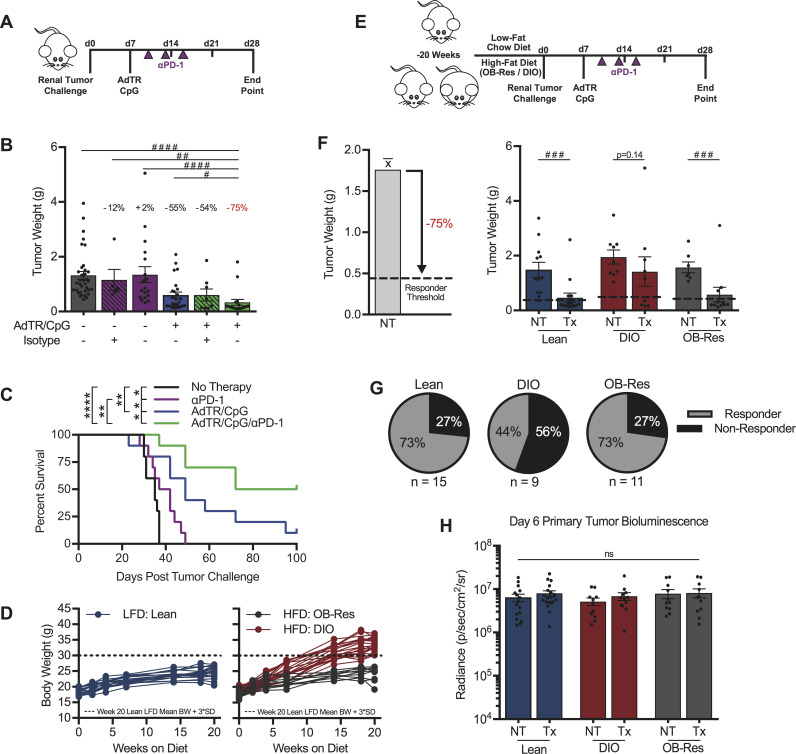
Methods: We investigated associations between host obesity and anti-programmed cell death (PD-1)-based outcomes in both renal cell carcinoma (RCC) subjects and orthotopic murine renal tumors. Overall survival (OS) and progression-free survival (PFS) were determined for advanced RCC subjects receiving standard of care anti-PD-1 who had ≥6 months of follow-up from treatment initiation (n=73). Renal tumor tissues were collected from treatment-naive subjects categorized as obese (body mass index, 'BMI' ≥30 kg/m2) or non-obese (BMI <30 kg/m2) undergoing partial or full nephrectomy (n=19) then used to evaluate the frequency and phenotype of intratumoral CD8+ T cells, including PD-1 status, by flow cytometry. In mice, antitumor immunity and excised renal tumor weights were evaluated ±administration of a combinatorial anti-PD-1 therapy. For a subset of murine renal tumors, immunophenotyping was performed by flow cytometry and immunogenetic profiles were evaluated via nanoString.

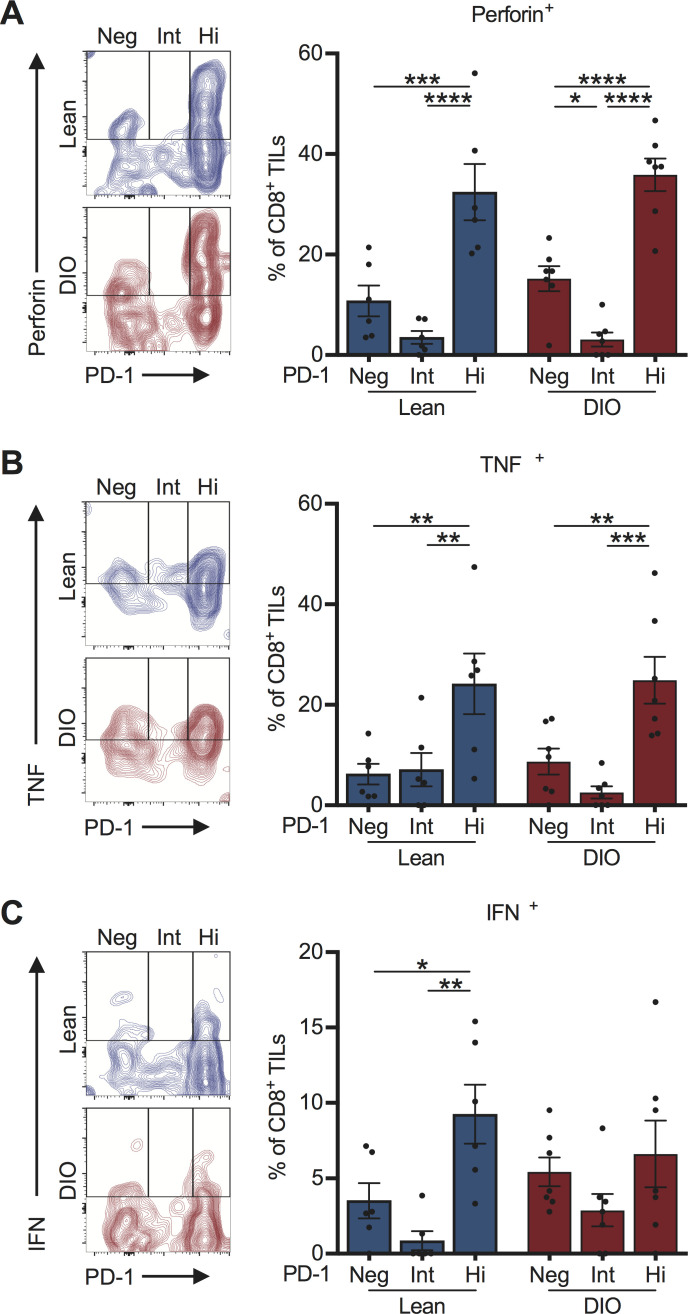
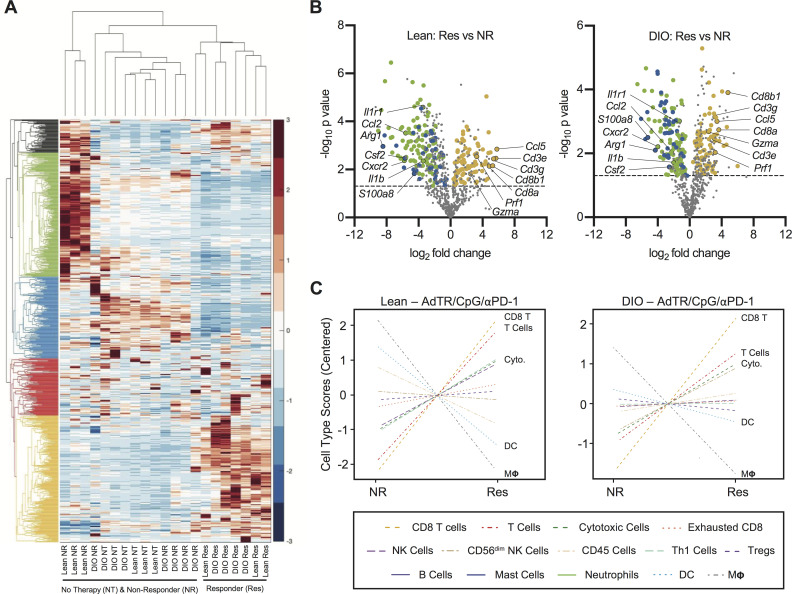
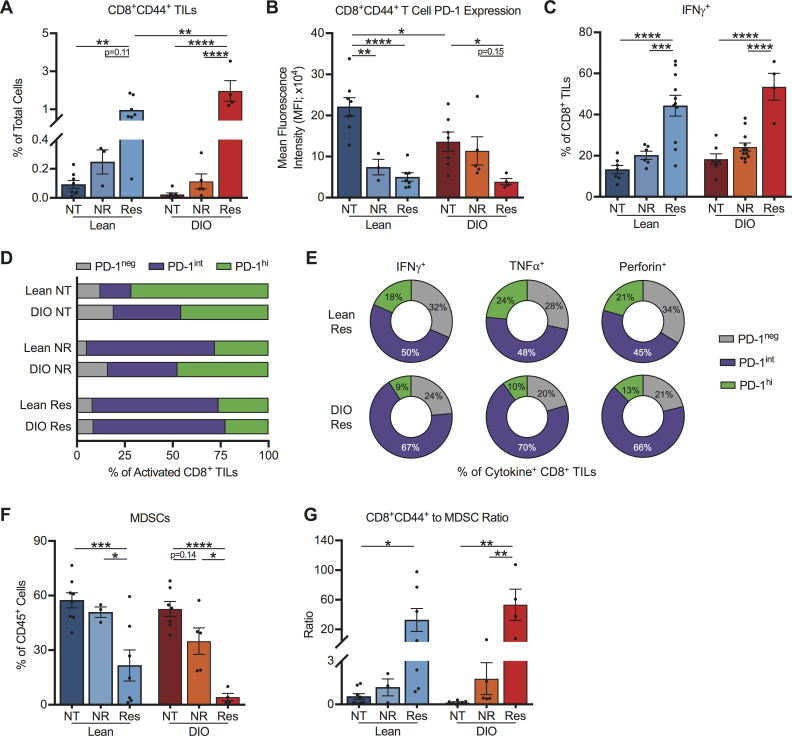
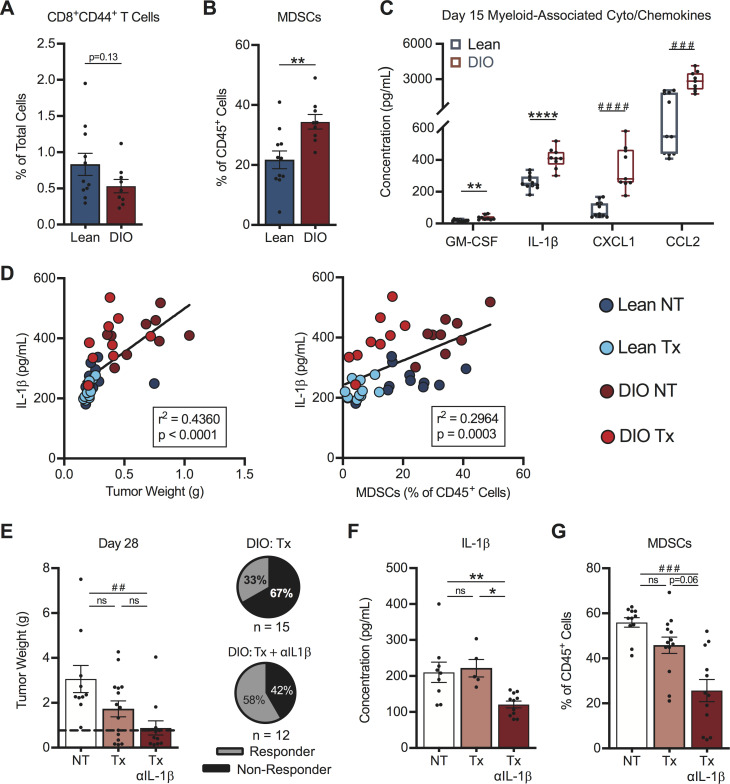
Results: With obesity, RCC patients receiving anti-PD-1 administration exhibited shorter PFS (p=0.0448) and OS (p=0.0288). Treatment-naive renal cancer subjects had decreased frequencies of tumor-infiltrating PD-1highCD8+ T cells, a finding recapitulated in our murine model. Following anti-PD-1-based immunotherapy, both lean and obese mice possessed distinct populations of treatment responders versus non-responders; however, obesity reduced the frequency of treatment responders (73% lean vs 44% obese). Tumors from lean and obese treatment responders displayed similar immunogenetic profiles, robust infiltration by PD-1int interferon (IFN)γ+CD8+ T cells and reduced myeloid-derived suppressor cells (MDSC), yielding favorable CD44+CD8+ T cell to MDSC ratios. Neutralizing interleukin (IL)-1β in obese mice improved treatment response rates to 58% and reduced MDSC accumulation in tumors.

Conclusions: We find that obesity is associated with diminished efficacy of anti-PD-1-based therapies in renal cancer, due in part to increased inflammatory IL-1β levels, highlighting the need for continued study of this critical issue.

Keywords: CD8-positive T-lymphocytes; immunotherapy; kidney neoplasms; lymphocytes; programmed cell death 1 receptor; tumor-infiltrating.


Conflict of interest statement

Competing interests: CBR is currently employed by Immunomic Therapeutics. RCA serves as an advisory board member for Clovis, Tesaro and LEAP therapeutics. EY receives research funding from Eli Lilly and serves as an advisory board member for Bayer and AstraZeneca.

Figures

Figure 1
Figure 1
Host obesity is associated with reduced PFS and OS in metastatic RCC patients receiving anti-PD-1 as standard of care. (A) PFS and (B) OS of metastatic RCC patients with at least 6 months of follow-up after initiation of anti-PD-1 therapy as standard of care, categorized by BMI status. Survival curves for PFS and OS across BMI categories were generated with the Kaplan-Meier method. HRs were calculated from a Cox model controlling for patients’ age, sex, IMDC risk score and number of prior therapies. BMI, body mass index; IMDC, International Metastatic RCC Database Consortium; OS, overall survival; PD-1, programmed cell death-1; PFS, progression-free survival; RCC, renal cell carcinoma.
Figure 2
Figure 2
Host obesity is associated with decreased frequencies of activated PD-1hiCD8+ TILs in treatment-naive human and murine renal tumors. (A) Intratumoral and (B) peripheral blood CD8+ T cells from NOB and OB treatment-naive RCC subjects and tumor-free donors. Frequencies of (A) activated CD8+ TILs, activated PD-1-expressing CD8+ TILs, and (B) peripheral blood activated PD-1+CD8+ T cells from RCC subjects and tumor-free donors. (C) Plasma leptin levels from NOB and OB RCC subjects. (D) Linear regression of activated PD-1+CD8+ PBMCs and plasma leptin levels in NOB and OB RCC subjects. (E) Resulting body weights for lean low-fat diet (LFD) and diet-induced obese (DIO) high-fat diet (HFD)-fed mice. Dotted line indicates three SD above the mean weight of LFD fed animals and the threshold for classification as DIO. (F) CD8+ TILs from lean and DIO treatment-naive mice on day 28 post-tumor challenge. Frequencies of activated CD8+ TILs and activated PD-1-expressing CD8+ TILs are shown. (G) PD-1 expression on activated CD8+ TILs at days 15 and 28 post-tumor challenge. Murine data are pooled from at least two independent experiments. Data are presented as means ±SEM. Statistical differences were calculated using parametric t-tests (***p<0.001), non-parametric Mann-Whitney U tests (#p<0.05), linear regression, or two-way ANOVA followed by post hoc Bonferroni’s multiple comparisons tests (**p<0.01, ****p<0.0001). ANOVA, analysis of variance; BMI, body mass index; NOB, non-obese; OB, obese; PBMCs, peripheral blood mononuclear cells; PD-1, programmed cell death-1; RCC, renal cell carcinoma; TIL, tumor-infiltrating lymphocyte.
Figure 3
Figure 3
Tumor-infiltrating PD-1highCD8+ T cells retain potent effector function in both lean and DIO treatment-naive mice. On day 28, post-tumor challenge CD8+ TILs from lean and DIO treatment-naive mice were evaluated ex vivo for their expression of PD-1 and production of effector cytokines (A) perforin, (B) TNF⍺ and (C) IFNγ. Representative flow plots for each cytokine are shown. Graphs show data pooled from at least two independent experiments and presented as means ±SEM for indicated cell subpopulations based on PD-1 status. Statistical differences were calculated using two-way ANOVA with Bonferroni’s multiple comparisons tests (*p<0.05, **p<0.01, ***p<0.001, ****p<0.0001). ANOVA, analysis of variance; DIO, diet-induced obese; Hi, PD-1 high; IFNγ, interferon-γ; Int, PD-1 intermediate; Neg, PD-1 negative; PD-1, programmed cell death-1; TIL, tumor-infiltrating lymphocyte; TNF⍺, tumor necrosis factor ⍺.
Figure 4
Figure 4
Obesity reduces the efficacy of a novel AdTR/CpG/PD-1 combinatorial immunotherapy in pre-clinical renal cancer. (A) Experimental design for panels (B, C). (B) Day 28 renal tumor weights for lean animals, treated as indicated. Percentage indicates change in tumor burden relative to untreated controls. (C) Percent survival. (D) Change in body weights of LFD and HFD-fed animals. (E) Experimental design for panels (F, G). (F) Responder threshold (dashed line) was calculated as a >75% reduction in therapy-treated tumor burden compared with untreated controls as determined in (B). Day 28 renal tumor weights for lean, DIO and obese resistant (OB-Res) animals. (G) Response rates for lean, DIO and OB-Res therapy-treated animals from (F). (H) Day 6 tumor burden prior to therapy administration as determined by bioluminescence. Data are pooled from (C) a single experiment (n=10/group) or (B, D, F–H) two or more independent experiments and presented as means±SEM, survival or individual animals shown. Statistical differences were calculated using (B) non-parametric Kruskal-Wallis test with uncorrected Dunn’s multiple comparisons test (#p<0.05, ##p<0.01, #### p<0.0001), (C) log-rank (Mantel-Cox) test (*p<0.05, **p<0.01, ***p<0.001, ****p<0.0001), (F) non-parametric Mann-Whitney U tests (###p<0.001) or (H) two-way ANOVA with Bonferroni’s multiple comparisons tests as appropriate. ANOVA, analysis of variance; DIO, diet-induced obese; HFD, high-fat diet; LFD, low-fat chow diet; ns, not significant; NT, no therapy; PD-1, programmed cell death-1; Tx, AdTR/CpG/PD-1 therapy.
Figure 5
Figure 5
Lean and DIO AdTR/CpG/PD-1 responders share a conserved tumoral gene expression profile that is distinct from those of non-responders and treatment-naive mice. (A) Heatmap depicting unbiased hierarchical clustering and gene expression patterns for 750 immune-related genes in the tumors of therapy-naive and therapy-treated lean and DIO animals. (B) Volcano plots showing expression of 750 genes in (left) lean and (right) DIO responders versus respective non-responders. Dashed line indicates an exploratory unadjusted p value threshold (p=0.05) to screen differentially expressed (DE) target genes. Dot colors correspond to genes from green, blue and yellow hierarchical clusters in (A) that were also significantly (p<0.05) DE in both lean and DIO responders versus non-responders. (C) NanoString-generated cell type scores comparing relative gene expression-based population abundance in responding and non-responding lean and DIO therapy-treated animals. DC, dendritic cell; DE, differentially expressed; DIO, diet-induced obese; no therapy, NT; non-responder, NR; PD-1, programmed cell death-1; Res, responder.
Figure 6
Figure 6
Successful response to immunotherapy in both lean and DIO mice is associated with a predominance of effector PD-1intCD8+ TILs and reduced MDSCs. Analysis of day 28 intratumoral leukocytes from indicated treatment groups. (A) Frequencies of activated CD8+ TILs, (B) PD-1 expression on activated CD8+ TILs, (C) frequencies of IFNγ+ CD8+ TILs, (D) activated CD8+ TILs based on PD-1 expression level, (E) cytokine producing CD8+ TILs based on PD-1 expression level and (F) MDSCs. (G) Ratio of activated CD8+ TILs to MDSCs. Data are pooled from at least two independent experiments and presented as means±SEM. Statistical differences were determined by two-way ANOVA followed by post hoc Bonferroni’s multiple comparisons tests (*p<0.05, **p<0.01, ***p<0.001, ****p<0.0001). ANOVA, analysis of variance; DIO, diet-induced obese; IFNγ, interferon-γ; MDSCs, myeloid-derived suppressor cells; NR, non-responder; NT, no therapy; PD-1, programmed cell death-1; Res, responder; TILs, tumor-infiltrating lymphocyte.
Figure 7
Figure 7
Early intratumoral chemokine alterations in obese mice drive differential therapy response rates. On day 15, post-tumor challenge lean and DIO treatment-naive mice were evaluated for (A) activated CD8+ TILs, (B) MDSCs and (C) myeloid-associated cyto/chemokines within tumors. Linear regression of intratumoral (D) IL-1β concentrations versus (left) tumor weight and (right) MDSCs in lean and DIO therapy-naive and therapy-treated animals. DIO animals were treated with no therapy or AdTR/CpG/PD-1±anti-IL-1β neutralizing antibody. Day 28 endpoint (E) tumor weights, corresponding response rates, intratumoral (F) IL-1β concentrations and (G) MDSCs. Data are pooled from at least two independent experiments and presented as means±SEM or boxes defining 25th to 75th percentiles with line at median and whiskers extending to minimum and maximum points. Statistical differences were calculated using parametric t-tests (*p<0.05, **p<0.01, ****p<0.0001), non-parametric Mann-Whitney U tests (##p<0.01, ###p<0.001, ####p<0.0001), or linear regression analyses as appropriate. DIO, diet-induced obese; IL-1β, interleukin-1β; MDSCs, myeloid-derived suppressor cells; ns, not significant; NT, no therapy; PD-1, programmed cell death-1; Tx, AdTR/CpG/PD-1 therapy.

References

    1. Ribas A, Wolchok JD. Cancer immunotherapy using checkpoint blockade. Science 2018;359:1350–5. 10.1126/science.aar4060 - DOI - PMC - PubMed
    1. Hales CM, Fryar CD, Carroll MD, et al. . Trends in obesity and severe obesity prevalence in US youth and adults by sex and age, 2007-2008 to 2015-2016. JAMA 2018;319:1723. 10.1001/jama.2018.3060 - DOI - PMC - PubMed
    1. Lauby-Secretan B, Scoccianti C, Loomis D, et al. . Body Fatness and Cancer--Viewpoint of the IARC Working Group. N Engl J Med 2016;375:794–8. 10.1056/NEJMsr1606602 - DOI - PMC - PubMed
    1. Sanfilippo KM, McTigue KM, Fidler CJ, et al. . Hypertension and obesity and the risk of kidney cancer in 2 large cohorts of US men and women. Hypertension 2014;63:934–41. 10.1161/HYPERTENSIONAHA.113.02953 - DOI - PMC - PubMed
    1. Paich HA, Sheridan PA, Handy J, et al. . Overweight and obese adult humans have a defective cellular immune response to pandemic H1N1 influenza A virus. Obesity 2013;21:2377–86. 10.1002/oby.20383 - DOI - PMC - PubMed

Publication types