

Ythdf is a N6-methyladenosine reader that modulates Fmr1 target mRNA selection and restricts axonal growth in Drosophila
- PMID: 33428246
- PMCID: PMC7883056
- DOI: 10.15252/embj.2020104975
Ythdf is a N6-methyladenosine reader that modulates Fmr1 target mRNA selection and restricts axonal growth in Drosophila
Abstract
N6-methyladenosine (m6 A) regulates a variety of physiological processes through modulation of RNA metabolism. This modification is particularly enriched in the nervous system of several species, and its dysregulation has been associated with neurodevelopmental defects and neural dysfunctions. In Drosophila, loss of m6 A alters fly behavior, albeit the underlying molecular mechanism and the role of m6 A during nervous system development have remained elusive. Here we find that impairment of the m6 A pathway leads to axonal overgrowth and misguidance at larval neuromuscular junctions as well as in the adult mushroom bodies. We identify Ythdf as the main m6 A reader in the nervous system, being required to limit axonal growth. Mechanistically, we show that the m6 A reader Ythdf directly interacts with Fmr1, the fly homolog of Fragile X mental retardation RNA binding protein (FMRP), to inhibit the translation of key transcripts involved in axonal growth regulation. Altogether, this study demonstrates that the m6 A pathway controls development of the nervous system and modulates Fmr1 target transcript selection.
Keywords: Fmr1; RNA modification; Ythdf; m6A; nervous system.
© 2021 The Authors. Published under the terms of the CC BY NC ND 4.0 license.
Conflict of interest statement
The authors declare that they have no conflict of interest.
Figures
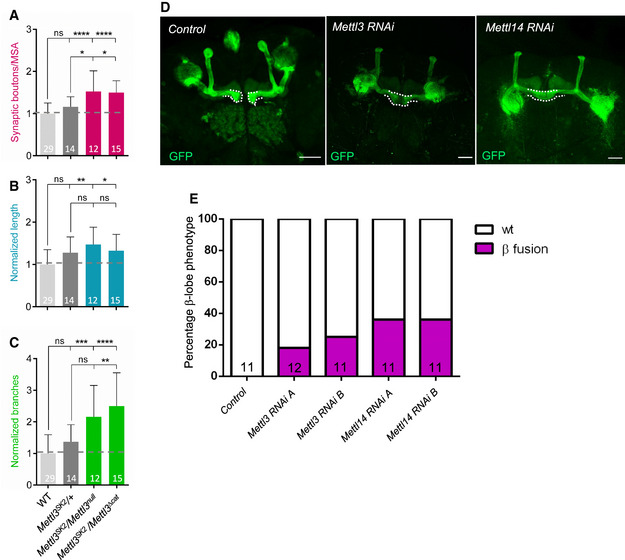
- A–C
Quantification of normalized bouton number (A, total number of boutons/muscle surface area (μm2 × 1,000)), normalized axon length (B), and normalized branching (C) of muscle‐6/7 NMJ in hemisegments A2‐A3 of the indicated genotypes. Bars show mean ± s.e.m. Multiple comparisons were performed using one‐way ANOVA with a post hoc Sidak–Bonferroni correction (n.s. = not significant; *P < 0.05; **P < 0.01; ***P < 0.001; ****P < 0.0001).
- D
Analysis of adult control c772Gal:UAS‐CD8,GFP, c772Gal:UAS‐CD8,GFP:Mettl3 RNAi (v20969) and c772Gal:UAS‐CD8,GFP:Mettl14 RNAi (v48560) MB in the brains by visualization of the membrane GFP autofluorescence. White dashed lines highlight the normal and fused β‐lobes. Scale bar 50 μm.
- E
Quantification of the penetrance of β‐lobe fusion phenotype in the following genotypes: control (c772Gal:UAS‐CD8,GFP/+), c772Gal:UAS‐CD8,GFP:Mettl3 RNAi (v20968) indicated as RNAi A, c772Gal:UAS‐CD8,GFP:Mettl3 RNAi (v20969) indicated as RNAi B, c772Gal:UAS‐CD8,GFP:Mettl14 RNAi (v13542) indicated as RNAi A and c772Gal:UAS‐CD8,GFP:Mettl14 RNAi (v48560) indicated as RNAi B.
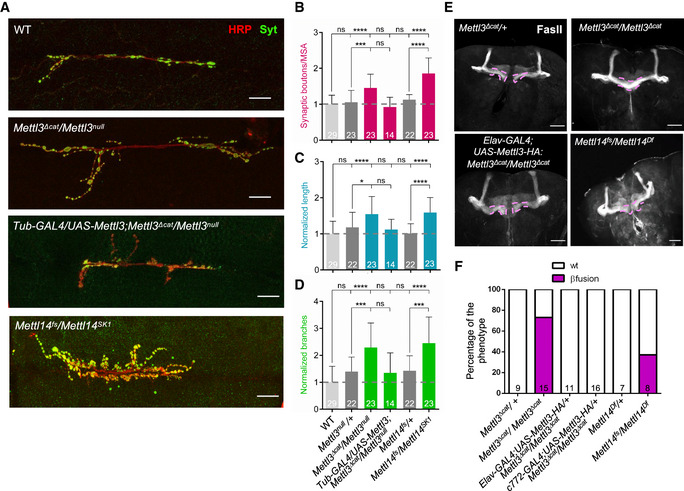
- A
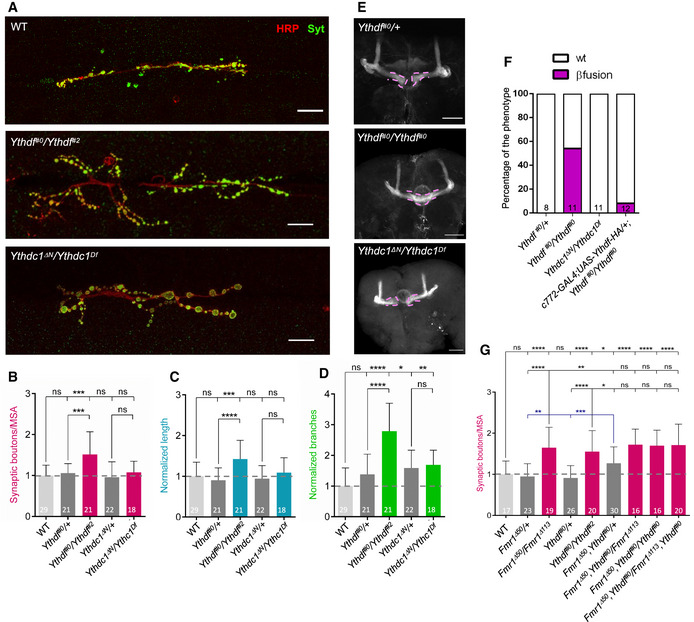
Representative confocal images of muscle‐6/7 NMJ synapses of abdominal hemisegments A2–A3 for the indicated genotypes labeled with anti‐synaptotagmin (green) and HRP (red) to reveal the synaptic vesicles and the neuronal membrane. Scale bar: 20 μm.
- B–D
Quantification of normalized bouton number ((B), total number of boutons/muscle surface area (μm2 × 1,000)), normalized axon length (C), and normalized branching (D) of NMJ 6/7 in A2–A3 of the indicated genotypes. Bars show mean ± s.e.m. Multiple comparisons were performed using one‐way ANOVA with a post hoc Sidak–Bonferroni correction. (n.s. = not significant; *P < 0.05; ***P < 0.001; ****P < 0.0001).
- E
Immunofluorescence analysis of adult brains for the indicated genotypes using anti‐Fascilin II (FasII) antibody to visualize lobes of the MB. Pink dashed lines highlight the normal and fused β‐lobes. Scale bar 50 μm.
- F
Quantification of the penetrance of fusion phenotype in the indicated genotypes.
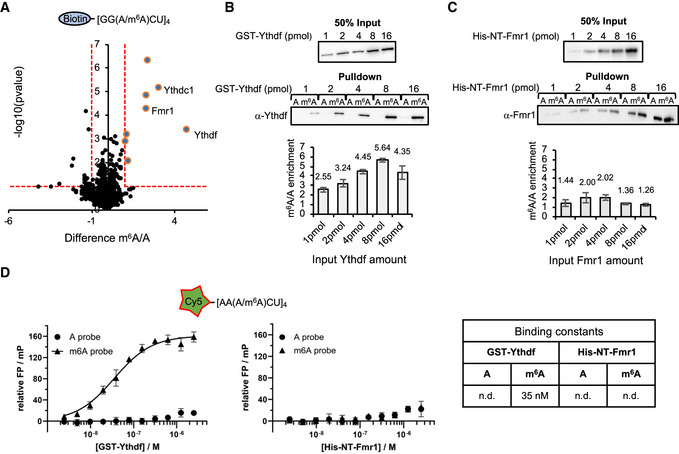
- A
Results of m6A RNA pulldown in BG3 protein cell extracts. Pulldown were performed using biotinylated probes containing four m6A consensus sites (GGACU), with or without the methylation. The P‐value is calculated from a two‐sided t‐test with unequal variants (Welch t‐test). Dashed lines represent −log10 P‐value = 1 as well as log2 enrichment = 1. m6A‐enriched proteins (−log10 P‐value > 1 and log2 enrichment > 1) are depicted by bigger dots.
- B, C
Western blot showing the protein enrichments upon pulldown of the same probes as in (A) incubated with increasing concentrations of purified recombinant GST‐Ythdf (B) and His‐NT‐Fmr1 proteins (C). Quantification of the m6A/A signal intensity is shown below the blot as median ± SEM of the triplicates. Both proteins bind more efficiently upon methylation.
- D
Results of fluorescence polarization (FP) assay using Cy5 labeled RNA probes containing four AAACU m6A consensus sites, with or without the methylation, incubated with GST‐Ythdf and His‐NT‐Fmr1. The relative FP values from three independent experiments including standard deviation were plotted using GraphPad Prism 8. Binding constants (kd values) were determined by fitting a Michaelis–Menten non‐linear regression onto the relative FP values in GraphPad Prism 8, if applicable. The respective binding constants are given in the table next to the graphs.
- A
Representative confocal images of muscle‐6/7 NMJ synapses of abdominal hemisegments A2‐A3 for the indicated genotypes labeled with anti‐synaptotagmin (green) and HRP (red) to reveal the synaptic vesicles and the neuronal membrane. Scale bar: 20 μm.
- B–D
Quantification of normalized bouton number ((B), total number of boutons/muscle surface area (μm2 × 1,000)), normalized axon length (C), and normalized branching (D) of NMJ 6/7 in A2‐A3 of the indicated genotypes. Bars show mean ± s.e.m. Multiple comparisons were performed using one‐way ANOVA with a post hoc Sidak–Bonferroni correction (n.s. = not significant; *P < 0.05; **P < 0.01; ***P < 0.001; ****P < 0.0001).
- E
Immunofluorescence analysis of adult brains for the indicated genotypes using anti‐Fascilin II (FasII) antibody to visualize lobes of the MB. Pink dashed lines highlight the normal and fused β‐lobes. Scale bar 50 μm.
- F
Quantification of the penetrance of fusion phenotype in the indicated genotypes.
- G
Quantification of normalized bouton number (total number of boutons/muscle surface area (μm2 × 1,000)), of NMJ 6/7 in A2‐A3 of the indicated genotypes. Bars show mean ± s.e.m. Multiple comparisons were performed using one‐way ANOVA with a post hoc Sidak–Bonferroni correction (n.s. = not significant; *P < 0.05; **P < 0.01; ***P < 0.001; ****P < 0.0001).
- A
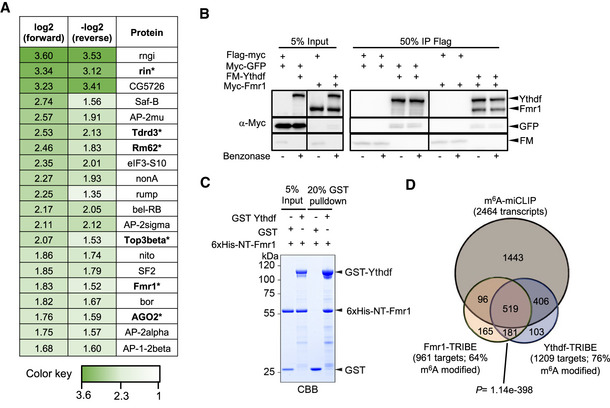
Heatmap indicating the normalized forward versus inverted reverse experiment enrichments on a log2 scale of quantitative proteomics upon pulldown of Flag‐tagged Ythdf in S2R+ cells. The threshold was set to a 1‐fold enrichment. Fmr1 is co‐purified with Ythdf. Known Fmr1 interacting proteins are highlighted in bold with asterisk.
- B
Co‐immunoprecipitation experiment in S2R+ cells co‐expressing Flag‐Myc‐tagged Ythdf and Myc‐tagged Fmr1. Ythdf was used as a bait via its Flag tag. The lysate was treated with Benzonase as indicated to remove interactions enabled by RNA.
- C
GST pulldown of recombinant GST‐Ythdf or GST alone mixed with recombinant 6xHis‐NT‐Fmr1. 2 µM of recombinant proteins were using during the pulldown. The pulldown of the proteins was analyzed by CBB staining.
- D
Overlap of miCLIP dataset generated in S2R+ cells defining m6A modified transcripts with Fmr1 and Ythdf mRNA targets determined by TRIBE in S2R+ cells. The indicated P‐value was determined by hypergeometric test.
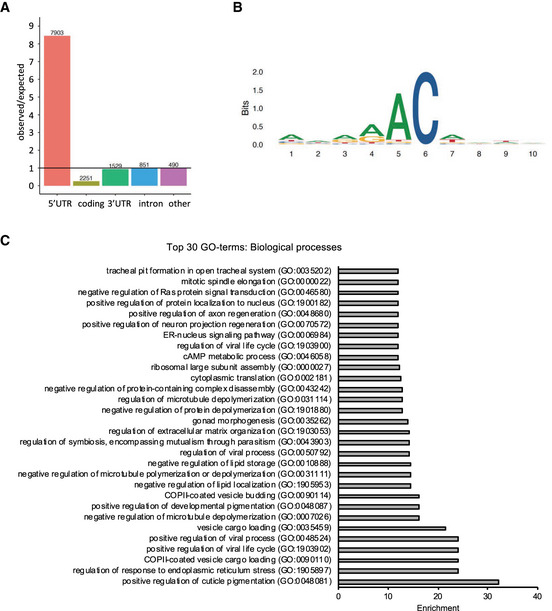
- A
Relative enrichment of m6A peaks across transcript segments identified by miCLIP. The numbers above the bars correspond to the number of m6A sites determined as described in the materials and methods section. In total, a set of 13024 C‐to‐T conversions CIMS and AC truncation CITS across 2464 genes was identified.
- B
Sequence logo of deduced consensus motif for m6A peaks centered on the modified adenosine.
- C
Top 30 enriched Gene ontology (GO)‐terms of biological processes for the gene set of m6A modified and Fmr1‐ and Ythdf‐bound transcripts.
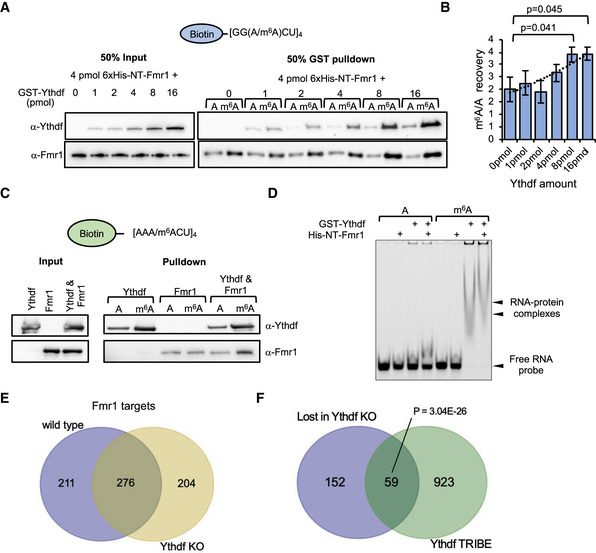
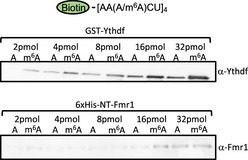
- A–D
Pulldown of biotinylated RNA probes of (A) repetitive GGACU sequences incubated with 4 pmol His‐NT‐Fmr1 and increasing concentrations of GST‐Ythdf and (B) the respective quantification plotted as the median of the m6A/A signal intensity ± SEM of three replicates. The indicated P‐values were determined by unpaired, two‐tailed Student’s t‐test. (C) AAACU sequences RNA probes incubated with either 32 pmol recombinant GST‐Ythdf or/and 6xHis‐NT‐Fmr1. Pulled down proteins were analyzed by immunoblotting using α‐Ythdf and α‐Fmr1 antibodies. (D) EMSA assay using purified GST‐Ythdf and His‐NT‐Fmr1 proteins and RNA probes in the AAACU sequence context.
- E
Intersection of Fmr1 RNA immunoprecipitation target genes for wild‐type and Ythdf KO brains, displaying a considerable number of genes gained and lost with Ythdf loss.
- F
Intersection of genes lost (i.e., bound in wild‐type but not in Ythdf KO) with Ythdf target genes determined by a TRIBE assay. P‐value calculated with hypergeometric test.
- A
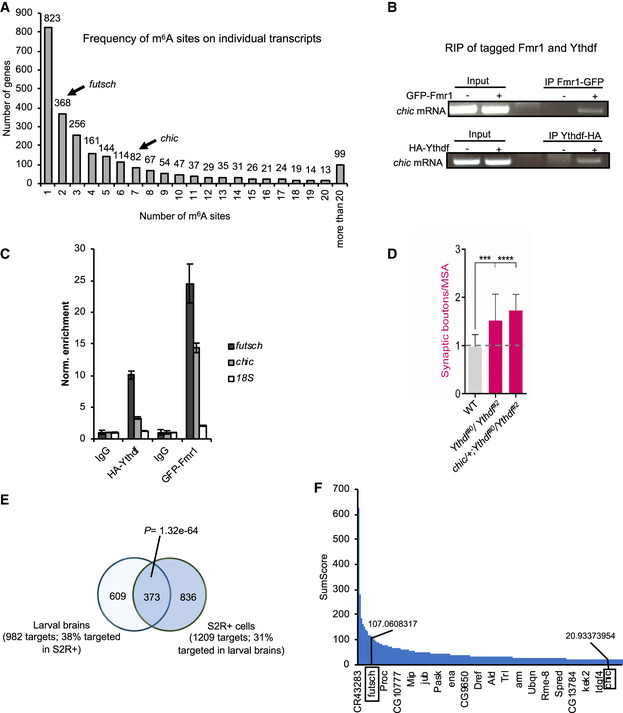
Graph showing the frequency of m6A sites on individual transcripts identified by miCLIP‐seq.
- B
RNA Immunoprecipitation of GFP‐tagged Fmr1 (Elav‐Gal4: UAS‐Fmr1‐GFP) or HA‐tagged Ythdf (Elav‐Gal4:UAS‐Ythdf‐HA) from 50 adult heads. The RNA was then reverse‐transcribed and analyzed via PCR with primers designed on chic transcript.
- C
RNA immunoprecipitation assay. Quantification of futsch and chic RNA levels upon immunoprecipitation of pan‐neuronally expressed GFP‐tagged Fmr1 or HA‐tagged Ythdf in 3rd instar larvae. Bars show average ± SD of technical triplicates. 18S mRNA serves as a negative control for unspecific enrichment.
- D
Quantification of normalized bouton number (total number of boutons/muscle surface area (μm2 × 1,000)) of muscle‐6/7 NMJ in hemisegments A2–A3 of the indicated genotypes (n = 20). Bars show mean ± s.e.m. Multiple comparisons were performed using one‐way ANOVA with a post hoc Sidak–Bonferroni correction (***P < 0.001; ****P < 0.0001).
- E
Vein diagram showing the overlap of Ythdf‐TRIBE datasets produced in S2R + cells and in larval brain. The P‐value is calculated by hypergeometric test.
- F
Graph showing the distribution of SumScores of all identified Ythdf mRNA targets by TRIBE in the larval nervous system. The position and SumScores of futsch and chic are marked in the graph.
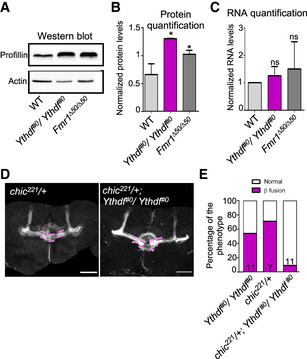
- A
Representative Western blot analysis of protein extracts of late pupae heads (85–95 h) from control, Ythdf#0/ Ythdf#0 and Fmr1∆50/Fmr1∆50 flies. The membranes were probed with anti‐Profilin or anti‐Actin antibodies.
- B
Quantification of Profilin protein levels (mean ± SD) obtained from three independent protein extraction and Western blot analysis as in (A). Quantification was performed using Fiji. **P < 0.005; *P < 0.05, measured with unpaired t‐test.
- C
Quantification of chic mRNA levels (mean ± SD) obtained from six independent RNA extractions from control, Ythdf#0/Ythdf#0 and Fmr1∆50 late pupae heads, via real‐time PCR analysis. Statistical analysis using unpaired t‐test show no significant difference between the samples.
- D
Immunofluorescence analysis of adult chic/+ and chic/+; Ythdf#0/Ythdf#0 using anti‐FasII antibody. Scale bar: 50 μm. Pink dashed lines highlight the normal and fused β‐lobes.
- E
Quantification of the penetrance of β‐lobe fusion phenotype for the indicated genotypes. Bars are labeled with the number of replicates.
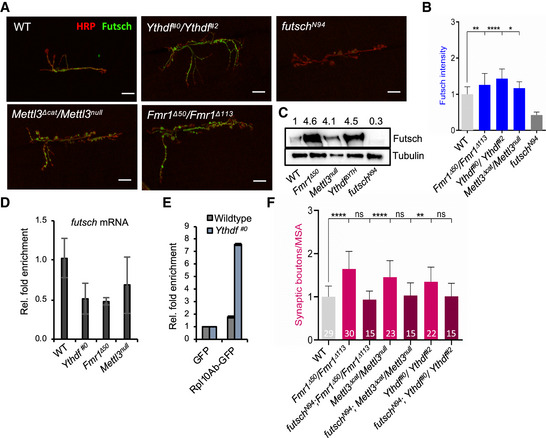
- A
Representative confocal images of muscle‐6/7 NMJ synapses of abdominal hemisegment A2 for the indicated genotypes labeled with HRP (red) and α‐futsch (green) to reveal the neuronal membrane and Futsch protein level. Scale bar: 20 μm.
- B
Quantification of normalized Futsch protein level at NMJ 6/7 in A3 of the indicated genotypes (n = 20). Bars show mean ± s.e.m. P values were determined with a Student’s t‐test. (*P < 0.05; **P < 0.01; ****P < 0.0001).
- C
Western blot analysis of Futsch protein level in isolated third instar larval brains of different mutants compared to control. Numbers indicate normalized Futsch protein level in comparison to Tubulin levels.
- D
Quantification of futsch mRNA levels obtained from isolated 3rd instar larvae brains of the indicated genotypes via real‐time PCR analysis. Bars show average ± SD of biological triplicates.
- E
Translating Ribosome affinity purification assay. Quantification of futsch mRNA levels upon immunoprecipitation of GFP‐tagged Rpl10Ab or GFP in wild‐type and Ythdf#0 3rd instar larvae with Real‐time qPCR. Bars show average ± SD of technical triplicates.
- F
Quantification of normalized bouton number (total number of boutons/muscle surface area (μm2 × 1,000)) of NMJ 6/7 in hemisegment A3 of the indicated genotypes. Bars show mean ± s.e.m. Multiple comparisons were performed using one‐way ANOVA with a post hoc Sidak–Bonferroni correction (n.s. = not significant; **P < 0.01; ****P < 0.0001).
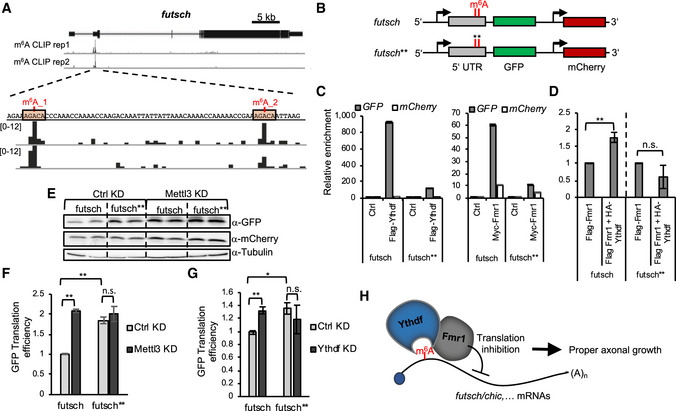
- A
futsch genomic region (X1,408,435–1,454,00) and corresponding browser tracks from miCLIP‐seq experiments in S2R+ cells. futsch transcripts contain two m6A peaks in its 5´ UTR, as indicated.
- B
Schematic of GFP reporter constructs containing an actin promoter and either wild‐type 5´ UTR region of futsch or a mutated version (futsch**) containing two‐point mutations (A – T) at the identified m6A sites. mCherry is under the control of a same actin promoter.
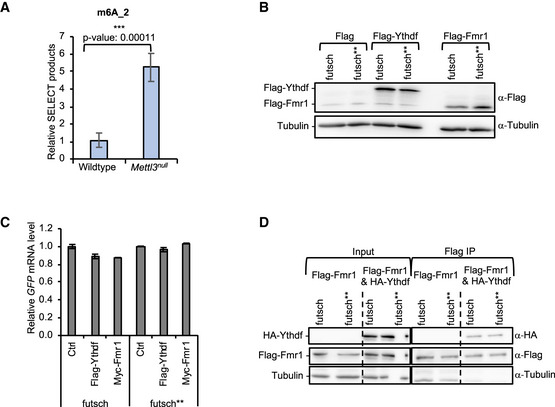
- C, D
RNA immunoprecipitation assay. Quantification of GFP RNA levels upon immunoprecipitation of Myc‐tagged Fmr1 or Flag‐tagged Ythdf. Bars show average ± SD of technical triplicates (C) or Flag‐tagged Fmr1 in the presence of overexpressed HA‐tagged Ythdf. Bars show median ± s.e.m. of biological triplicates. P‐values were determined with an unpaired, two‐tailed Student’s t‐test. (n.s. = not significant; **P < 0.01) (D). Rpl15 levels were used as a normalization control and the enrichment of mCherry is shown as a negative control for background binding.
- C, D
- E–G
Representative Western blot analysis of the protein level (E) and quantification of the translation efficiency of S2R+ cells transfected with the wild‐type or mutated futsch reporter constructs upon control or Mettl3 KD (F) or Ythdf KD (G). LacZ dsRNA was used for the control KD. The translation efficiency was calculated as the ratio of the relative GFP protein level and GFP mRNA level. mCherry served as a normalization control for both the protein and mRNA level. Bars show mean ± s.e.m of biological triplicates. P values were determined with a Student’s t‐test. (n.s. = not significant; *P < 0.05; **P < 0.01).
- H
Model of the interplay between Ythdf and Fmr1 in translation control.
- A
Relative amount of SELECT qPCR products targeting the m6A_2 site on futsch using total RNA of Wild‐type or Mettl3null larval brains. Bars show average ± SD of biological triplicates. P values were determined with a Student’s t‐test. (***P < 0.001).
- B
Representative Western blot analysis showing the protein input level for RNA immunoprecipitation experiment of futsch 5’UTR GFP reporter.
- C
Relative GFP mRNA input level for RNA immunoprecipitation experiment of futsch 5’UTR GFP reporter. Rpl15 served as a normalization control. Experiments were performed in triplicates. Bars show average ± SD.
- D
Representative Western blot analysis showing the protein input level and IP efficiencies for RNA immunoprecipitation experiment of futsch 5’UTR GFP reporter in the presence of HA‐Ythdf and Flag‐Fmr1.
Similar articles
-
The RNA-binding protein FMRP facilitates the nuclear export of N6-methyladenosine-containing mRNAs.J Biol Chem. 2019 Dec 27;294(52):19889-19895. doi: 10.1074/jbc.AC119.010078. Epub 2019 Nov 21. J Biol Chem. 2019. PMID: 31753916 Free PMC article.
-
The Nab2 RNA-binding protein patterns dendritic and axonal projections through a planar cell polarity-sensitive mechanism.G3 (Bethesda). 2022 May 30;12(6):jkac100. doi: 10.1093/g3journal/jkac100. G3 (Bethesda). 2022. PMID: 35471546 Free PMC article.
-
Fragile X mental retardation protein modulates the stability of its m6A-marked messenger RNA targets.Hum Mol Genet. 2018 Nov 15;27(22):3936-3950. doi: 10.1093/hmg/ddy292. Hum Mol Genet. 2018. PMID: 30107516 Free PMC article.
-
RNA interference: a new mechanism by which FMRP acts in the normal brain? What can Drosophila teach us?Ment Retard Dev Disabil Res Rev. 2004;10(1):68-74. doi: 10.1002/mrdd.20011. Ment Retard Dev Disabil Res Rev. 2004. PMID: 14994291 Review.
-
Come FLY with us: toward understanding fragile X syndrome.Genes Brain Behav. 2005 Aug;4(6):385-92. doi: 10.1111/j.1601-183X.2005.00136.x. Genes Brain Behav. 2005. PMID: 16098136 Review.
Cited by
-
RNA modifications in insects.Front Insect Sci. 2024 Aug 26;4:1448766. doi: 10.3389/finsc.2024.1448766. eCollection 2024. Front Insect Sci. 2024. PMID: 39253349 Free PMC article. Review.
-
The RNA-binding protein Nab2 regulates levels of the RhoGEF Trio to govern axon and dendrite morphology.Mol Biol Cell. 2024 Aug 1;35(8):ar109. doi: 10.1091/mbc.E24-04-0150. Epub 2024 Jul 10. Mol Biol Cell. 2024. PMID: 38985523 Free PMC article.
-
Identification of genes modified by N6-methyladenosine in patients with colorectal cancer recurrence.Front Genet. 2022 Oct 17;13:1043297. doi: 10.3389/fgene.2022.1043297. eCollection 2022. Front Genet. 2022. PMID: 36324506 Free PMC article.
-
m6A Profile Dynamics Indicates Regulation of Oyster Development by m6A-RNA Epitranscriptomes.Genomics Proteomics Bioinformatics. 2023 Aug;21(4):742-755. doi: 10.1016/j.gpb.2022.12.002. Epub 2022 Dec 7. Genomics Proteomics Bioinformatics. 2023. PMID: 36496129 Free PMC article.
-
The making of the Drosophila mushroom body.Front Physiol. 2023 Jan 13;14:1091248. doi: 10.3389/fphys.2023.1091248. eCollection 2023. Front Physiol. 2023. PMID: 36711013 Free PMC article. Review.
References
-
- Arguello AE, DeLiberto AN, Kleiner RE (2017) RNA chemical proteomics reveals the N(6)‐methyladenosine (m(6)A)‐regulated protein‐RNA interactome. J Am Chem Soc 139: 17249–17252 - PubMed
Publication types
MeSH terms
Substances
LinkOut - more resources
Full Text Sources
Other Literature Sources
Molecular Biology Databases
