

Targeted attenuation of elevated histone marks at SNCA alleviates α-synuclein in Parkinson's disease
- PMID: 33428332
- PMCID: PMC7863397
- DOI: 10.15252/emmm.202012188
Targeted attenuation of elevated histone marks at SNCA alleviates α-synuclein in Parkinson's disease
Abstract
Epigenetic deregulation of α-synuclein plays a key role in Parkinson's disease (PD). Analysis of the SNCA promoter using the ENCODE database revealed the presence of important histone post-translational modifications (PTMs) including transcription-promoting marks, H3K4me3 and H3K27ac, and repressive mark, H3K27me3. We investigated these histone marks in post-mortem brains of controls and PD patients and observed that only H3K4me3 was significantly elevated at the SNCA promoter of the substantia nigra (SN) of PD patients both in punch biopsy and in NeuN-positive neuronal nuclei samples. To understand the importance of H3K4me3 in regulation of α-synuclein, we developed CRISPR/dCas9-based locus-specific H3K4me3 demethylating system where the catalytic domain of JARID1A was recruited to the SNCA promoter. This CRISPR/dCas9 SunTag-JARID1A significantly reduced H3K4me3 at SNCA promoter and concomitantly decreased α-synuclein both in the neuronal cell line SH-SY5Y and idiopathic PD-iPSC derived dopaminergic neurons. In sum, this study indicates that α-synuclein expression in PD is controlled by SNCA's histone PTMs and modulation of the histone landscape of SNCA can reduce α-synuclein expression.
Keywords: CRISPR/Cas9; Parkinson’s disease; histone post-translational modifications; iPSCs; α-synuclein.
© 2021 The Authors. Published under the terms of the CC BY 4.0 license.
Conflict of interest statement
The authors declare that they have no conflict of interest.
Figures
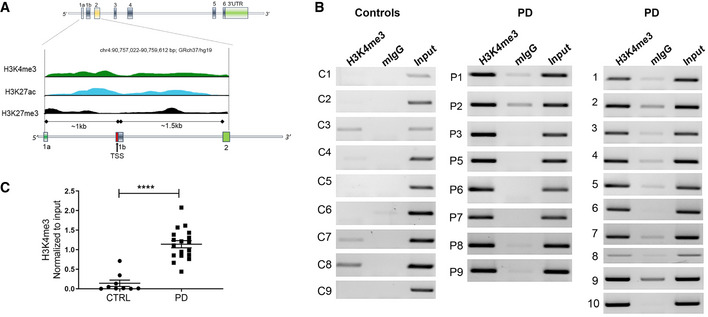
- A
Human SNCA gene contains six coding exons and two 5’ non‐coding exons. The exons are represented by vertical colored boxes. The region from exon 1a to exon 2 (~2.5 kb) is scaled up to show the distribution of histone PTMs. Distribution of the histone PTMs from the SN region of one donor brain sample is shown. Peaks of three different histone PTMs, H3K4me3 (green), H3K27ac (blue), and H3K27me3 (black), at the regulatory region of SNCA were adopted from Roadmap Epigenomics Database. For a detailed view, please see Appendix Fig S1 where screenshot of the original figure is shown. The TSS is indicated by a red vertical bar and distances of exon 1a and 1b from the TSS are indicated.
- B
ChIP gel images showing the relative enrichment by H3K4me3 in controls (n = 9) and PD patients (n = 18). PCR amplified a 188‐bp region of SNCA from intron 1 where H3K4me3 peak was at its optimum. Mouse IgG (mIgG) was used as control and the bands were normalized by unbiased amplification from respective inputs.
- C
Relative intensities calculated from the gel images. Graph shows that H3K4me3 was significantly enriched at the upstream regulatory region of SNCA in PD compared to control subjects. ****P < 0.0001. Data were analyzed using non‐parametric t‐test followed by Mann–Whitney post hoc corrections. Two‐tailed P‐values were calculated for all.
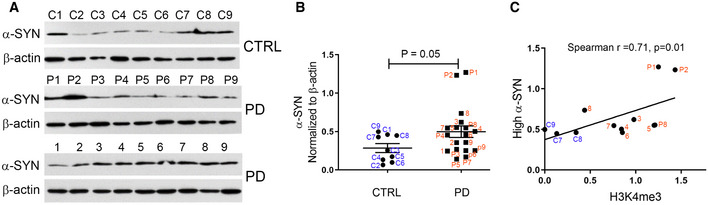
- A
Western blot gel images showing α‐synuclein (α‐SYN) levels in SN tissues from control (n = 9) and PD subjects (n = 18). The numbers on top of each gel panel show the ID of each sample.
- B
The relative levels of α‐synuclein between the two groups were evaluated statistically. PD subjects had moderately higher levels of α‐SYN compared to controls. ID of each dot is shown in the graph.
- C
The normalized levels of α‐synuclein in the entire cohort were divided into high (n = 12) and low levels. The cutoff value for determining the threshold was set at the median from all the subjects. The high levels of α‐synuclein were plotted with corresponding H3K4me3 values of those subjects. The corresponding ID of each sample is shown next to each point in the graph. There was a significant correlation between high levels of α‐synuclein and H3K4me3.
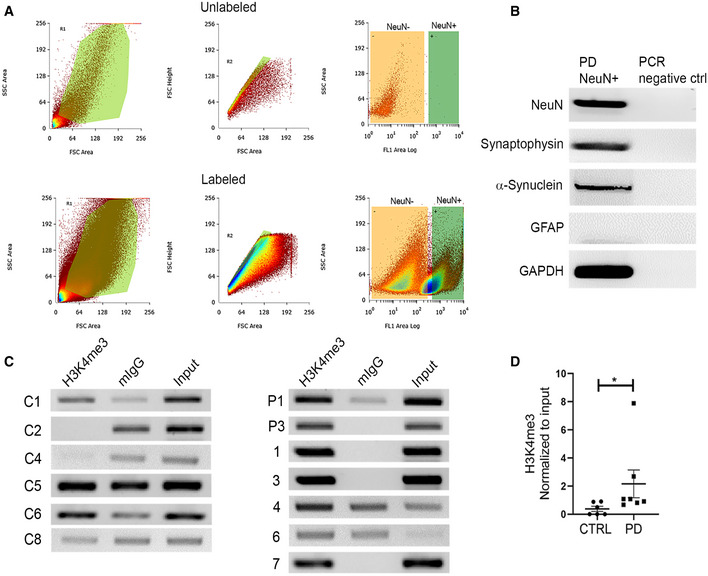
- A
20,000 NeuN labeled neuronal nuclei were collected by fluorescent activated nuclei sorting (FANS) from control (n = 6) and PD (n = 7) SN tissues. The NeuN‐positive nuclei were labeled by anti‐rabbit IgG secondary antibody tagged with Alexa fluor 488. The top and bottom panels show representative sort gating windows from an unlabeled and labeled patient sample, respectively. The left column represents size versus granularity gatings. The samples were then gated for singularity using forward scatter height (y‐axis) versus forward scatter area (x‐axis), and lastly, singularly gated nuclei were sorted based on NeuN positivity (x‐axis; FL1 channel) versus side scatter (y‐axis). The green rectangular quadrants on the right column of both panels represent the NeuN+ region, as unstained sample did not show any significant representation. Therefore, from each of the stained samples, 20,000 bright NeuN+ nuclei (green rectangle gate) were sorted and collected.
- B
Gel images from RT–PCR show purity of the sorted nuclei from a representative PD sample. Nuclear RNA was isolated, and cDNA was generated and pre‐amplified (see Materials and Methods for details) before target‐specific PCR. Neuron‐specific genes (NeuN, synaptophysin) and astrocyte‐specific gene (GFAP), α‐synuclein, and GAPDH were amplified from the isolated nuclei.
- C
ChIP was performed on the equal number of isolated nuclei against H3K4me3 from all samples. Gel images represent the ChIP‐based PCR amplification. The same primer pair was used to amplify the target region on SNCA as Fig 1. Mouse IgG was used as a control.
- D
The graph represents the statistically significant difference of relative H3K4me3 enrichment between PD (n = 7) and controls (n = 6). Neuronal nuclei from PD brain samples show significantly higher enrichment of H3K4me3 at SNCA intron 1 (P = 0.01) compared to controls. *P < 0.05. Data were analyzed using non‐parametric t‐test followed by Mann–Whitney post hoc corrections. Two‐tailed P‐values were calculated for all.
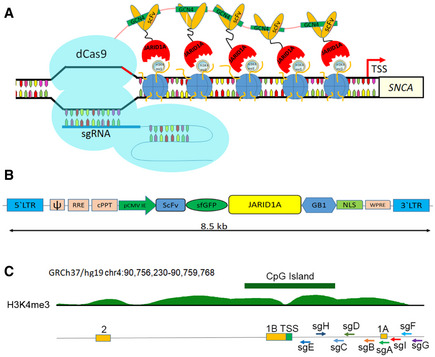
- A
Schematic diagram shows how the SunTag‐JARID1A system is recruited at the SNCA promoter. The dCas9‐5xGCN4, scFV‐JARID1A, and sgRNA plasmids are co‐overexpressed in the cells. The dCas9‐5xGCN4 is recruited to the SNCA promoter as directed by the specific sgRNA. Five scFV‐JARID1A molecules in turn recognize the GCN4 polypeptide sequences of dCas9. Upon recruitment of the entire system, SunTag‐JARID1A demethylates H3K4me3 at the target region.
- B
Structure of pLvx‐scFV‐sfGFP‐JARID1A. The scFV‐sfGFP catalytic domain of JARID1A was sub‐cloned into a lentiviral vector. The distance between the 5’ and 3’ Long Terminal Repeats in the vector is 8.5 kb. The components of the plasmids are as follows: ψ, packaging signal; RRE, rev response element; cPPT, central polypurine tract; pCMV IE, immediate early cytomegalovirus promoter; scFV, single chain variable fragment; sfGFP, super folder GFP; JARID1A; catalytic domain of JARID1A; GB1, solubility tag protein; NLS, nuclear localization signal; WPRE, woodchuck hepatitis virus (WHP) post‐transcriptional regulatory element.
- C
Relative positions of the nine sgRNAs. A ray diagram exhibits the locations of the nine sgRNAs in relation to the upstream regulatory regions of SNCA and the H3K4me3 and H3K27me3 peaks. The locations of the sgRNAs are as follows with respect to the TSS: sgA, 1,117 bp; sgB, 836 bp; sgC, 747 bp; sgD, 700 bp; sgE, 153 bp; sgF, 1,454 bp; sgG, 1,537 bp; sgH, 132 bp; sgI, 1,320 bp. The two non‐coding exons (1A and 1B) along with the first coding exon (exon 2) are also shown. GRCh37/hg19 contig was used to describe the location of the gene and associated distribution of histone PTMs. The histone peaks shown were from midbrain regions of two adult post‐mortem human samples.
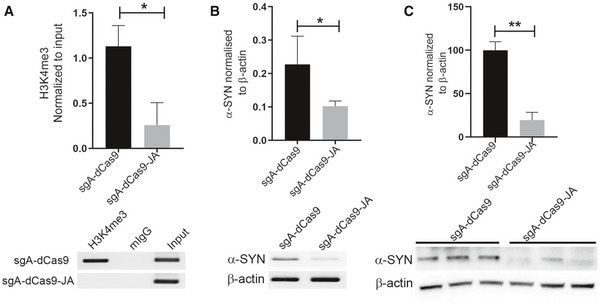
- A
ChIP data demonstrated a significant decrease of H3K4me3 at the SNCA promoter. The relative enrichment by H3K4me3 was normalized to the respective inputs. Four independent repeats were performed. *P < 0.05. Data were analyzed using non‐parametric t‐test followed by Mann–Whitney post hoc corrections. Two‐tailed P‐values were calculated. Only representative gel is shown here, the gels for other replicates are presented in Appendix Fig S12A.
- B
The levels of α‐synuclein (α‐SYN) in SH‐SY5Y cells were evaluated using RT–PCR. The level of α‐SYN was normalized to β‐actin expression. A significant reduction of α‐SYN in cells expressing scFV‐sfGFP‐JARID1A was observed. Four independent repeats were performed. *P < 0.05. Data were analyzed using non‐parametric t‐test followed by Mann–Whitney post hoc corrections. Two‐tailed P‐values were calculated. Only representative gel is shown here, the gels for other replicates are presented in Appendix Fig S12B.
- C
α‐SYN levels in SH‐SY5Y cells were also evaluated using Western blot. The levels of α‐SYN were normalized to β‐actin. Significant reduction of α‐SYN was observed in cells expressing JARID1A. Three independent repeats were performed. Percentage of reduction is shown in the graph. **P < 0.01. Data were analyzed using non‐parametric t‐test followed by Mann–Whitney post hoc corrections. Two‐tailed P‐values were calculated.
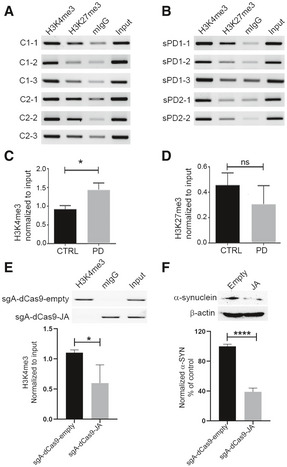
- A, B
Relative enrichment of H3K4me3 and H3K27me3 at the SNCA promoter/intron 1 region was evaluated from six iPSC lines of two control subjects and five iPSC lines derived from two sporadic PD (sPD) cases by ChIP. The same genomic region as shown in Fig 1 and Appendix Fig S2C was evaluated for enrichment of H3K4me3 and H3K27me3. Mouse IgG (mIgG) was used as control for the target antibody. The relative intensity of the target band was normalized by respective input.
- C
ChIP on H3K4me3 at the SNCA promoter between control and sPD1‐1 lines revealed a marginally higher enrichment in sPD lines as compared to the controls.
- D
Relative comparison of H3K27me3 enrichment between control and sPD lines revealed no significant difference between the two groups.
- E
ChIP on H3K4me3 at the SNCA promoter between sPD1‐1 lines after locus‐specific epigenomic modulation. Differentiated cells were transiently transfected with either sgA‐dCas9 5xGCN4‐scFV‐JARID1A or sg A‐dCas9 5xGCN4‐scFV‐empty backbone vectors. A significant reduction in H3K4me3 at the SNCA promoter was observed in cells transfected with JARID1A. A representative ChIP image is shown, and the gels for other replicates are presented in Appendix Fig S12C.
- F
Western blot analysis of α‐synuclein (α‐SYN) levels in the cells under the same conditions as analyzed in (E). A significant decrease (56–66%) in α‐SYN levels was observed in cells transfected with JARID1A. The normalized and relative expression of α‐SYN in JARID1A transfected cells are shown as a percentage of control (transfected by empty backbone vector). A representative Western blot image is shown at the top, the gels for other replicates are presented in Appendix Fig S12D.
Similar articles
-
Downregulation of SNCA Expression by Targeted Editing of DNA Methylation: A Potential Strategy for Precision Therapy in PD.Mol Ther. 2018 Nov 7;26(11):2638-2649. doi: 10.1016/j.ymthe.2018.08.019. Epub 2018 Aug 29. Mol Ther. 2018. PMID: 30266652 Free PMC article.
-
CRISPR-Cas9-Edited SNCA Knockout Human Induced Pluripotent Stem Cell-Derived Dopaminergic Neurons and Their Vulnerability to Neurotoxicity.Biol Pharm Bull. 2023;46(3):517-522. doi: 10.1248/bpb.b22-00839. Biol Pharm Bull. 2023. PMID: 36858582
-
Alpha-synuclein dynamics in induced pluripotent stem cell-derived dopaminergic neurons from a Parkinson's disease patient (PARK4) with SNCA triplication.FEBS Open Bio. 2021 Feb;11(2):354-366. doi: 10.1002/2211-5463.13060. Epub 2021 Jan 5. FEBS Open Bio. 2021. PMID: 33301617 Free PMC article.
-
Deregulation of α-synuclein in Parkinson's disease: Insight from epigenetic structure and transcriptional regulation of SNCA.Prog Neurobiol. 2017 Jul;154:21-36. doi: 10.1016/j.pneurobio.2017.04.004. Epub 2017 Apr 23. Prog Neurobiol. 2017. PMID: 28445713 Free PMC article. Review.
-
Modeling Parkinson's disease using induced pluripotent stem cells.Curr Neurol Neurosci Rep. 2012 Jun;12(3):237-42. doi: 10.1007/s11910-012-0270-y. Curr Neurol Neurosci Rep. 2012. PMID: 22538490 Free PMC article. Review.
Cited by
-
CRISPR/Cas9 Gene Editing: A Novel Approach Towards Alzheimer's Disease Treatment.CNS Neurol Disord Drug Targets. 2024;23(12):1405-1424. doi: 10.2174/0118715273283786240408034408. CNS Neurol Disord Drug Targets. 2024. PMID: 38716549 Review.
-
Unraveling Dysregulated Cell Signaling Pathways, Genetic and Epigenetic Mysteries of Parkinson's Disease.Mol Neurobiol. 2024 Nov;61(11):8928-8966. doi: 10.1007/s12035-024-04128-1. Epub 2024 Apr 4. Mol Neurobiol. 2024. PMID: 38573414 Review.
-
Gut microbiota defined epigenomes of Alzheimer's and Parkinson's diseases reveal novel targets for therapy.Epigenomics. 2024 Jan;16(1):57-77. doi: 10.2217/epi-2023-0342. Epub 2023 Dec 13. Epigenomics. 2024. PMID: 38088063 Free PMC article. Review.
-
Development of Locus-Directed Editing of the Epigenome from Basic Mechanistic Engineering to First Clinical Applications.Methods Mol Biol. 2024;2842:3-20. doi: 10.1007/978-1-0716-4051-7_1. Methods Mol Biol. 2024. PMID: 39012588
-
Precise epigenomic editing with a SunTag-based modular epigenetic toolkit.Epigenetics. 2022 Dec;17(13):2075-2081. doi: 10.1080/15592294.2022.2106646. Epub 2022 Aug 3. Epigenetics. 2022. PMID: 35920441 Free PMC article.
References
-
- Appel‐Cresswell S, Vilarino‐Guell C, Encarnacion M, Sherman H, Yu I, Shah B, Weir D, Thompson C, Szu‐Tu C, Trinh J et al (2013) Alpha‐synuclein p. H50Q, a novel pathogenic mutation for Parkinson's disease. Mov Disord 28: 811–813 - PubMed
-
- Barski A, Cuddapah S, Cui K, Roh TY, Schones DE, Wang Z, Wei G, Chepelev I, Zhao K (2007) High‐resolution profiling of histone methylations in the human genome. Cell 129: 823–837 - PubMed
-
- Braak H, Del Tredici K, Rub U, de Vos RA, Jansen Steur EN, Braak E (2003) Staging of brain pathology related to sporadic Parkinson's disease. Neurobiol Aging 24: 197–211 - PubMed
Publication types
MeSH terms
Substances
Grants and funding
LinkOut - more resources
Full Text Sources
Other Literature Sources
Medical
Miscellaneous
