. 2021 Jan 10;13(3):3819-3842.
doi: 10.18632/aging.202351. Epub 2021 Jan 10.

Four hub genes regulate tumor infiltration by immune cells, antitumor immunity in the tumor microenvironment, and survival outcomes in lung squamous cell carcinoma patients

Affiliations

Four hub genes regulate tumor infiltration by immune cells, antitumor immunity in the tumor microenvironment, and survival outcomes in lung squamous cell carcinoma patients

Tuo Zhang et al. Aging (Albany NY). .

Abstract

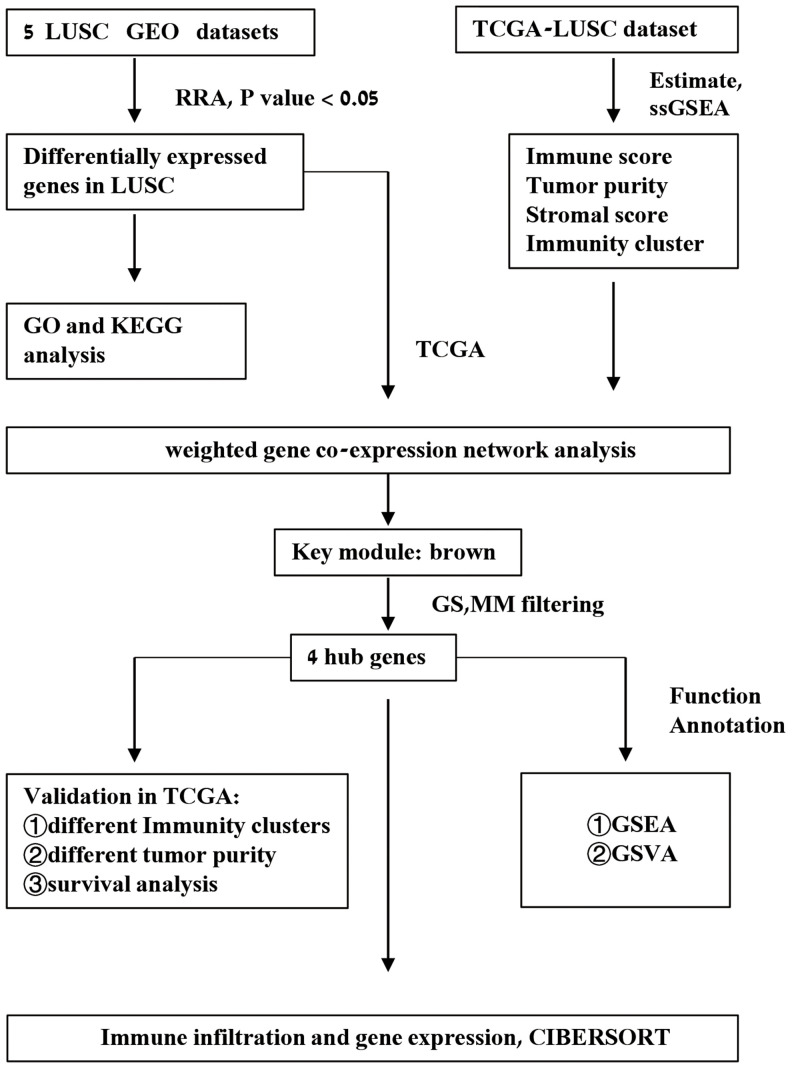
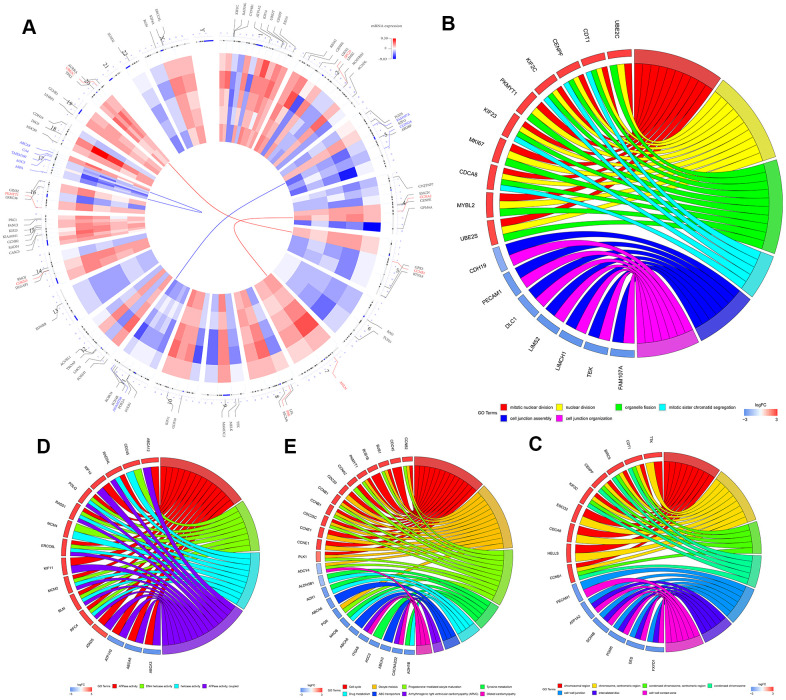
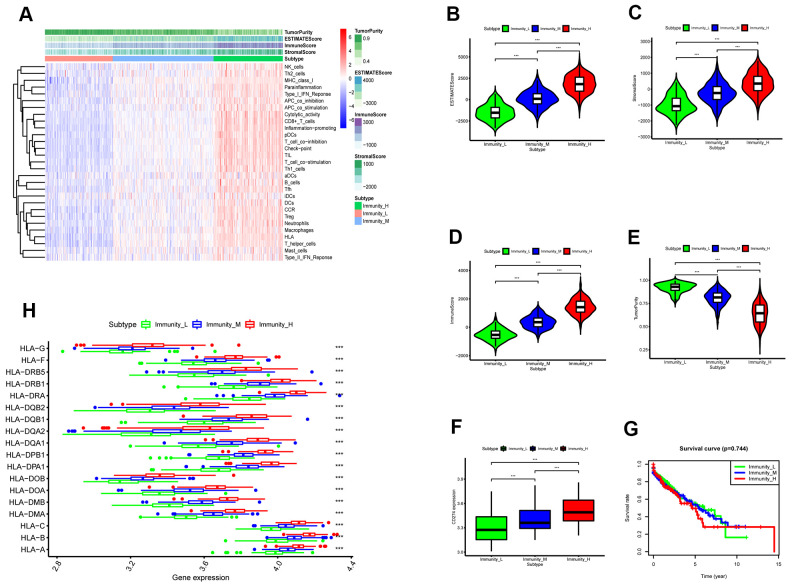
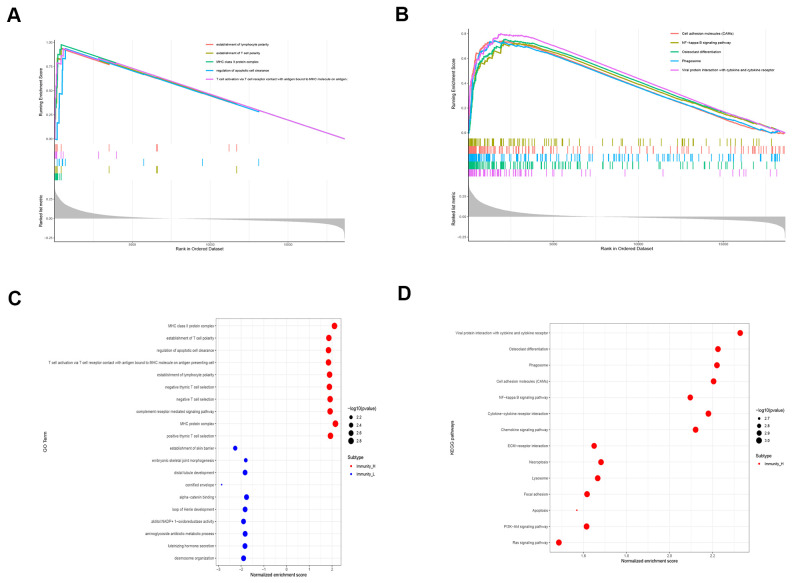
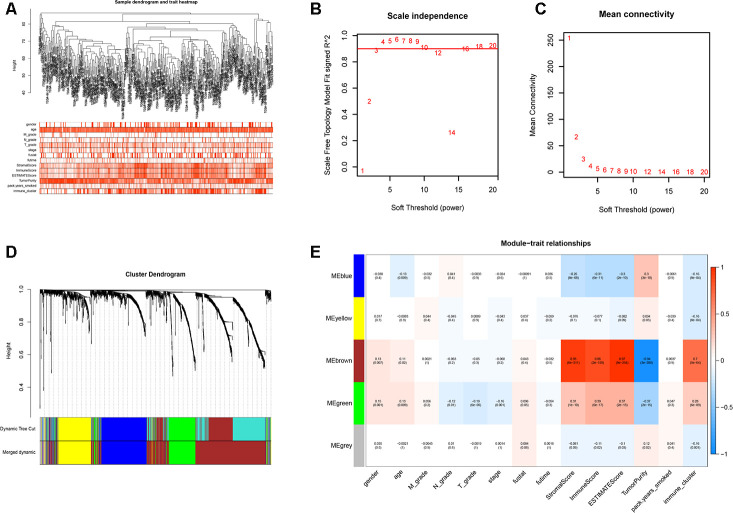
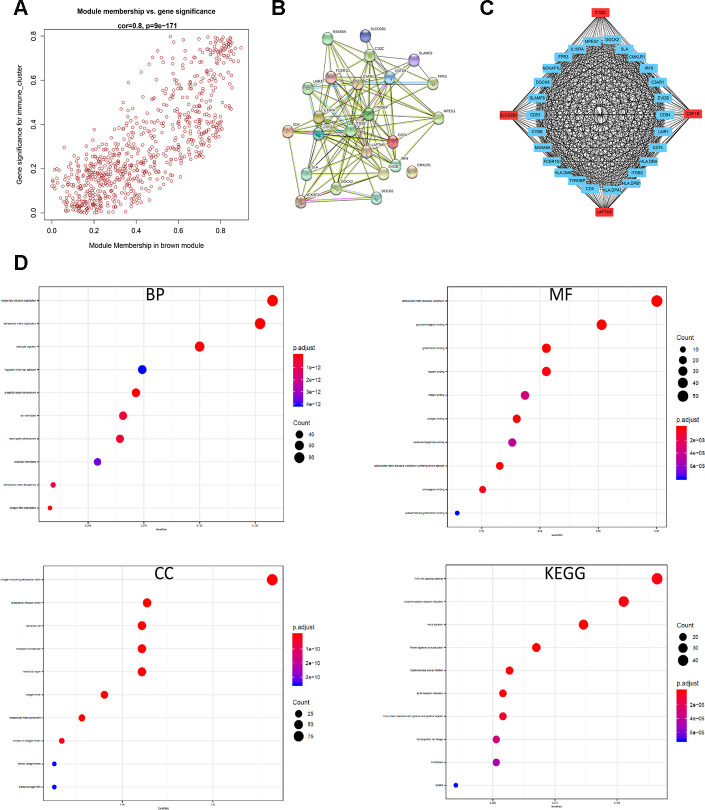
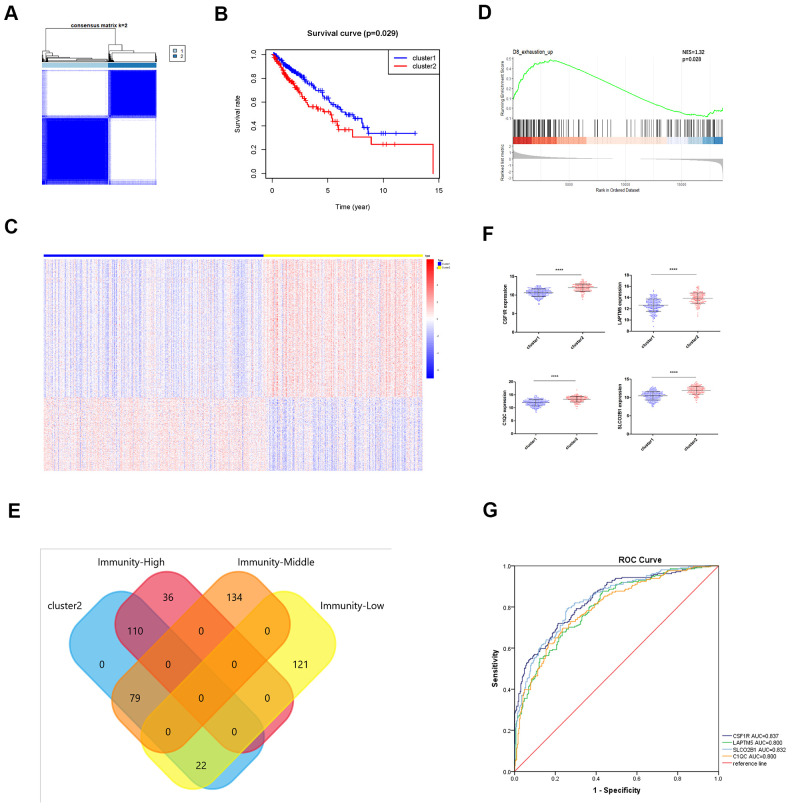
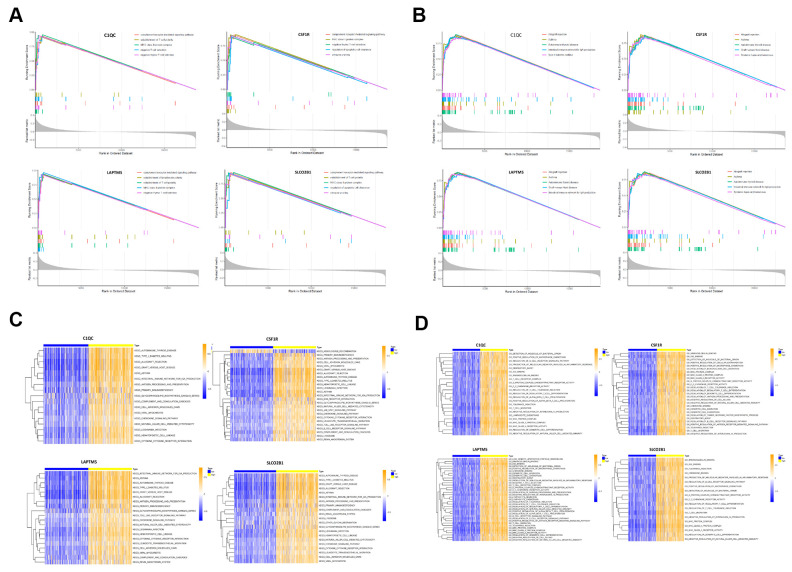
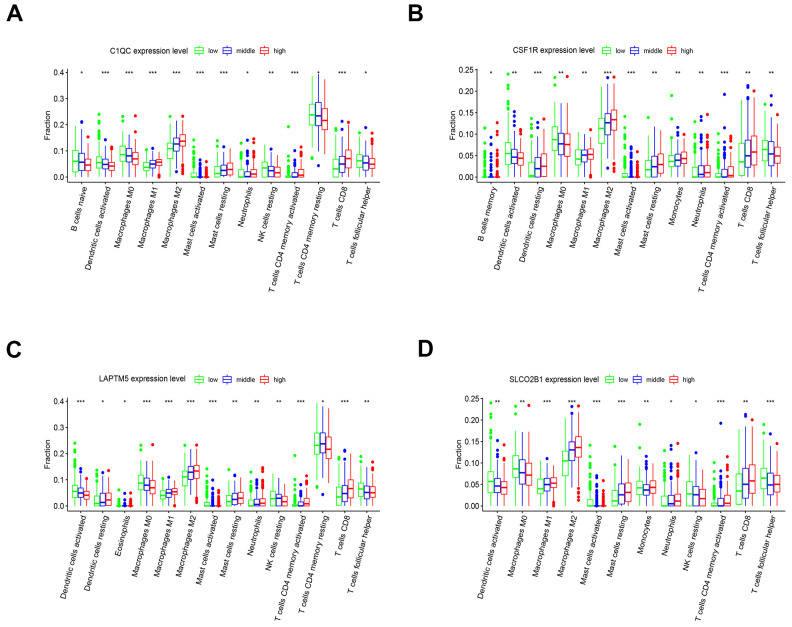
In this study, we performed bioinformatics analyses to identify hub genes that regulate tumor infiltration by immune cells and antitumor immunity in the lung squamous cell carcinoma (LUSC). We identified 1738 robust and stable differentially expressed genes (DEGs) in the LUSC tissues based on robust rank aggregation (RRA) analysis of RNA-sequencing data from 5 GEO-LUSC datasets. We then classified TCGA-LUSC patients based on ssGSEA and ESTIMATE analyses of LUSC tissues into high, medium and low immunity subgroups showing significant differences in tumor purity. Weighted gene co-expression network analysis of the robust DEGs revealed five immunity-related modules, including the brown module with 762 DEGs and 30 hub genes showing the highest correlation with the immunity-related LUSC patient subgroups and their clinicopathological characteristics. We selected four hub genes, LAPTM5, C1QC, CSF1R and SLCO2B1, for validation of the immunity status and prognosis of LUSC patients. High expression of these four genes correlated with increased infiltration of immune cell types, upregulation of the immunosuppressive TOX pathway genes, CD8+ T cell exhaustion, and shorter overall survival of LUSC patients. These findings demonstrate that four hub genes regulate tumor infiltration of immune cells, anti-tumor immunity, and survival outcomes in LUSC patients.

Keywords: CIBERSORT; immunity; lung squamous carcinoma; robust rank aggregations; single sample gene set enrichment analysis.


Conflict of interest statement

CONFLICTS OF INTEREST: The authors declare that there are no conflicts of interest.

Figures

Figure 1
Figure 1
Schematic representation of the study workflow.
Figure 2
Figure 2
Identification and functional enrichment analysis of robust DEGS in five GEO-LUSC datasets. (A) The circular heatmaps show the differential expressed genes (DEGs) in the five GEO-LUSC datasets, which are shown in the inner circle. The upregulated genes are shown in red and the downregulated genes are represented in blue. Genes that are not present in a given dataset are shown in white. The outer circle represents the chromosomes. The lines indicate their specific chromosomal locations of each gene. The top 4 up-regulated and down-regulated genes according to the adjusted P values are shown in red and blue, respectively and are connected by the red and blue lines to the center of the circles. (B) The chord plot shows the relationship between the top 300 DEGs and the GO terms related to the biological processes (BP). (C) The chord plot depicts the relationship between the top 300 DEGs and the GO terms related to the cellular components (CC). (D) The chord plot depicts the relationship between the top 300 DEGs and the GO terms related to the molecular functions (MF). (E) The chord plot depicts the relationship between the top 300 DEGs and the KEGG pathways.
Figure 3
Figure 3
ESTIMATE analysis of three immunity-related subtypes in the TCGA-LUSC samples based on ssGSEA scores. (A) Hierarchical clustering of TGCA-LUSC samples based on the ssGSEA scores generated by analyzing the expression levels of the immunity-related gene sets. The data shows three distinct LUSC subgroups: high immunity, medium immunity, and low immunity. (B) ESTIMATE analyses of tumor purity, stromal scores, and immune scores of the high, medium, and low immunity groups of LUSC patient samples. Histogram plot shows the ESTIMATE scores of the three LUSC subgroups (Mann–Whitney U test, p<0.001). (C) Histogram plot shows the stromal scores of the three LUSC subgroups (Mann–Whitney U test, p<0.001). (D) Histogram plot shows the immune scores of the three LUSC subtypes (Mann–Whitney U test, p<0.001). (E) Histogram plot shows the tumor purity levels of the three LUSC subgroups (Mann–Whitney U test, p<0.001). (F) Histogram plot shows the PD-L1 expression levels of the three LUSC subgroups (ANOVA test, p<0.001).(G) Kaplan-Meier survival curve analysis shows the overall survival times of the LUSC patients belonging to the three LUSC subgroups (log-rank test: P>0.05). (H) Histogram plot shows the expression levels of HLA genes of the three LUSC patient subgroups (ANOVA, P<0.05). (G) Histogram plot shows the TOX expression levels of the three LUSC subgroups (ANOVA, P<0.05). Note: Immunity_H denotes high immunity group; Immunity_M denotes medium immunity group; Immunity_L denotes low immunity group.
Figure 4
Figure 4
Functional enrichment analyses of DEGS in the high immunity subgroup of LUSC patient samples. (A) Gene set enrichment analysis (GSEA) results show the enriched GO terms and KEGG pathways in the high immunity subgroup of TGCA-LUSC samples. (B) The bubble plots show the enriched GO and KEGG pathways based on the analysis of upregulated genes in the high immunity subgroup of TGCA-LUSC samples.
Figure 5
Figure 5
Weighted gene correlation network analysis to identify key immunity-related gene modules in the TCGA-LUSC dataset and their correlation with the LUSC-related clinicopathological traits. (A) The clustering dendrograms of robust DEGs identified by the RRA analysis in the TCGA-LUSC samples. The color intensity varies according to the clinicopathological characteristics such as age, TNM grades, stage and smoking history (smoking packs per year), immune scores, tumor purity, stromal scores and immunity subtypes (high, medium or low immunity subgroups). The red color indicates biochemical recurrence and white indicates absence of biochemical recurrence. For gender, red color denotes female and white color denotes male. (B, C) Network topology analyses for various soft-thresholding powers. The left panel shows the scale-free fit index (y-axis) as a function of soft-thresholding power (x-axis). The right panel shows the mean connectivity (degree, y-axis) as a function of soft-thresholding power. (D) The clustering dendrogram of all DEGs with dissimilarity measures based on topological overlap measure (TOM) together with assigned module colors. The non-clustering DEGs are shown in gray. (E) The heatmap shows the correlation between module eigengenes and the clinicopathological traits of LUSC. Each column contains the corresponding correlation coefficient and P value.
Figure 6
Figure 6
Identification and functional annotation of the hub genes in the brown module. (A) Scatter plot of the gene significance (GS) versus the module membership (MM) of the 30 hub genes in the brown module. (B) Protein-protein interaction (PPI) network of the 30 hub genes in the brown module. (C) Coexpression network analysis including visualization of the module membership (nodes) and the gene-gene connections (edges) of the top 30 hub genes in the brown module using the Cytoscape version 3.4.0 software (D) Functional enrichment analysis results show the enriched GO terms and KEGG pathways related to the DEGs in the brown module.
Figure 7
Figure 7
Validation of the four hub genes in the TCGA-LUSC dataset. (A) The expression levels of LAPTM5, CSF1R, SLCO2B1 and C1QC mRNA in the TCGA-LUSC and adjacent normal lung tissue samples. (B) The expression levels of LAPTM5, CSF1R, SLCO2B1 and C1QC proteins in the LUSC and normal lung tissue samples based on the IHC data in The Human Protein Atlas database. (C) Correlation analysis of the mRNA expression levels of the 4 hub genes, LAPTM5, CSF1R, SLCO2B1 and C1QC in the LUSC tissues and the overall survival time of the TCGA-LUSC patients. The red line indicates TCGA-LUSC samples with high expression of the 4 hub genes (above the best-separation value, n=157), and the blue line denotes the TCGA-LUSC samples with low expression of the 4 hub genes (below best-separation value, n=209).
Figure 8
Figure 8
Identification of immunity-based molecular subtypes of LUSC patient samples based on the expression of the TOX pathway gene signature. (A) Clustering heat map shows the presence of two clusters among the TCGA-LUSC dataset based on the TOX pathway gene signature. (B) Kaplan–Meier survival curve analysis shows the differences in overall, survival times of cluster 1 and cluster 2 TCGA-LUSC patients. (C) The heatmap shows the expression of DEGs in the cluster 1 and cluster 2 TCGA-LUSC patients. (D) GSEA plot shows the upregulation of genes related to the exhausted CD8+ T cells in the cluster 2 TCGA-LUSC dataset compared to those in the cluster1 TCGA-LUSC dataset. The upregulated genes linked to the exhaustion of CD8+ T cells are shown on the left. Note: NES: normalized enrichment score. (E) Venn diagram shows the numbers of cluster 1 (n=36) and cluster 2 (n=110) molecular subtypes among the high immunity LUSC subgroup (n=146). (F) The histogram plots show the mRNA expression levels of LAPTM5, CSF1R, SLCO2B1 and C1QC in the cluster 1 and cluster 2 LUSC samples. (G) ROC curve analysis shows the sensitivity and accuracy of the 4 hub genes, LAPTM5, CSF1R, SLCO2B1 and C1QC to distinguish cluster 1 and cluster 2 samples based on their expression. The area under the ROC curve (AUC) values demonstrates that all 4 hub genes show high sensitivity and accuracy in distinguishing the LUSC patients belonging to the two clusters. Note: Immunity-High denotes high immunity group; Immunity-Middle denotes medium immunity group; Immunity-Low denotes low immunity group.
Figure 9
Figure 9
Gene set enrichment analysis (GSEA) and gene set variation analysis (GSVA) of hub genes in the TCGA-LUSC dataset. (A) The plot shows the enriched GO terms based on the GSEA enrichment score in the TCGA-LUSC patients with high expression of each of the four hub genes, LAPTM5, CSF1R, SLCO2B1 and C1QC. (B) The plot shows the enriched KEGG pathways based on the GSEA enrichment score in the TCGA-LUSC patients with high expression of each of the four hub genes, LAPTM5, CSF1R, SLCO2B1 and C1QC. (C) GSVA-derived clustering heatmaps show the enriched GO terms for the LAPTM5, CSF1R, SLCO2B1 and C1QC in the TCGA-LUSC dataset. GO terms with log2 (foldchange) > 0.35 and adjusted P<0.05 are shown. (D) GSVA-derived clustering heatmaps show the enriched KEGG pathways for the LAPTM5, CSF1R, SLCO2B1 and C1QC in the TCGA-LUSC dataset. KEGG signaling pathways with log2 (foldchange) > 0.2 and adjusted P<0.05 are shown.
Figure 10
Figure 10
The expression of the four hub genes is associated with differential infiltration of immune cells into the LUSC tissues. (AD) CIBERSORT analysis shows the association between infiltration of 22 immune cell types into the LUSC tissues and the expression levels of (A) C1QC (B) CSF1R (C) LAPTM5 and (D) SLCO2B1 genes. The LUSC patients were ranked into high, medium and low hub gene expression groups based on the levels of expression of each of the four hub genes, C1QC, CSF1R, LAPTM5 and SLCO2B1. The red, blue, and green histograms indicate high, medium and low expression levels of the corresponding hub genes. The correlations between the groups were analyzed using Mann–Whitney U test.

Similar articles

Cited by

References

    1. Torre LA, Bray F, Siegel RL, Ferlay J, Lortet-Tieulent J, Jemal A. Global cancer statistics, 2012. CA Cancer J Clin. 2015; 65:87–108. 10.3322/caac.21262 - DOI - PubMed
    1. Ferlay J, Soerjomataram I, Dikshit R, Eser S, Mathers C, Rebelo M, Parkin DM, Forman D, Bray F. Cancer incidence and mortality worldwide: sources, methods and major patterns in GLOBOCAN 2012. Int J Cancer. 2015; 136:E359–86. 10.1002/ijc.29210 - DOI - PubMed
    1. Lambert AA, Dransfield MT. COPD overlap syndromes: asthma and beyond. Chronic Obstr Pulm Dis. 2016; 3:459–65. 10.15326/jcopdf.3.1.2015.0176 - DOI - PMC - PubMed
    1. Hirsch FR, Scagliotti GV, Mulshine JL, Kwon R, Curran WJ Jr, Wu YL, Paz-Ares L. Lung cancer: current therapies and new targeted treatments. Lancet. 2017; 389:299–311. 10.1016/S0140-6736(16)30958-8 - DOI - PubMed
    1. Kulasingam V, Diamandis EP. Strategies for discovering novel cancer biomarkers through utilization of emerging technologies. Nat Clin Pract Oncol. 2008; 5:588–99. 10.1038/ncponc1187 - DOI - PubMed

Publication types

MeSH terms

Substances