Population structure of indigenous inhabitants of Arabia
- PMID: 33428619
- PMCID: PMC7799765
- DOI: 10.1371/journal.pgen.1009210
Population structure of indigenous inhabitants of Arabia
Abstract
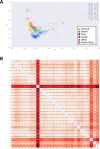
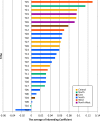
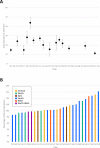
Modern day Saudi Arabia occupies the majority of historical Arabia, which may have contributed to ancient waves of migration out of Africa. This ancient history has left a lasting imprint in the genetics of the region, including the diverse set of tribes that call Saudi Arabia their home. How these tribes relate to each other and to the world's major populations remains an unanswered question. In an attempt to improve our understanding of the population structure of Saudi Arabia, we conducted genomic profiling of 957 unrelated individuals who self-identify with 28 large tribes in Saudi Arabia. Consistent with the tradition of intra-tribal unions, the subjects showed strong clustering along tribal lines with the distance between clusters correlating with their geographical proximities in Arabia. However, these individuals form a unique cluster when compared to the world's major populations. The ancient origin of these tribal affiliations is supported by analyses that revealed little evidence of ancestral origin from within the 28 tribes. Our results disclose a granular map of population structure and have important implications for future genetic studies into Mendelian and common diseases in the region.
Conflict of interest statement
The authors have declared that no competing interests exist.
Figures


Similar articles
-
Indigenous Arabs have an intermediate frequency of a Neanderthal-derived COVID-19 risk haplotype compared with other world populations.Clin Genet. 2021 Mar;99(3):484-485. doi: 10.1111/cge.13885. Epub 2020 Nov 27. Clin Genet. 2021. PMID: 33245148 Free PMC article.
-
Extensive geographical and social structure in the paternal lineages of Saudi Arabia revealed by analysis of 27 Y-STRs.Forensic Sci Int Genet. 2018 Mar;33:98-105. doi: 10.1016/j.fsigen.2017.11.015. Epub 2017 Dec 2. Forensic Sci Int Genet. 2018. PMID: 29220824
-
Polymorphic Alu Insertion/Deletion in Different Caste and Tribal Populations from South India.PLoS One. 2016 Jun 17;11(6):e0157468. doi: 10.1371/journal.pone.0157468. eCollection 2016. PLoS One. 2016. PMID: 27315142 Free PMC article.
-
The Arab genome: Health and wealth.Gene. 2016 Nov 5;592(2):239-43. doi: 10.1016/j.gene.2016.07.007. Epub 2016 Jul 5. Gene. 2016. PMID: 27393651 Review.
-
Dengue fever in Saudi Arabia: A review of environmental and population factors impacting emergence and spread.Travel Med Infect Dis. 2019 Jul-Aug;30:46-53. doi: 10.1016/j.tmaid.2019.04.006. Epub 2019 Apr 10. Travel Med Infect Dis. 2019. PMID: 30978417 Review.
Cited by
-
Patterns of population structure and genetic variation within the Saudi Arabian population.bioRxiv [Preprint]. 2025 Jan 13:2025.01.10.632500. doi: 10.1101/2025.01.10.632500. bioRxiv. 2025. PMID: 39868174 Free PMC article. Preprint.
-
Familial thrombocythaemia - a distinct entity from essential thrombocythaemia.Br J Haematol. 2021 Sep;194(5):808-809. doi: 10.1111/bjh.17701. Epub 2021 Aug 2. Br J Haematol. 2021. PMID: 34340263 Free PMC article. No abstract available.
-
Pragmatic Approach to Applying Polygenic Risk Scores to Diverse Populations.Curr Protoc. 2023 Nov;3(11):e911. doi: 10.1002/cpz1.911. Curr Protoc. 2023. PMID: 37921506 Free PMC article.
-
A reference quality, fully annotated diploid genome from a Saudi individual.Sci Data. 2024 Nov 23;11(1):1278. doi: 10.1038/s41597-024-04121-2. Sci Data. 2024. PMID: 39580486 Free PMC article.
-
Near-complete Middle Eastern genomes refine autozygosity and enhance disease-causing and population-specific variant discovery.Nat Genet. 2025 May;57(5):1119-1131. doi: 10.1038/s41588-025-02173-7. Epub 2025 May 5. Nat Genet. 2025. PMID: 40325133 Free PMC article.
References
Publication types
MeSH terms
LinkOut - more resources
Full Text Sources
Other Literature Sources
Miscellaneous

