. 2021 Jan 11;16(1):e0243559.
doi: 10.1371/journal.pone.0243559. eCollection 2021.

The spatiality and driving forces of population ageing in China

Affiliations

The spatiality and driving forces of population ageing in China

Lianxia Wu et al. PLoS One. .

Abstract

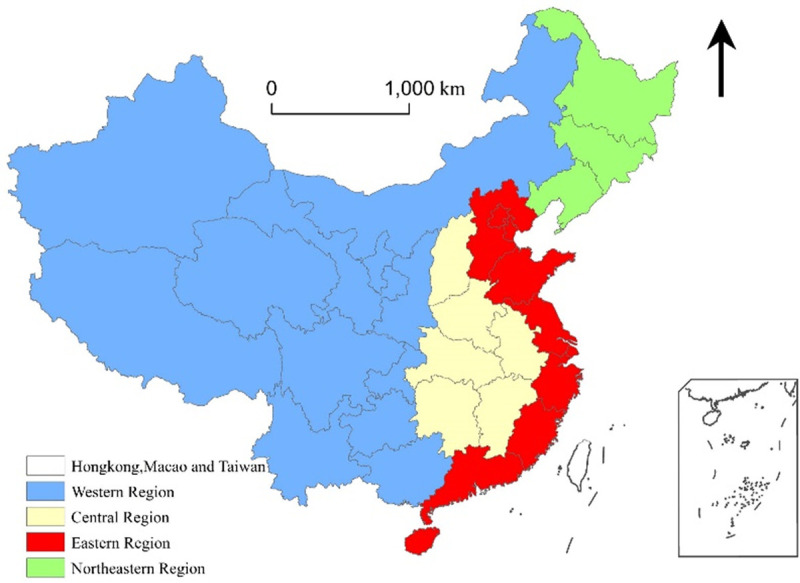
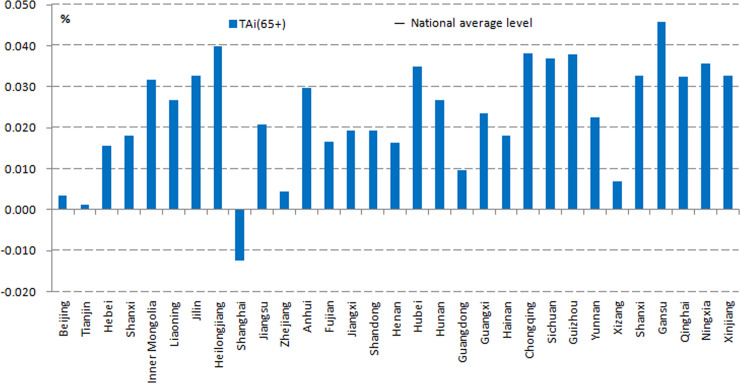
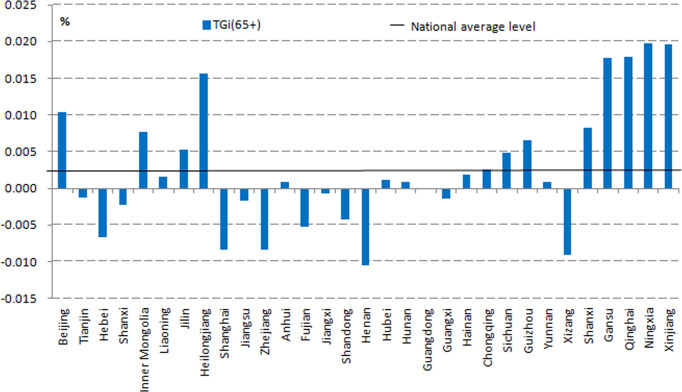
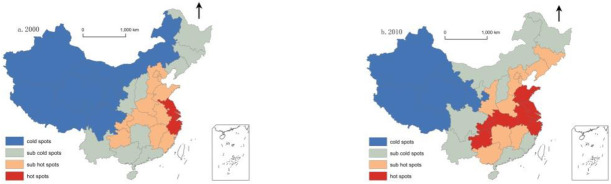
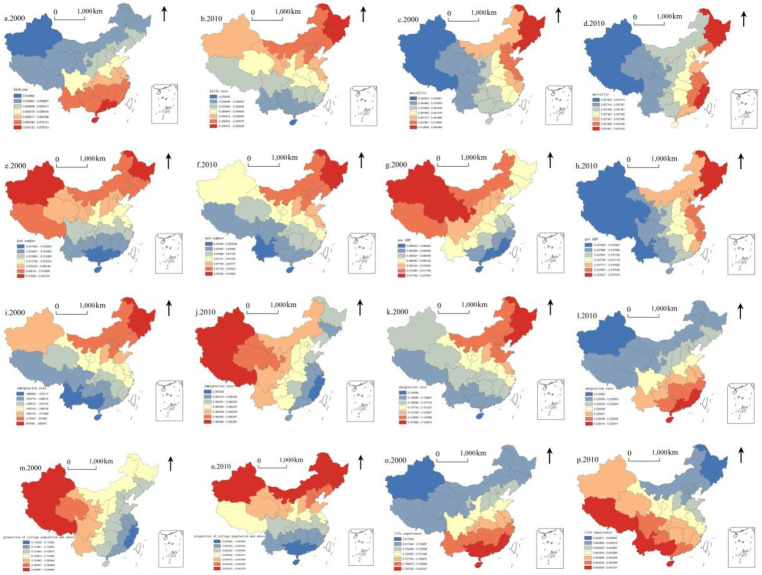
Studying the spatial characteristics of China's ageing and its influencing factors is of great practical significance because China has the largest elderly population in the world. Using 2000 and 2010 census data, this study explores the degree, pace, and pattern of population ageing and its driving mechanism using exploratory spatial data analysis and the geographically weighed regression model. Between 2000 and 2010, population ageing increased rapidly countrywide; yet, spatial differences between eastern and western China narrowed. The degree of provincial population ageing and its spatiality were determined by natural population growth, migration, and local economic development. Life expectancy and mortality were the primary long-term factors, and GDP per capita was the prime contributor in the early days of economic development; the migration rate was the dominant influence after 2010. China's overall spatial differentiation of population ageing shifted from a north-south to an east-west division.


Conflict of interest statement

The authors have declared that no competing interests exist.

Figures

Fig 1
Fig 1. The division of regions in China.
Source: This figure was drawn using GIS software.
Fig 2
Fig 2. The provincial old age concentration rate during 2000–2010.
Source: Census Office of the State Council, (2000). Population census of the People’s Republic of China. Beijing: China Statistics Press; Census Office of the State Council, (2010). Population census of the People’s Republic of China. Beijing: China Statistics Press.
Fig 3
Fig 3. The differences in geographical old age concentration rate during 2000–2010.
Source: Census Office of the State Council, (2000). Population census of the People’s Republic of China. Beijing: China Statistics Press; Census Office of the State Council, (2010). Population census of the People’s Republic of China. Beijing: China Statistics Press.
Fig 4
Fig 4. Cold–hot spots analysis on aging (2000–2010).
Source: This figure was drawn using GIS software; Census Office of the State Council, (2000). Population census of the People’s Republic of China. Beijing: China Statistics Press; Census Office of the State Council, (2010). Population census of the People’s Republic of China. Beijing: China Statistics Press.
Fig 5
Fig 5. Spatial distribution of regression coefficients based on the GWR model in 2000 and 2010.
A, c, e, g, i, k, m, and o = birth rate, mortality rate, number of beds in medical and health institutions, GDP per capita, in-migration rate, out-migration rate, the proportion of college population and above, and life expectancy, respectively, in 2000. B, d, f, h, j, l, n, and p = birth rate, mortality rate, number of beds in medical and health institutions, GDP per capita, in-migration rate, out-migration rate, the proportion of college population and above, and life expectancy, respectively, in 2010. Sources: (1) Census Office of the State Council. (2000). Population census of the People’s Republic of China. Beijing: China Statistics Press; Census Office of the State Council. (2010). Population census of the People’s Republic of China. Beijing: China Statistics Press. (2) National Bureau of Statistics of China. (2001). China statistical yearbook. Beijing: China Statistics Press; National Bureau of Statistics of China. (2011). China statistical yearbook. Beijing: China Statistics Press.

References

    1. Hahn W. A. (1992). Aging America. Ann Am Acad Polit Soc Sci, 522(1), 116–129.
    1. Lee R. (2011). The outlook for population growth. Science, 333(6042), 569–573. 10.1126/science.1208859 - DOI - PMC - PubMed
    1. Holzmann B. (2013). Antiinflammatory activities of CGRP modulating innate immune responses in health and disease. Curr Protein Pept Sci, 14(4), 268–274. 10.2174/13892037113149990046 - DOI - PubMed
    1. Cai F., & Wang M. Y. (2006). Challenge facing China’s economic growth in its aging but not affluent era. China World Econ, 14(5), 20–31.
    1. Visaria P. (2001). Demographics of ageing in India. Econ Polit Wkly, 36(22), 1967–1975.

Publication types