

Comparative genomics of ESBL-producing Escherichia coli (ESBL-Ec) reveals a similar distribution of the 10 most prevalent ESBL-Ec clones and ESBL genes among human community faecal and extra-intestinal infection isolates in the Netherlands (2014-17)
- PMID: 33428729
- PMCID: PMC7953314
- DOI: 10.1093/jac/dkaa534
Comparative genomics of ESBL-producing Escherichia coli (ESBL-Ec) reveals a similar distribution of the 10 most prevalent ESBL-Ec clones and ESBL genes among human community faecal and extra-intestinal infection isolates in the Netherlands (2014-17)
Abstract
Introduction: The human gut microbiota is an important reservoir of ESBL-producing Escherichia coli (ESBL-Ec). Community surveillance studies of ESBL-Ec to monitor circulating clones and ESBL genes are logistically challenging and costly.
Objectives: To evaluate if isolates obtained in routine clinical practice can be used as an alternative to monitor the distribution of clones and ESBL genes circulating in the community.
Methods: WGS was performed on 451 Dutch ESBL-Ec isolates (2014-17), including 162 community faeces and 289 urine and blood isolates. We compared proportions of 10 most frequently identified STs, PopPUNK-based sequence clusters (SCs) and ESBL gene subtypes and the degree of similarity using Czekanowski's proportional similarity index (PSI).
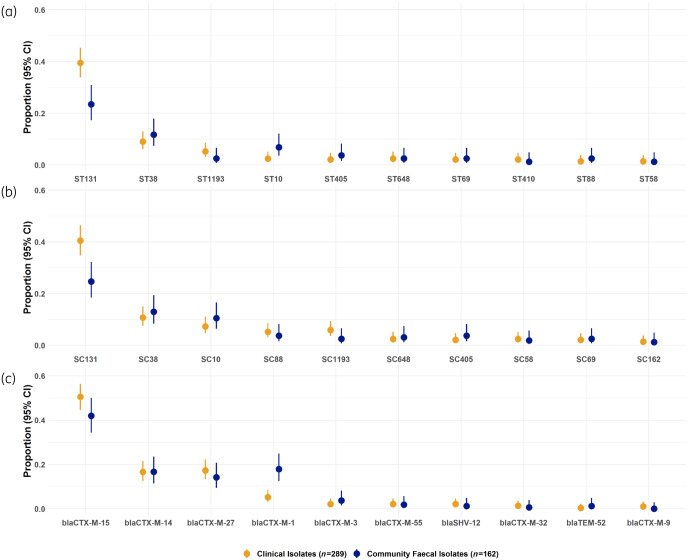
Results: Nine out of 10 most prevalent STs and SCs and 8/10 most prevalent ESBL genes in clinical ESBL-Ec were also the most common types in community faeces. The proportions of ST131 (39% versus 23%) and SC131 (40% versus 25%) were higher in clinical isolates than in community faeces (P < 0.01). Within ST131, H30Rx (C2) subclade was more prevalent among clinical isolates (55% versus 26%, P < 0.01). The proportion of ESBL gene blaCTX-M-1 was lower in clinical isolates (5% versus 18%, P < 0.01). Czekanowski's PSI confirmed that the differences in ESBL-Ec from community faeces and clinical isolates were limited.
Conclusions: Distributions of the 10 most prevalent clones and ESBL genes from ESBL-Ec community gut colonization and extra-intestinal infection overlapped in majority, indicating that isolates from routine clinical practice could be used to monitor ESBL-Ec clones and ESBL genes in the community.
© The Author(s) 2021. Published by Oxford University Press on behalf of the British Society for Antimicrobial Chemotherapy.
Figures


References
-
- PHE 2019. Annual epidemiological commentary: bacteraemia, MSSA bacteraemia and C. difficile infections, up to and including financial year April 2018 to March 2019. https://assets.publishing.service.gov.uk/government/uploads/system/uploa....
-
- ECDC 2019. Surveillance of antimicrobial resistance in Europe 2018. https://www.ecdc.europa.eu/sites/default/files/documents/surveillance-an....
-
- Coque TM, Baquero F, Canton R.. Increasing prevalence of ESBL-producing Enterobacteriaceae in Europe. Euro Surveill 2008; 13: pii=19044. - PubMed
-
- Rodríguez-Baño J, López-Cerero L, Navarro MD. et al. Faecal carriage of extended-spectrum β-lactamase-producing Escherichia coli: prevalence, risk factors and molecular epidemiology. J Antimicrob Chemother 2008; 62: 1142–9. - PubMed
Publication types
MeSH terms
Substances
LinkOut - more resources
Full Text Sources
Other Literature Sources
Medical
Miscellaneous
