

SLC6A20 transporter: a novel regulator of brain glycine homeostasis and NMDAR function
- PMID: 33428810
- PMCID: PMC7863395
- DOI: 10.15252/emmm.202012632
SLC6A20 transporter: a novel regulator of brain glycine homeostasis and NMDAR function
Erratum in
-
Author Correction: SLC6A20 transporter: a novel regulator of brain glycine homeostasis and NMDAR function.EMBO Mol Med. 2024 Oct;16(10):2653. doi: 10.1038/s44321-024-00125-y. EMBO Mol Med. 2024. PMID: 39242973 Free PMC article.
Abstract
Glycine transporters (GlyT1 and GlyT2) that regulate levels of brain glycine, an inhibitory neurotransmitter with co-agonist activity for NMDA receptors (NMDARs), have been considered to be important targets for the treatment of brain disorders with suppressed NMDAR function such as schizophrenia. However, it remains unclear whether other amino acid transporters expressed in the brain can also regulate brain glycine levels and NMDAR function. Here, we report that SLC6A20A, an amino acid transporter known to transport proline based on in vitro data but is understudied in the brain, regulates proline and glycine levels and NMDAR function in the mouse brain. SLC6A20A transcript and protein levels were abnormally increased in mice carrying a mutant PTEN protein lacking the C terminus through enhanced β-catenin binding to the Slc6a20a gene. These mice displayed reduced extracellular levels of brain proline and glycine and decreased NMDAR currents. Elevating glycine levels back to normal ranges by antisense oligonucleotide-induced SLC6A20 knockdown, or the competitive GlyT1 antagonist sarcosine, normalized NMDAR currents and repetitive climbing behavior observed in these mice. Conversely, mice lacking SLC6A20A displayed increased extracellular glycine levels and NMDAR currents. Lastly, both mouse and human SLC6A20 proteins mediated proline and glycine transports, and SLC6A20 proteins could be detected in human neurons. These results suggest that SLC6A20 regulates proline and glycine homeostasis in the brain and that SLC6A20 inhibition has therapeutic potential for brain disorders involving NMDAR hypofunction.
Keywords: NMDA receptor; PTEN; Slc6a20; glycine transporter; neuropsychiatric disorders.
© 2021 The Authors. Published under the terms of the CC BY 4.0 license.
Conflict of interest statement
The authors declare that they have no conflict of interest.
Figures
- A
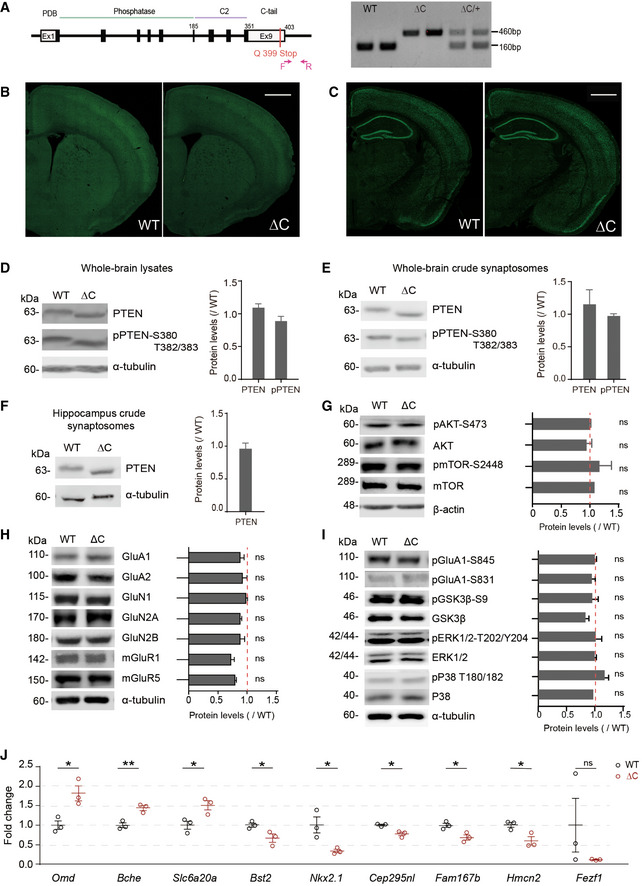
Schematic depiction of the generation of PtenΔC / ΔC (ΔC) mice, and PCR genotyping of WT, PtenΔC / ΔC and PtenΔC /+ (denoted as WT, ΔC, ΔC/+) mice.
- B, C
Normal gross morphology of the brain in PtenΔC / ΔC mice (P21), as revealed by staining for NeuN (a neuronal maker) in coronal sections. Scale bar, 1 mm.
- D–F
Immunoblot analysis of the levels of total PTEN and phospho‐PTEN (pPTEN) proteins in whole‐brain total lysates (D; P21), whole‐brain crude synaptosomes (E, P21), and hippocampal crude synaptosomes (F, P21). Average values and ΔC/WT ratios were calculated using PTEN/pPTEN signals in WT and PtenΔC / ΔC mice normalized to those of α‐tubulin. (n = 4 mice for WT and 3 for ΔC for whole‐brain lysates (D), 4 for both WT and ΔC for whole‐brain crude synaptosomes (E), and WT 5 and ΔC 8 for hippocampus lysates (F); ns, not significant, Student's t‐test). See Appendix Fig S7 for full‐length blot images. The error bars represent SEM.
- G
Total and phosphorylation levels of AKT and mTOR. Average values and ΔC/WT ratios were obtained from signals normalized to β‐actin. (n = 4 mice for WT and ΔC, ns, not significant, Student's t‐test). The error bars represent SEM.
- H, I
Levels of synaptic glutamate receptors (GluNs, GluAs, and mGluRs) and synaptic plasticity‐related signaling proteins (total/phosphorylated GluA1‐Ser831, GluA1‐Ser845, GSK3β, ERK1/2, and p38) in the brain (whole‐brain crude synaptosomes) of PtenΔC / ΔC and WT mice (P21). Average values and ΔC/WT ratios were obtained from signals normalized to α‐tubulin. (n = 4 mice for WT and ΔC, ns, not significant, Student's t‐test). The error bars represent SEM.
- J
RT–qPCR validation of the nine DEGs in PtenΔC / ΔC and WT mice (P21). Note that eight of the nine DEGs could be validated (n = 3 mice for WT and ΔC, *P < 0.05, **P < 0.01, ns, not significant, Student's t‐test). The error bars represent SEM.
- A, B
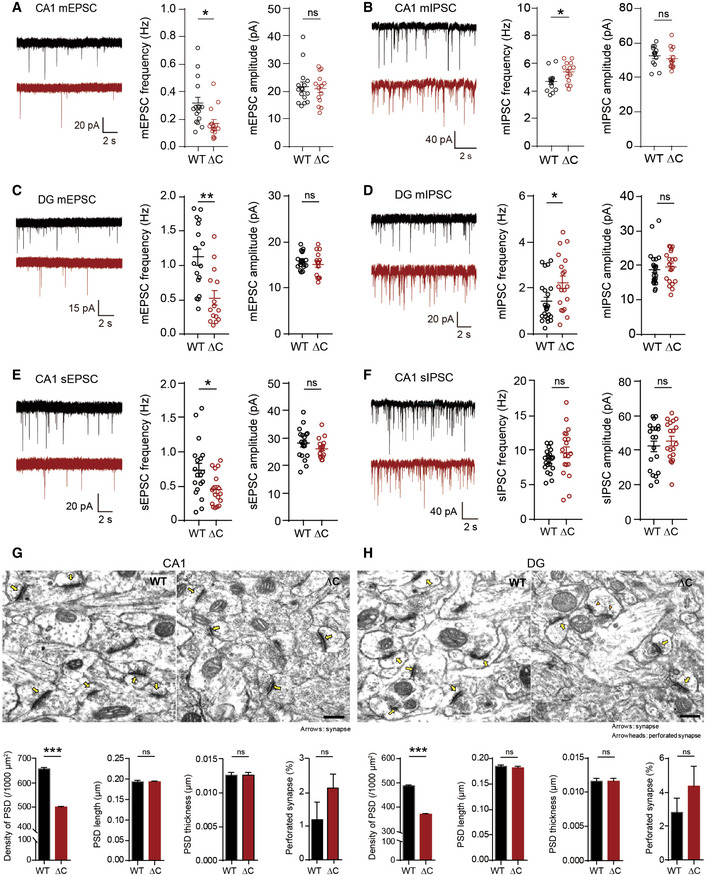
Reduced frequency of mEPSCs (A) and increased frequency of mIPSCs (B) in CA1 pyramidal cells in the hippocampus of PtenΔC / ΔC mice (P17–21 for mEPSCs; P18–21 for mIPSCs). Data represent mean + SEM (mEPSC, n = 15 neurons from three mice for WT and 14 (3) for ΔC; mIPSC, 13 (4) for WT, and 14 (4) for ΔC; *P < 0.05, ns, not significant, Student's t‐test and Mann–Whitney U‐test; See Appendix Table S1 for details).
- C, D
Reduced frequency of mEPSCs (C) and increased frequency of mIPSCs (D) in DG granule cells in the hippocampus of PtenΔC / ΔC mice (P18–19 for mEPSCs; P18–23 for mIPSCs). (mEPSC, n = 17 (3) for WT and 14 (3) for ΔC; mIPSC, 23 (5) for WT and 19 (5) for ΔC; *P < 0.05, **P < 0.01, ns, not significant, Student's t‐test and Mann–Whitney U‐test). The error bars represent SEM.
- E, F
Reduced frequency of sEPSCs (E), but normal sIPSCs (F), in CA1 pyramidal neurons in the hippocampus of PtenΔC / ΔC mice (P17–19 for sEPSCs; P17–21 for sIPSCs). (sEPSC, n = 19 (4) for WT and 17 (4) for ΔC; sIPSC, 20 (4) for WT and 19 (4) for ΔC; *P < 0.05, ns, not significant, Student's t‐test and Mann–Whitney U‐test). The error bars represent SEM.
- G, H
Decreased density of excitatory synapses in the hippocampal CA1 and DG regions of PtenΔC / ΔC mice. (G), CA1 stratum radiatum; (H), DG molecular layer. Excitatory synapses are defined by sites where PSDs are in contact with presynaptic vesicles. Normal and perforated PSDs are indicated by arrows and arrowheads, respectively. (n = 3 mice for WT and ΔC, ***P < 0.001, ns, not significant, Student's t‐test). Scale bar, 200 nm. The error bars represent SEM.
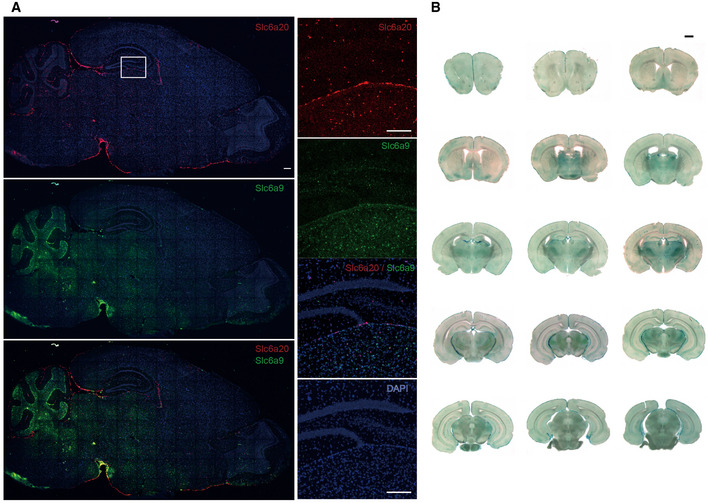
Widespread expression of Slc6a20 mRNA in various mouse brain regions (P56), including the meninges, cortex, hippocampus, choroid plexus, and thalamus, revealed by double fluorescence in situ hybridization (FISH). Slc6a9 mRNA, encoding GlyT1, was also detected together with Slc6a20 mRNA for comparison. Note that Slc6a20 mRNA shows partial colocalization with Slc6a9 mRNA. Scale bar, 100 µm.
Widespread expression of SLC6A20 β‐gal fusion protein in various brain regions (P56), including the meninges, cortex, hippocampus, choroid plexus, and thalamus, as revealed by X‐gal staining of brain sections from Slc6a20a +/− mice. Scale bar, 1 mm.
- A–C
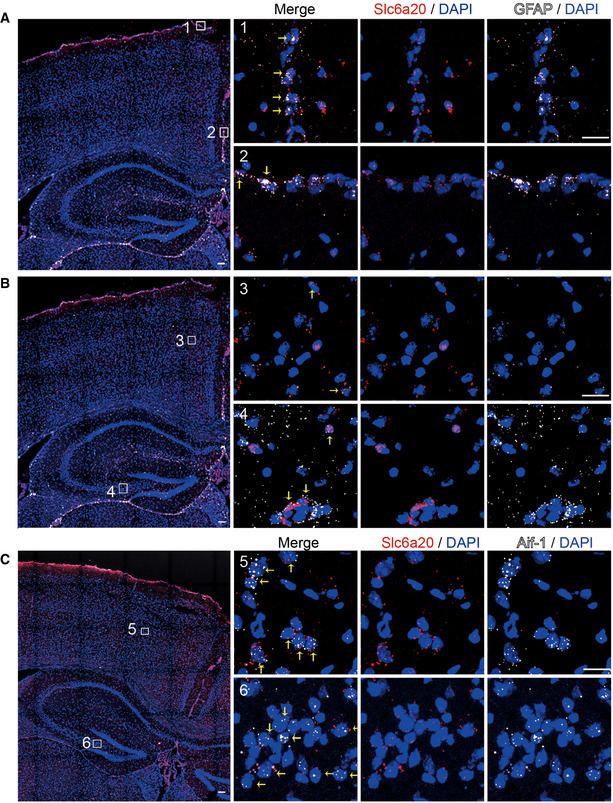
Expression of Slc6a20 mRNA in meninges (A), astrocytes (B), and microglia (C) in the mouse brain (P56), revealed by double FISH. GFAP and Aif‐1 were used as markers of astrocytes and microglia, respectively. Note that the panels A and B use the same original image to highlight different brain regions. Scale bar, 100 µm. Colocalization of Slc6a20 mRNA signals with cell markers are indicated by yellow arrows.
- A, B
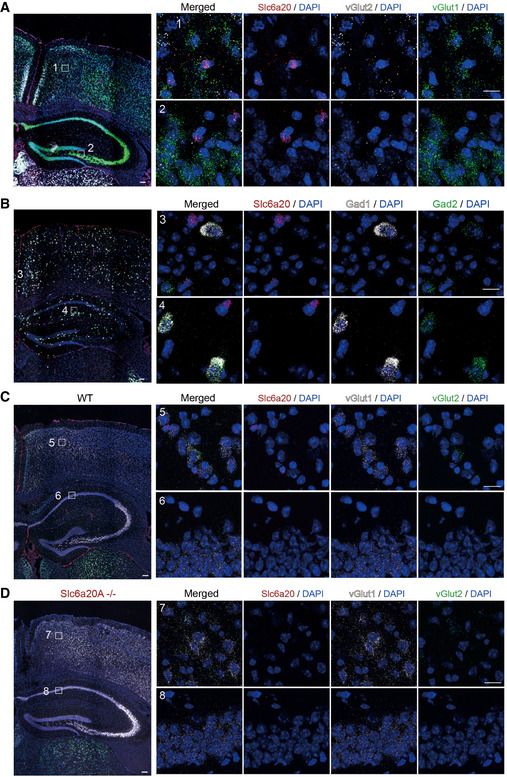
Modest and minimal expressions of Slc6a20 mRNAs in Vglut1/2‐positive glutamatergic neurons (A) and Gad1/2‐positive GABAergic neurons (B), respectively, in the mouse brain (P56), revealed by double FISH. Scale bar, 100 µm.
- C, D
Demonstration of the specificity of Slc6a20 mRNA signals by parallel double FISH experiments on WT (C) and Slc6a20a −/− (D) mice. Vglut1/2 and DAPI were used as controls. The residual Slc6a20 mRNA signals in the panel (D), which are much weaker than those in the panel (C), may represent Slc6a20b (not Slc6a20a) mRNA signals. Scale bar, 100 µm.
- A
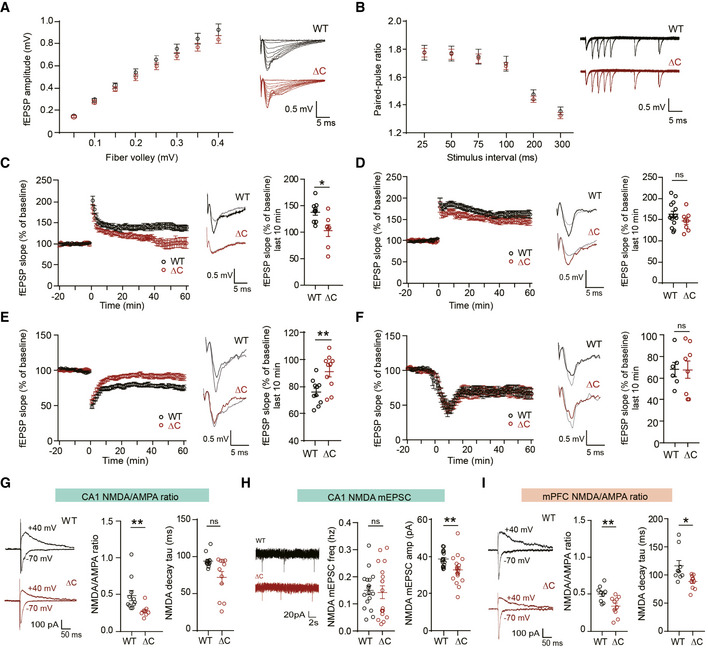
Normal basal excitatory synaptic transmission at SC‐CA1 synapses of PtenΔC / ΔC mice (4–5 weeks), indicated by the input–output curve of the amplitudes of field excitatory postsynaptic potentials (fEPSPs) plotted against stimulus intensities. (n = 10 slices from four mice for WT and nine (4) for ΔC, genotype P = 0.8378, two‐way repeated measures ANOVA with Bonferroni's multiple comparison test). The error bars represent Standard error of the mean SEM (see Appendix Table S1 “Statistics” for full details.
- B
Normal paired‐pulse facilitation at SC‐CA1 synapses of PtenΔC / ΔC mice (4–5 weeks), indicated by fEPSP slope ratios plotted against inter‐stimulus intervals. (n = 11 slices from four mice for WT and 11 (4) for ΔC, genotype P = 0.7376, two‐way repeated measures ANOVA with Bonferroni's test). The error bars represent SEM.
- C, D
Suppressed HFS‐LTP and normal TBS‐LTP at SC‐CA1 synapses of PtenΔC / ΔC mice (4–6 weeks). The gray traces represent baseline fEPSP prior to LTP induction. The error bars represent SEM. (n = 9 slices from six mice for WT and seven (6) for ΔC for HFS‐LTP, and 14 (9) for WT and eight (5) for ΔC for TBS‐LTP, *P < 0.05, ns, not significant, Mann–Whitney U‐test and Student's t‐test).
- E
Suppressed LFS‐LTD at SC‐CA1 synapses of PtenΔC / ΔC mice (P17–21). (n = 10 slices from six mice for WT and ΔC, **P < 0.01, Student's t‐test). The gray traces represent baseline fEPSP prior to LTD induction. The error bars represent SEM.
- F
Normal mGluR‐LTD at SC‐CA1 synapses of PtenΔC / ΔC mice (P17–21). (n = 6 slices from five mice for WT and eight (5) for ΔC, ns, not significant, Mann–Whitney U‐test). The gray traces represent baseline fEPSP prior to LTD induction. The error bars represent SEM.
- G
Reduced NMDA/AMPA ratio at SC‐CA1 synapses of PtenΔC / ΔC mice (P17–21). The NMDAR component was obtained 60 ms after stimulation. (ratio, n = 11 cells from eight mice for WT and eight (8) for ΔC; decay, n = 12 cells from eight mice for WT and 11 (8) for ΔC, **P < 0.01, ns, not significant, Mann–Whitney U‐test). The error bars represent SEM.
- H
Reduced amplitude but not frequency of NMDA‐mEPSCs at PtenΔC / ΔC CA1 pyramidal neurons. (n = 17 cells from four mice for WT and 18 (4) for ΔC, **P < 0.01, ns, not significant, Mann–Whitney U‐test, Student's t‐test). The error bars represent SEM.
- I
Reduced NMDA/AMPA ratio at synapses in layer II/III pyramidal neurons in the prelimbic region of the mPFC of PtenΔC / ΔC mice (P20–21). The NMDAR component was obtained 60 ms after stimulation. (n = 9 cells from three mice for WT and 10 (3) for ΔC, *P < 0.05, **P < 0.01, Student's t‐test, Mann–Whitney U‐test). The error bars represent SEM.
- A
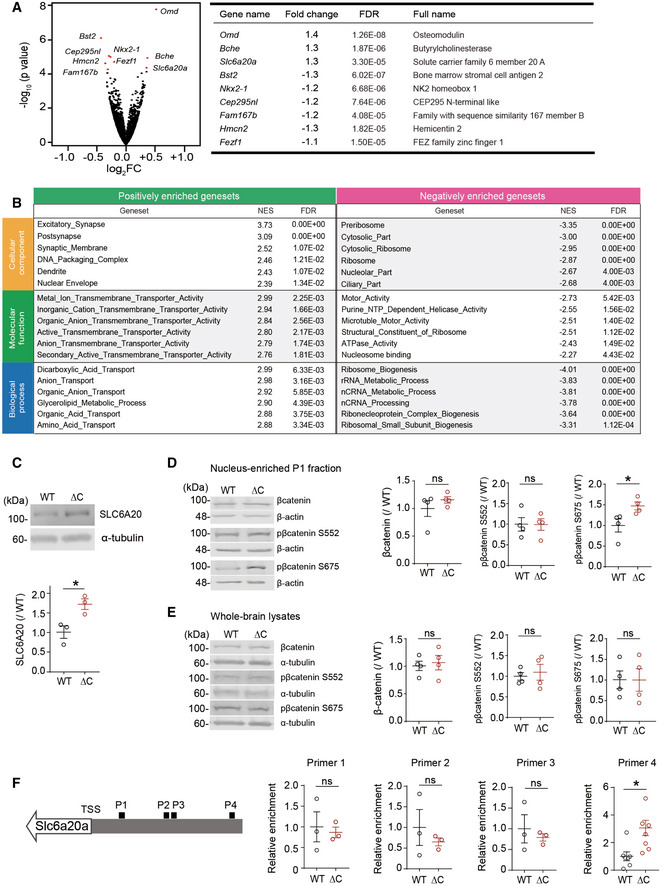
A volcano plot showing DEGs (adjusted P value < 0.1) derived from RNA‐Seq results for PtenΔC / ΔC and WT mice (P21). For the calculation of adjusted P value, we have employed the R package DESeq2 where the P‐values obtained by the Wald test are corrected for multiple testing using the Benjamini and Hochberg method. (n = 3 mice for WT and ΔC). See also Dataset EV1 for the full RNA‐Seq results.
- B
GSEA analysis of RNA‐Seq results from PtenΔC / ΔC and WT mice (P21). Transcripts ranked by levels of expression (ΔC/WT ratio) were tested for enrichment in precurated gene sets in the C5 (gene ontology) category. NES, normalized enrichment score; positive and negative enrichments indicate a greater contribution of up‐ and downregulated genes, respectively, to the enrichments (see also Dataset EV2 for the full GSEA results).
- C
Immunoblot validation of the increase in SLC6A20 protein levels in hippocampal lysates of PtenΔC / ΔC mice (P21). We denoted the antibody as “SLC6A20” here, not “SLC6A20A”, because this antibody was generated using a synthetic peptide sequence (YNEPSNNCQKHAI) that is commonly present in SLC6A20A and SLC6A20B, being a pan‐SLC6A20 antibody (Thermo Fisher). (n = 3 mice for WT and ΔC, *P < 0.05, Student's t‐test). The error bars represent SEM.
- D, E
Increased phosphorylation of β‐catenin at Ser‐675 but not at Ser‐552 in the nucleus‐enriched P1 fraction but not in whole‐brain lysates of PtenΔC / ΔC mice (3 months). Note that total levels of β‐catenin were not changed in the P1 fraction or whole‐brain lysates. (n = 4 mice for WT‐WB/P1 and ΔC‐WB/P1, *P < 0.05, ns, not significant, Student's t‐test). The error bars represent SEM.
- F
Increased binding of β‐catenin in the promoter region of the Slc6a20a gene in PtenΔC / ΔC mice (P21), revealed by chromatin immunoprecipitation (ChIP) assay. Note that β‐catenin binding was increased selectively in the target region for the primer set #4 indicated in the diagram. TSS, transcriptional start site; P1–4; promoter regions targeted by the four primer sets. (n = 7 mice for WT‐P4 and ΔC‐P4 and 3 mice for WT‐P1/2/3 and ΔC‐P1/2/3, *P < 0.05, ns, not significant, Student's t‐test). The error bars represent SEM.
- A
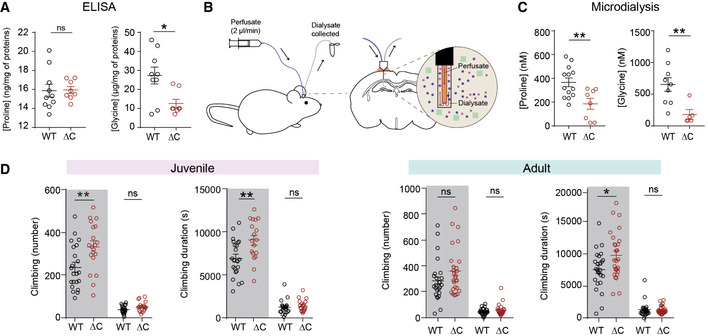
Normal proline but decreased whole‐brain glycine levels in the brains of PtenΔC / ΔC mice (P21), as determined by ELISA analysis of the S1 fraction, obtained after the removal of unbroken cells and large debris (see Materials and Methods for details). (proline, n = 10 mice for WT and 8 for ΔC, glycine, n = 9 mice for WT and eight for ΔC, *P < 0.05, ns, not significant, Student's t‐test). The error bars represent SEM.
- B, C
Decreased extracellular levels of proline and glycine in the brains of PtenΔC / ΔC mice (2–4 month), as determined by microdialysis in the hippocampus (see Materials and Methods for details). (proline, n = 13 mice for WT and 8 for ΔC, **P < 0.01, Student's t‐test; glycine, n = 9 for WT and 5 for ΔC, **P < 0.01, Student's t‐test, Mann–Whitney U‐test). The error bars represent SEM.
- D
Increased repetitive climbing in juvenile and adult PtenΔC / ΔC mice at P30 (juvenile) and 2–4 months (adult), as indicated by frequency and time spent climbing in Laboras cages, where mouse movements were continuously monitored for 72 h. Shaded and unshaded periods; 12‐h light‐off and light‐on periods over 72 h. (n = 22 mice for WT and 18 mice for ΔC for P30, and 25 for WT and 27 for ΔC for 2–4 months, *P < 0.05, **P < 0.01, ns, not significant, Mann–Whitney U‐test, Student's t‐test). The error bars represent SEM.
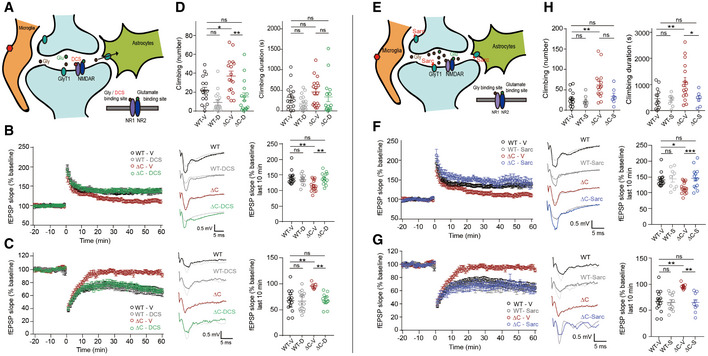
Schematic showing that DCS directly binds to the GluN1 subunit of NMDARs and activates NMDARs. Note that enhanced expression of SLC6A20 in PtenΔC / ΔC microglia and astrocytes surrounding the indicated synapse may decrease synaptic levels of glycine and suppress NMDAR function.
Normalization of NMDAR‐dependent HFS‐LTP at synapses of PtenΔC / ΔC mice (4–5 weeks) by DCS treatment (20 μM), as shown by fEPSP slopes. (n = 15 slices from nine mice for WT‐V/vehicle, 11 (5) for WT‐D/DCS, 16 (10) for ΔC‐V, 13 (7) for ΔC‐D, **P < 0.01, ns, not significant, two‐way ANOVA with Tukey's test). The gray traces represent the baseline fEPSP prior to LTP induction. The error bars represent SEM.
Normalization of NMDAR‐dependent LFS‐LTD at synapses of PtenΔC / ΔC mice (P17–22) by DCS treatment (10 μM), as shown by fEPSP slopes. (n = 14 slices from six mice for WT‐V, 13 (4) for WT‐D, seven (4) for ΔC‐V, 13 (3) for ΔC‐D, **P < 0.01, ns, not significant, two‐way ANOVA with Tukey's test). The gray traces represent baseline fEPSP prior to LTD induction. The error bars represent SEM.
Normalization of excessive climbing frequency (but not duration) by treatment of synapses in PtenΔC / ΔC mice (2–5 months) with DCS (20 mg/kg). (n = 17 mice for WT‐V, 17 for WT‐D, 16 for ΔC‐V, 16 for ΔC‐D, *P < 0.05, **P < 0.01, ns, not significant, two‐way ANOVA with Tukey's test). The error bars represent SEM.
Schematic showing that NMDAR activation can be induced indirectly through sarcosine‐dependent antagonization of GlyT1, a known glycine transporter, and resultant increases in glycine levels around the synapse.
Normalization of NMDAR‐dependent HFS‐LTP at synapses of PtenΔC / ΔC mice (4–5 weeks) by sarcosine treatment (750 µM), as shown by fEPSP slopes. Note that the data for WT‐V and ΔC‐V are identical to those shown in Fig 4B because the whole experiments were performed together; we generated independent figures for DCS and sarcosine results for the clear presentation of the data. (n = 15 slices from nine mice for WT‐V/vehicle, nine (4) for WT‐Sarc/Sarcosine, 16 (10) for ΔC‐V/Vehicle, 18 (4) for ΔC‐S, *P < 0.05, ***P < 0.001, ns, not significant, two‐way ANOVA with Tukey's test). The gray traces represent the baseline fEPSP prior to LTP induction. The error bars represent SEM.
Normalization of NMDAR‐dependent LFS‐LTD at synapses of PtenΔC / ΔC mice (16–21 days) by sarcosine treatment (750 µM), as shown by fEPSP slopes. Note that the data for WT‐V and ΔC‐V are identical to those shown in Fig 4C because the whole experiments were performed together; we generated independent figures for DCS and sarcosine results for the clear presentation of the data. (n = 14 slices from six mice for WT‐V, 11 (7) for WT‐Sarc, seven (4) for ΔC‐V, nine (6) for ΔC‐Sarc, **P < 0.01, ns, not significant, two‐way ANOVA with Tukey's multiple comparison). The gray traces represent baseline fEPSP prior to LTD induction. The error bars represent SEM.
Normalization of excessive climbing duration (but not frequency) by treatment of synapses of PtenΔC / ΔC mice (2–5 months) with sarcosine (100 mg/kg). (n = 14 mice for WT‐V, eight for WT‐S, 16 for ΔC‐V, seven for ΔC‐S, *P < 0.05, **P < 0.01, ns, not significant, two‐way ANOVA with Tukey's test).
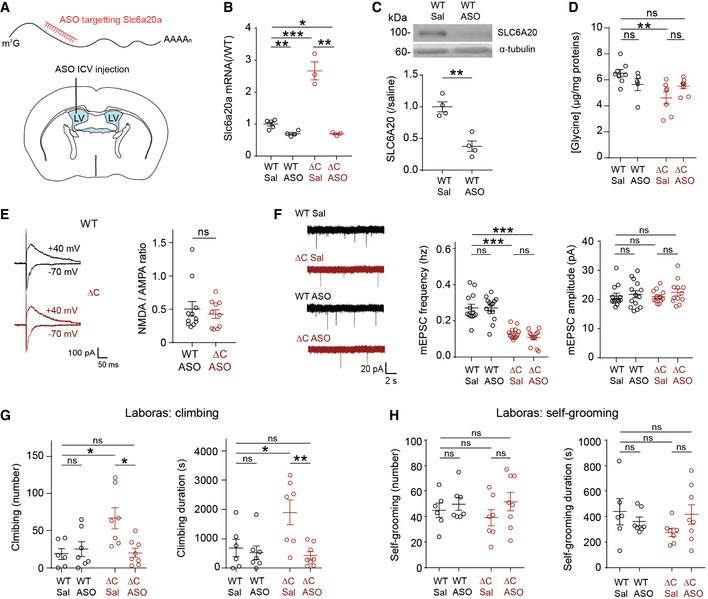
Schematic representation for the intracerebroventricular (ICV) injection of Slc6a20a antisense oligonucleotide (ASO) into the lateral ventricle (LV) for the reduction of Slc6a20a expression in the whole mouse brain.
Slc6a20a‐ASO decreases the levels of Slc6a20a mRNAs in the brain of WT and PtenΔC / ΔC mice (P20–32), as shown by qRT–PCR analysis performed 1–2 weeks after injection. (n = 5 mice for WT‐Sal/saline, four for WT‐ASO, three for ΔC‐Sal, and three for ΔC‐ASO, *P < 0.05, **P < 0.01, ***P < 0.001, Student's t‐test for each comparison). The error bars represent SEM.
Slc6a20a‐ASO decreases the levels of SLC6A20 proteins in the brain of WT mice (2–4 months), as shown by immunoblot analysis of whole‐brain lysates 6 days after injection. (n = 4 mice, **P < 0.01, Student's t‐test). The error bars represent SEM.
PtenΔC / ΔC mice (2–4 months) treated with Slc6a20a‐ASO display partially normalized levels of whole‐brain glycine, as shown by the lack of difference between saline‐treated WT and ASO‐treated PtenΔC / ΔC mice. Note that the glycine levels observed here are ~ 4 times lower than those measured in Fig 3A, which could be attributable to different mouse ages (P21 in Fig 3A vs. 2–4 months in Fig 5D), absence and presence of ASO injection, or lot‐to‐lot variation of the ELISA kits. (n = 8 mice for WT‐saline, five for WT‐ASO, seven for ΔC‐saline, and eight for ΔC‐ASO, **P < 0.01, ns, not significant, two‐way ANOVA with Tukey's test). The error bars represent SEM.
PtenΔC / ΔC mice (P20–37) treated with Slc6a20a‐ASO display an NMDA/AMPA ratio at hippocampal SC‐CA1 synapses that is comparable to that in ASO‐treated WT mice. (n = 11 neurons from five mice for WT‐ASO, 10 (4) for ΔC‐ASO, ns, not significant, Mann–Whitney U‐test). The error bars represent SEM.
PtenΔC / ΔC mice (P19–37) treated with Slc6a20a‐ASO display unaltered mEPSC frequency and amplitude in CA1 pyramidal neurons, as compared with ASO‐untreated PtenΔC / ΔC mice. Note that mEPSCs in WT mice are not affected by Slc6a20a‐ASO treatment. (n = 13 neurons from three mice for WT‐saline, 14 (2) for WT‐ASO, 14 (3) for ΔC‐saline, and 12 (3) for ΔC‐ASO, ***P < 0.001, ns, not significant, two‐way ANOVA with Bonferroni's test). The error bars represent SEM.
PtenΔC / ΔC mice (2–4 months) treated with Slc6a20a‐ASO display normal levels of climbing in the Laboras test. n = 6 mice for WT‐saline, seven for WT‐ASO, seven for ΔC‐saline, and eight for ΔC‐ASO, *P < 0.05, **P < 0.01, ns, not significant, two‐way ANOVA with Bonferroni's test. The error bars represent SEM.
Slc6a20a‐ASO treatment has no effect on the self‐grooming of PtenΔC / ΔC mice (2–4 months) in the Laboras test. (n = 6 mice for WT‐saline, seven for WT‐ASO, seven for ΔC‐saline, and eight for ΔC‐ASO, ns, not significant, two‐way ANOVA with Bonferroni's test). The error bars represent SEM.
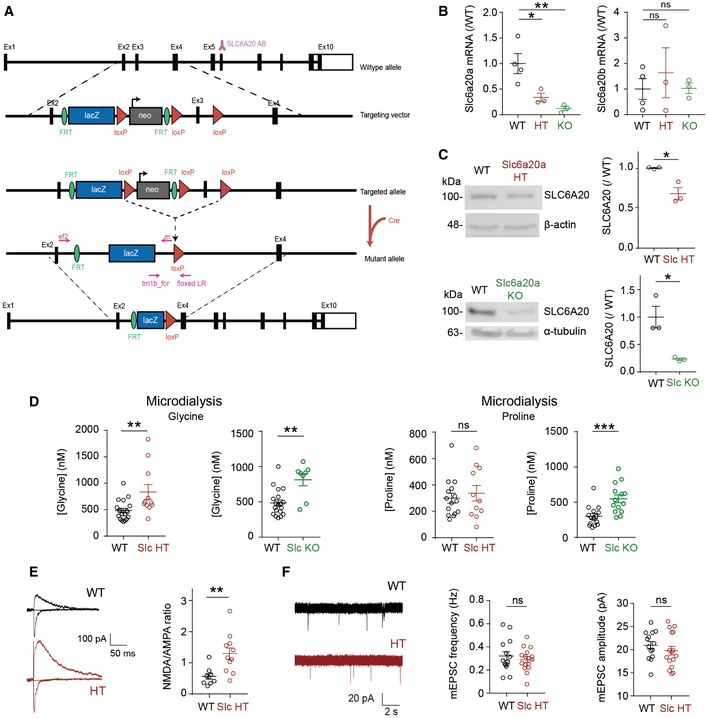
Schematic diagram showing the generation of Slc6a20a‐mutant mice. The SLC6A20 antibody is denoted by “Y” above exon (Ex) 6.
Decreased levels of Slc6a20a, but not Slc6a20b, mRNAs in the brain of Slc6a20a +/− (HT) and Slc6a20a −/− (KO) mice (P21–28), as shown by qRT–PCR analysis. (n = 4, 3, 3 mice for WT, HT, and KO; *P < 0.05, **P < 0.01, ns, not significant, one‐way ANOVA with Bonferroni's test). The error bars represent SEM.
Reduced expression of SLC6A20 proteins in the brains of Slc6a20a +/− and Slc6a20a −/− mice (P21 for HT and P24–28 for WT and KO), as indicated by immunoblot analysis of total brain lysates. β‐actin and α‐tubulin were used as loading controls. (n = 3 mice for WT, HT, and KO, *P < 0.05, Student's t‐test). The error bars represent SEM.
Increased extracellular levels of glycine and proline in the brain of Slc6a20a +/− and Slc6a20a −/− mice, as shown by microdialysis analyses. Note that glycine levels are increased in both Slc6a20a +/− and Slc6a20a −/− mice, whereas proline levels are increased only in Slc6a20a −/− mice. (glycine, n = 19 mice for WT, 11 for HT, 8 for KO, **P < 0.01, Mann–Whitney U‐test; proline, n = 15 mice for WT, 11 for HT, 14 for KO, ***P < 0.001, ns, not significant, Mann–Whitney U‐test). The error bars represent SEM.
Increased NMDA/AMPA ratio at hippocampal SC‐CA1 synapses in Slc6a20a +/− mice (P17–20), as indicated by the ratio of NMDAR EPSCs to AMPAR EPSCs. (n = 9 neurons from three mice for WT and 11 (4) for Slc6a20a HT mice, **P < 0.01, Mann–Whitney U‐test). The error bars represent SEM.
Normal frequency and amplitude of mEPSCs in hippocampal CA1 pyramidal cells in Slc6a20a +/− mice (P17–20). (mEPSC, n = 14 neurons from three mice for WT and 16 (3) for HT; ns, not significant, Student's t‐test). The error bars represent SEM.
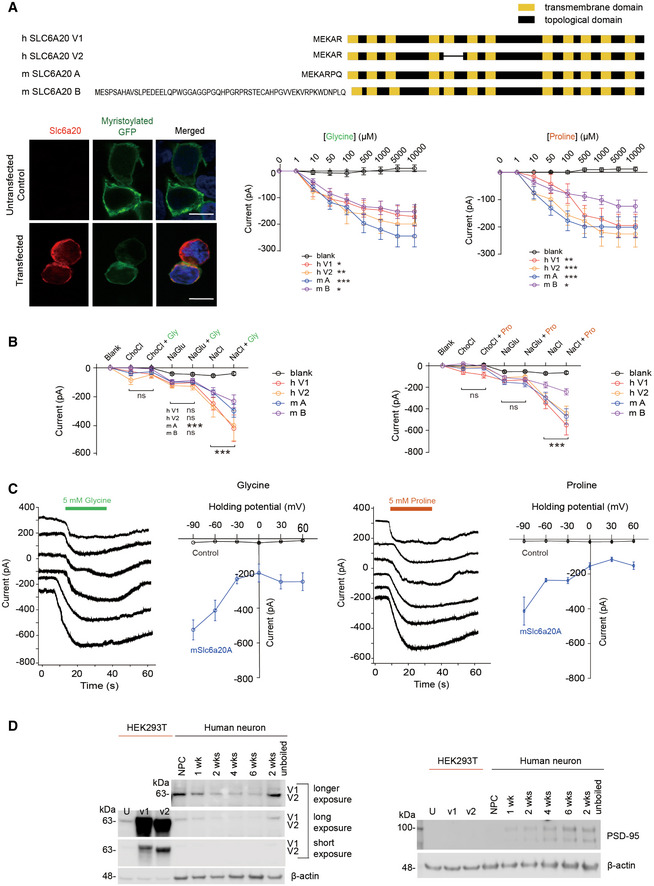
All four SLC6A20 protein variants (human SLC6A20 v1 and v2; mouse SLC6A20A and SLC6A20B; shown in schematic diagrams) mediate similar levels of glycine and proline transports. HEK293T cells expressing SLC6A20 protein variants were used to measure ensemble currents induced by increasing concentrations of glycine/proline in auto‐patch experiments. Sample images indicate HEK293T cells expressing human SLC6A20 v1; myristoylated GFP expression, used only for this imaging but not for transport measurements, show detectable surface expression of expressed SLC6A20 proteins. Scale bar, 10 μm. Increasing concentrations of glycine/proline were sequentially applied to HEK293T cells, as shown in Appendix Fig S7A. The indicated currents are average values from an ensemble of multiple (~ 20) cells in a single well. (glycine, n = 34 cells for untransfected/blank HEK293T cells, 36 for human SLC6A20‐V1, 38 for human SLC6A20‐V2, 48 for mouse SLC6A20A, 51 for mouse SLC6A20B, *P < 0.05, **P < 0.01, ***P < 0.001 (relative to untransfected), two‐way ANOVA with Tukey's test; proline, n = 46 cells for non‐transfected, 43 for hSLC6A20‐V1, 31 for hSLC6A20‐V2, 54 for mSLC6A20A, 54 for mSLC6A20B, *P < 0.05, **P < 0.01, ***P < 0.001 relative to untransfected, two‐way ANOVA with Tukey's test). The error bars represent SEM.
Glycine/proline‐induced currents for mouse SLC6A20A are dependent on sodium chloride, as shown by the suppression of the currents when sodium chloride is replaced with choline chloride or sodium gluconate. Each experimental condition was sequentially applied to HEK293T cells, as shown in Appendix Fig S7B. The indicated currents are average values from an ensemble of multiple (~ 20) cells in a single well. (glycine, n = 21 cells for untransfected/blank, 17 for human SLC6A20‐V1, 25 for human SLC6A20‐V2, 33 for mSLC6A20A, 28 for mSLC6A20B ***P < 0.001 (relative to buffer not containing glycine), two‐way ANOVA with Bonferroni's test; proline, n = 17 cells for untransfected, 23 for human SLC6A20‐V1, 47 for SLC6A20‐V2, 31 for mSLC6A20A, and 31 for mSLC6A20B, ***P < 0.001, two‐way ANOVA with Bonferroni's test). The error bars represent SEM.
Glycine/proline‐induced currents for mouse SLC6A20A do not show reversal potentials, as shown by the lack of reverse currents induced by increasing holding potentials in HEK293T cells. These experiments were performed using single HEK293T cells in a conventional patch‐clamp (not auto‐patch) setup. (glycine, n = 3, 7, 3, 3, 3, and 3 cells for untransfected HEK293T cells, 10, 11, 5, 6, 6, and 5 cells for mouse SLC6A20A, at −90, −60, −30, 0, 30, and 60 mV of holding potentials, respectively; proline, n = 4, 7, 4, 5, 3, and 4 cells for untransfected HEK293T cells, 3, 6, 3, 3, 3, and 3 cells for mouse SLC6A20A, at −90, −60, −30, 0, 30, and 60 mV of holding potentials, respectively). The error bars represent SEM.
Human neural progenitor cells (NPCs) and neurons differentiated from NPCs for 1–6 weeks express SLC6A20 proteins, as revealed by immunoblot analysis using the SLC6A20 antibody directed against a region of human SLC6A20 (aa 301–369; KATFNYENCLKKVSLLLTNTFDLEDGFLTASNLEQVKGYLASAYPSKYSEMFPQIKNCSLESELDTAVQ; Sigma) that is 83% identical to the mouse SLC6A20 sequence. Two different splice variants of human SLC6A20 (v1 and v2) expressed in HEK293T cells were used as positive controls. PSD‐95, an abundant excitatory postsynaptic scaffold protein, was used as a maker for neuronal maturation, and β‐actin was used as a loading control. Note that the band intensity of “unboiled” SLC6A20 at 2‐week time point is stronger relative to the boiled SLC6A20 band at 2 weeks, in line with that SLC6A20 is a transmembrane protein with twelve transmembrane domains that easily forms larger protein aggregates upon boiling and get stuck at the start location of western gels, decreasing the protein band intensity of SLC6A20. We did not try the unboiling of other samples at different time points because one sample was enough for proof of concept. U, untransfected HEK293T cells; V1/V2, HEK293T cells expressing human SLC6A20‐v1/v2.
Similar articles
-
Glycine transporter 1 modulates GABA release from amacrine cells by controlling occupancy of coagonist binding site of NMDA receptors.J Neurophysiol. 2013 Sep;110(6):1393-403. doi: 10.1152/jn.00193.2013. Epub 2013 Jun 26. J Neurophysiol. 2013. PMID: 23803324 Free PMC article.
-
Glycine transporters: essential regulators of synaptic transmission.Biochem Soc Trans. 2006 Feb;34(Pt 1):55-8. doi: 10.1042/BST0340055. Biochem Soc Trans. 2006. PMID: 16417482 Review.
-
Glycine transporter type 1 blockade changes NMDA receptor-mediated responses and LTP in hippocampal CA1 pyramidal cells by altering extracellular glycine levels.J Physiol. 2004 Jun 1;557(Pt 2):489-500. doi: 10.1113/jphysiol.2004.063321. Epub 2004 Apr 2. J Physiol. 2004. PMID: 15064326 Free PMC article.
-
The glycine transporter type 1 inhibitor N-[3-(4'-fluorophenyl)-3-(4'-phenylphenoxy)propyl]sarcosine potentiates NMDA receptor-mediated responses in vivo and produces an antipsychotic profile in rodent behavior.J Neurosci. 2003 Aug 20;23(20):7586-91. doi: 10.1523/JNEUROSCI.23-20-07586.2003. J Neurosci. 2003. PMID: 12930797 Free PMC article.
-
Glycine Transporters and Its Coupling with NMDA Receptors.Adv Neurobiol. 2017;16:55-83. doi: 10.1007/978-3-319-55769-4_4. Adv Neurobiol. 2017. PMID: 28828606 Review.
Cited by
-
Pan-Cancer Analysis of the COVID-19 Causal Gene SLC6A20.ACS Omega. 2023 Mar 31;8(14):13153-13161. doi: 10.1021/acsomega.3c00407. eCollection 2023 Apr 11. ACS Omega. 2023. PMID: 37041751 Free PMC article.
-
Epigenetics Is Implicated in the Basis of Gender Incongruence: An Epigenome-Wide Association Analysis.Front Neurosci. 2021 Aug 19;15:701017. doi: 10.3389/fnins.2021.701017. eCollection 2021. Front Neurosci. 2021. PMID: 34489625 Free PMC article.
-
Exploring the Association Between Human Blood Metabolites and Autism Spectrum Disorder Risk: A Bidirectional Mendelian Randomization Study.Health Sci Rep. 2025 Mar 3;8(3):e70528. doi: 10.1002/hsr2.70528. eCollection 2025 Mar. Health Sci Rep. 2025. PMID: 40041792 Free PMC article.
-
Dataset of single nucleotide polymorphisms of immune-associated genes in patients with SARS-CoV-2 infection.PLoS One. 2023 Nov 16;18(11):e0287725. doi: 10.1371/journal.pone.0287725. eCollection 2023. PLoS One. 2023. PMID: 37971979 Free PMC article.
-
The Multifaceted Roles of Proline in Cell Behavior.Front Cell Dev Biol. 2021 Aug 12;9:728576. doi: 10.3389/fcell.2021.728576. eCollection 2021. Front Cell Dev Biol. 2021. PMID: 34458276 Free PMC article. Review.
References
-
- Adey NB, Huang L, Ormonde PA, Baumgard ML, Pero R, Byreddy DV, Tavtigian SV, Bartel PL (2000) Threonine phosphorylation of the MMAC1/PTEN PDZ binding domain both inhibits and stimulates PDZ binding. Can Res 60: 35–37 - PubMed
-
- Anas MK, Lee MB, Zhou C, Hammer MA, Slow S, Karmouch J, Liu XJ, Broer S, Lever M, Baltz JM (2008) SIT1 is a betaine/proline transporter that is activated in mouse eggs after fertilization and functions until the 2‐cell stage. Development 135: 4123–4130 - PubMed
-
- Backman SA, Stambolic V, Suzuki A, Haight J, Elia A, Pretorius J, Tsao MS, Shannon P, Bolon B, Ivy GO et al (2001) Deletion of Pten in mouse brain causes seizures, ataxia and defects in soma size resembling Lhermitte‐Duclos disease. Nat Genet 29: 396–403 - PubMed
Publication types
MeSH terms
Substances
Associated data
- Actions
LinkOut - more resources
Full Text Sources
Other Literature Sources
Molecular Biology Databases
Research Materials
