Review
. 2021 Mar:170:142-199.
doi: 10.1016/j.addr.2021.01.005. Epub 2021 Jan 9.

Recent advances in nanomaterials for therapy and diagnosis for atherosclerosis

Affiliations
Review

Recent advances in nanomaterials for therapy and diagnosis for atherosclerosis

Jun Chen et al. Adv Drug Deliv Rev. 2021 Mar.

Abstract

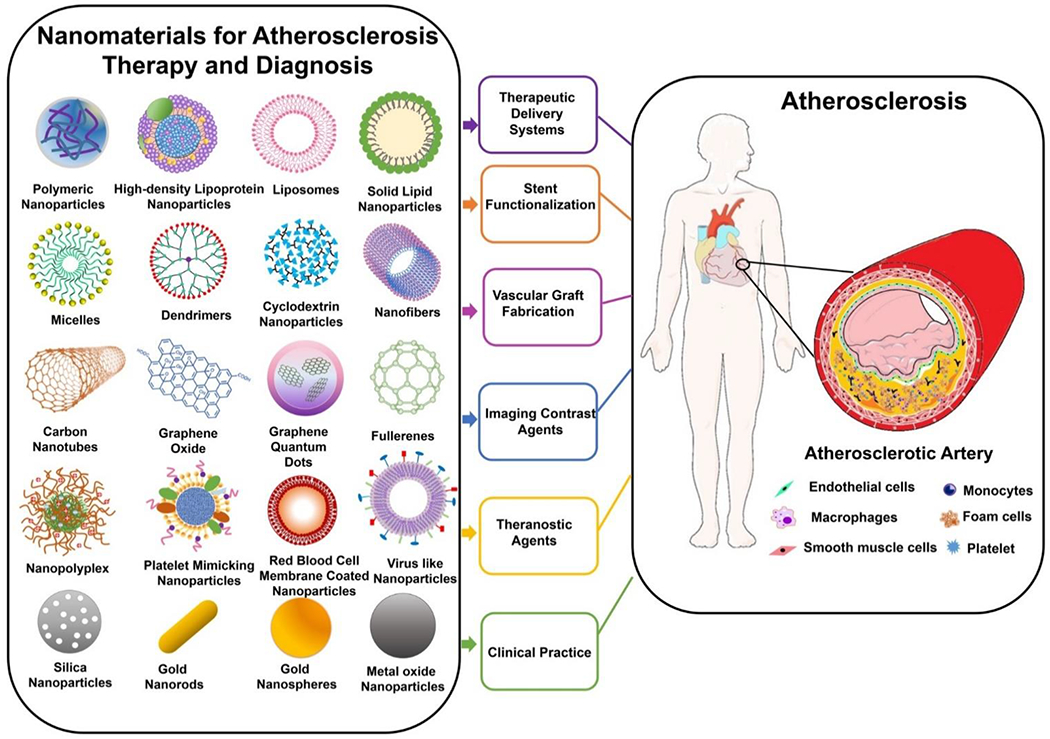
Atherosclerosis is a chronic inflammatory disease driven by lipid accumulation in arteries, leading to narrowing and thrombosis. It affects the heart, brain, and peripheral vessels and is the leading cause of mortality in the United States. Researchers have strived to design nanomaterials of various functions, ranging from non-invasive imaging contrast agents, targeted therapeutic delivery systems to multifunctional nanoagents able to target, diagnose, and treat atherosclerosis. Therefore, this review aims to summarize recent progress (2017-now) in the development of nanomaterials and their applications to improve atherosclerosis diagnosis and therapy during the preclinical and clinical stages of the disease.

Keywords: Atherosclerosis; Clinical use; Imaging contrast agents; Nanomaterials; Theranostic agents; Therapeutic delivery system.


Conflict of interest statement

Declaration of Competing Interest The authors declare no conflict of interest in the publication of this work.

Figures

Fig.1.
Fig.1.
Schematics of nanomaterials and associated applications discussed in the review for atherosclerosis therapy and diagnosis.
Fig.2.
Fig.2.
(a) Uptake efficacy of cyanine (Cy)7-HA-NPs in aortic, splenic, and bone marrow macrophages measured by flow cytometry. (b) Representative images of aortic roots from mice that received either buffer (control), HA-NPs, or free HA during a 12-week high-fat feeding period. (c) Selectivity of HA-NPs toward plaque-associated macrophages expressed as the percentage of HANP-positive area that colocalizes with CD68-positive macrophage area. (d) Comparison of the endothelial adherens junction architecture and HA-NP uptake efficacy in atherosclerotic lesions of mice under 6 weeks and 12 weeks of HFD: the upper chart displays low and high resolution of the mean VEC continuity determined in the plaque, and the lower chart shows the HA-NP uptake efficacy expressed as the fraction of HA-NP-positive plaque area and (e-f) associated quantification of mean junction continuity (e) and HA NP accumulation (f). (g) Confocal microscopy images of VEC-stained endothelial junctions (red) and HA-NPs (cyan blue) at the surface of an atherosclerotic plaque. Reproduced with permission from Ref. [29, 30]. Copyright 2017 and 2020, American Chemical Society.
Fig.3.
Fig.3.
(a) Schematic of AP-Lipo in situ upregulates anti-inflammatory macrophages for atherosclerosis regression. (b) TEM image of AP-Lipo. (c) In vitro release of PIO from liposomes after treating with PBS or serum. (d) The influence of PIO concentration on cellular uptake when incubated Lipo, PtdSer-Lipo, cRGDfK-Lipo and AP-Lipo with activated HUVECs. (e) Confocal microscopy images of the aortic root for M2 macrophages with CD68 (red) and CD206 (green) immunostaining. (f-h) The relative mRNA expression of macrophages secreted cytokines for (f) IL-1β, (g) IL-10 and (h) IL-4 in plaques after treating with saline, PIO, Lipo and AP-Lipo, respectively. (i) Quantitative analysis of collagen area in plaque area. (j) Quantitative analysis of plaque area. (k) Masson trichrome staining of the aortic root sections after received with different treatments. Reproduced with permission from Ref. [74]. Copyright 2019, American Chemical Society.
Fig.4.
Fig.4.
(a) Schematic of CSNP preparation and cargo-switching. (b) Quantification of lesion areas. (c) Quantification of plaque area. (d) Quantification of macrophage area. (e) representative images of aortic root sections and en face aortic arch and thoracic aorta after Oil-Red-O staining. (f) plasma cholesterol concentrations. (g-i) Quantification of plaque area in (g) aortic root and lesion areas, (h) aortic arch, and (i) thoracic aorta after CSNP treatment. Reproduced with permission from Ref. [166]. Copyright 2020, American Chemical Society.
Fig.5.
Fig.5.
(a) SWNTs specifically accumulate within Ly-6Chi monocytes and macrophages in the atherosclerotic aorta, whereas SWNT detection is low in other vascular cells. (b-c) Mice treated with SWNT-SHP1i develop significantly reduced plaque content in the aortic sinus relative to SWNT-Cy5.5 controls. (d-e) Compared to the control, SWNT-SHP1i decreases the phosphorylation of SHP-1, which indicates silencing of the antiphagocytic CD47-SIRPα signal. (f-h) Lesion from mice treated with pro-efferocytic SWNTs are more likely to have (f) apoptotic cells that have been ingested by lesional macrophages; (g) develop smaller necrotic cores; (h) accumulate less apoptotic debris. (i) Unsupervised dimensionality reduction identifies seven major cell types with a similar gene expression from the combine SWNT-Cy5.5 control and SWNTI-SHP1i datasets. (j) Heat map showing the gene expression of ten cluster-defining genes and leukocyte markers. Reproduced with permission from Ref. [173]. Copyright 2020, Nature publishing group.
Fig.6.
Fig.6.
(a) Schematic illustration of the preparation of AT-NPs. (b) Schematic illustration of preparation of MM-NPs through an extrusion method. (c) Schematic illustration of preparation of AT-NPs/MAs. (d) size measurement of NPs, MM-NPs and macrophage vesicle. (e) Representative TEM image of MM-NPs. (f) Ex vivo fluorescence bio-imaging and quantitative analysis of Cy7.5 fluorescent signal in aorta tissues from different types of treatments. (g) Quantitative analysis of lesion area in aorta tissues. (h-j) Quantitative analysis of (h) plaque area, (j) percentage of macrophage area, and (j) percentage of MMP-9 positive area. (k-m) MM-NP’s dose-dependent inhibition of macrophage inflammation induced by MCP-1, respectively, with MM-NP varied from 0 to 4 mg mL−1. Reproduced with permission from Ref. [201]. Copyright 2020, Nature publishing group.
Fig.7.
Fig.7.
(a) Schematic of nano Cu-MOFs-immobilized coating function. The NO release and copper ion delivery of the nano Cu-MOFs-immobilized coating exhibited a synergistic effect on inhibiting platelet adhesion and activation, promoting endothelialization, regulating immune response, and suppressing SMCs hyperplasia. (b-c) Rhodamine staining of ECs (b) and SMCs (c) on samples for 3 days. (d) Platelet adhesion and activation level after 45 min incubation with or without a NO donor. (e) Cross-sectional observation of the sample containing catheters after 30 min circulation. (f) Occlusion ratio of a sample containing catheters by measuring the cross-section diameter of the circulating tube. (g) Statistical analysis of the neointimal thickness and restenosis rate. (h) Intimal thickness of Ti and nano Cu-MOFs-immobilized Ti wire after implantation into the abdominal aorta of rats for four weeks. (i) Effect of the bare stents and nano Cu-MOFs-immobilized stents on in-stent restenosis assessed by histomorphometric analysis. (j) Immunofluorescence staining of the abdominal aorta after implantation for four weeks for CD31 (green), α-SMA (red), OPN (osteopontin) (green). Reproduced with permission from Ref. [232]. Copyright 2019, Elsevier.
Fig.8.
Fig.8.
(a) Images of 99mTc-HFn SPECT-CT imaging in atherosclerotic and control mice. Red circles indicate atherosclerotic plaques. (b-c) Quantitative image analysis showing a high correlation between 99mTc-HFn uptake in aortas and the plaque area measured by Oil Red O staining. (d) Histology of the 99mTc-HFn-positive plaque region from the excised aorta showed intense macrophage infiltration (Mac-3 staining) and quantitative analysis showed high correlation between 99mTc-HFn uptake and the extent of macrophage infiltration within plaques. (e) Immunofluorescent staining of 99mTc-HFn-positive plaque region demonstrated colocalization of HFn staining with macrophages (Mac-3 staining) within plaques. (f) Images of 99mTc-HFn SPECT-CT imaging (left panels) in different treatment mice and the corresponding ex vivo planar imaging (right panels) and Oil Red O-stained aortas (middle panels) excised from mice after imaging with 99mTc-HFn. (g-h) Quantitative analysis of 99mTc-HFn uptake in aortas and plaque areas measured by Oil Red O staining of the aortas from different treatment groups. Reproduced with permission from Ref. [290]. Copyright 2018, American Chemistry Society.
Fig.9.
Fig.9.
(a) Strategy of atherosclerosis imaging using P-ICG2-PtdSer -Lip and a scheme represents the fluorescence imaging system of P-ICG2-PtdSer-Lip for diagnosis of atherosclerosis. (b) TEM image of P-ICG2-PtdSer-Lip. (c) Fluorescence images of ICG, Peptide-ICG2 and P-ICG2-PtdSer-Lip. (d) Comparison of fluorescence intensity of Peptide-ICG2 with that of ICG (left) and fluorescence intensity of Peptide-ICG2 was plotted by measuring the fluorescence intensity at the indicated times during incubation with cathepsin B in the presence or absence of leupeptin (left). (e) Quantitative analysis of liposome uptake into macrophage cells (left) and endothelial cells (right). (f) Observation of fluorescence activation of P-ICG2-PtdSer-Lip in macrophage cells after 6h incubation of P-ICG2-PtdSer-Lip with RAW264 cells. (g) NIRF imaging of atherosclerotic plaques in ApoE−/− mice. The aortae were dissected at 24 h after the injection of the P-ICG2-PtdSer -Lip. The images were obtained by using a Maestro fluorescence imaging system. Reproduced with permission from Ref. [306] Copyright 2019, Elsevier.
Fig.10.
Fig.10.
(a) Illustration of developing a nanoplatform with two-photon imaging. (b) Ex vivo fluorescence images and quantitative result of TPP@PMM accumulation in aortas. (c) Two-photon confocal image of the atherosclerotic plaques. (d) Two-photon CLSM images of the plaques at various imaging depths. (e) Photographs of en face Oil red O-stained aortas and quantitative result of the Oil red O positive areas from the mice treated with different formulations. (f) Quantitative analysis of the plaque area, (g) necrotic core area and (h) positive area in different histochemistry analyses. Reproduced with permission from Ref. [337]. Copyright 2020, American Chemistry Society.
Figure 11
Figure 11
Fig.12.
Fig.12.
(a) Schematic illustration of the bioinspired MNC@M-ST/AP fabrication and its application for anti-atherosclerosis by integrating multiple-targeting. (b) In vivo T2-weighted MRI images of the aorta areas, PBS injected mice were used as control. (c) The signal to notice ratio (SNR) values of different MNC-based nanoparticles in aorta areas determined by cine flash MR imaging system. (d) Photographs of excised Oil red O-stained aortas at the time of sacrifice and the corresponding quantitative analyses of plaque areas (top); photographs of Oil red O-stained cryosections of the aortic valves and the corresponding quantitative analyses of plaque areas (bottom). (e) ELISA assays for the expression levels of MCP-1, IL-6, TNF-α, and MMP-10 in the plaque areas of mice with different treatments. Reproduced with permission from Ref. [349]. Copyright 2019, Elsevier.
Fig.13.
Fig.13.
(a) Schematic illustration of the anti-atherosclerosis treatment by preparing HAL@M2 Exo. (b) The inflammation-tropism and anti-inflammation effect of HAL@M2 Exo. (c) The simplified biosynthesis and metabolism pathway of heme induced by HAL. (d) Fluorescence imaging of the aortas excised from mice. (e) Photographs of the excised aortas stained by Oil red O and the corresponding quantitative analyses of plaque areas. (f) Cryosection photographs of the aortic valves stained by Oil red O and the corresponding quantitative analyses of plaque areas. (g) H&E staining images and the necrosis area statistics of aortic valves after different treatments. (h) Western blotting analyses of ABCA-1 and SR-BI. Reproduced with permission from Ref. [353]. Copyright 2020, Wiley-VCH.

References

    1. W.H. Organization, Cardiovascular diseases (CVDs) fact sheet, World Health Organization, (2017).
    1. Frostegård J, Immunity, Atherosclerosis and cardiovascular disease, BMC Med, 11 (2013) 117–117. - PMC - PubMed
    1. Lusis AJ, Atherosclerosis, Nature, 407 (2000) 233–241. - PMC - PubMed
    1. Davies JT, Delfino SF, Feinberg CE, Johnson MF, Nappi VL, Olinger JT, Schwab AP, Swanson HI, Current and emerging uses of statins in clinical therapeutics: a review, Lipid Insights, 9 (2016) 13–29. - PMC - PubMed
    1. d SJ, Giri J, Kobayashi T, Stent-based revascularization for complex lesions in PAD, J Cardiovasc Surg, 58 (2017) 715–721. - PubMed

Publication types