

EMS responses and non-transports during the COVID-19 pandemic
- PMID: 33429185
- PMCID: PMC7836527
- DOI: 10.1016/j.ajem.2020.12.078
EMS responses and non-transports during the COVID-19 pandemic
Abstract
Introduction: The COVID-19 pandemic may affect both use of 9-1-1 systems and prehospital treatment and transport practices. We evaluated EMS responses in an EMS region when it experienced low to moderate burden of COVID-19 disease to assess overall trends, response and management characteristics, and non-transport rates. Our goal is to inform current and future pandemic response in similar regions.
Methods: We performed a retrospective review of prehospital EMS responses from 22 urban, suburban, and rural EMS agencies in Western Pennsylvania. To account for seasonal variation, we compared demographic, response, and management characteristics for the 2-month period of March 15 to May 15, 2020 with the corresponding 2-month periods in 2016-2019. We then tested for an association between study period (pandemic vs historical control) and incidence of non-transport in unadjusted and adjusted regression. Finally, we described the continuous trends in responses and non-transports that occurred during the year before and initial phase of the COVID-19 pandemic from January 1, 2019 to May 31, 2020.
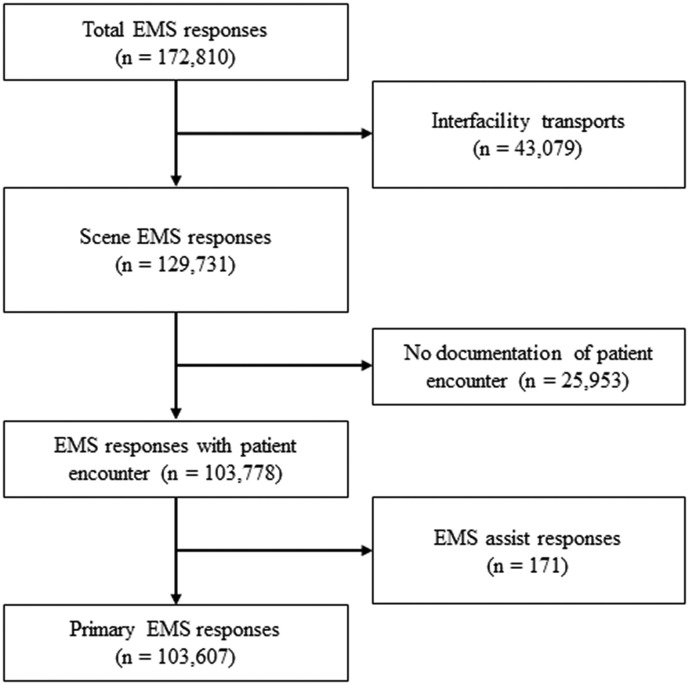
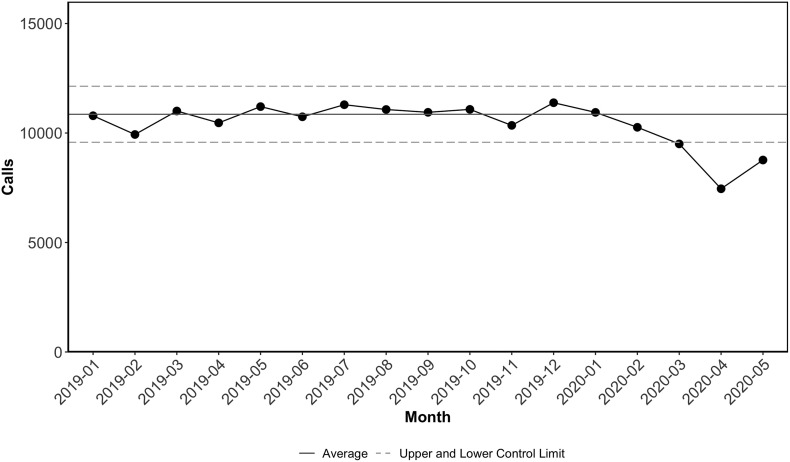
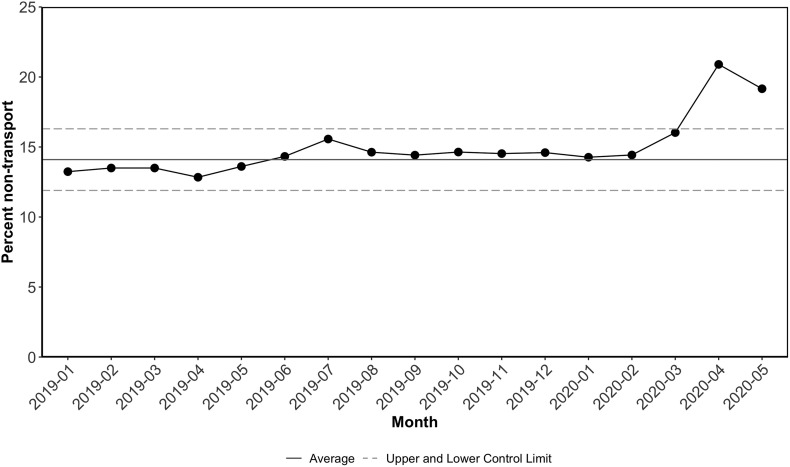
Results: Among 103,607 EMS responses in the 2-month comparative periods of March 15 to May 15, 2016-2020, we found a 26.5% [95% CI 26.9%, 27.1%] decrease in responses in 2020 compared to the same months from the four prior years. There was a small increase in respiratory cases (0.6% [95%CI 0.1%, 1.1%]) and greater frequency of abnormal vital signs suggesting a sicker patient cohort. There was a relative increase (46.6%) in non-transports between periods. The pandemic period was independently associated with an increase in non-transport (adjusted OR 1.68; 95%CI 1.59, 1.78). Among 177,194 EMS responses occurring in the year before and during the early period of the pandemic, between January 1, 2019, and May 31, 2020, we identified a 31% decrease in responses and a 48% relative increase in non-transports for April 2020 compared to the previous year's monthly averages.
Conclusion: Despite a low to moderate burden of infection during the initial period of the COVID-19 pandemic, we found a decline in overall EMS response volumes and an increase in the rate of non-transports independent of patient demographics and other response characteristics.
Keywords: Coronavirus; Emergency medical services; Prehospital.
Copyright © 2021 Elsevier Inc. All rights reserved.
Conflict of interest statement
Declaration of Competing Interest CM is supported by the Centers for Disease Control and Prevention through interpersonal agreement 20IPA2014139 as part of a technical assistance team addressing occupational health and safety-related to COVID-19. JE research time is supported by the National Institutes of Health through grant 5K23NS097629. Other authors report no relevant disclosures.
Figures
References
-
- WHO. World Health Organization. Coronavirus disease 2019 (COVID-19) situation report–51, https://www.who.int/emergencies/diseases/novel-coronavirus-2019/situatio... 2020 Mar [accessed 2020 Aug 22].
-
- Pennsylvania Department of Health. Commonwealth of Pennsylvania. Daily COVID-19 Situation Report, https://www.health.pa.gov/topics/Documents/Diseases%20and%20Conditions/C... 2020 Mar 12 [accessed 2020 Aug 22].
-
- Pennsylvania Department of Health. Commonwealth of Pennsylvania. Daily COVID-19 Situation Report, https://www.health.pa.gov/topics/Documents/Diseases%20and%20Conditions/C... 2020 Apr 13 [accessed 2020 Aug 22].
-
- Pennsylvania Department of Health. Commonwealth of Pennsylvania. PA Coronavirus (COVID-19) Update Archive, https://www.health.pa.gov/topics/disease/coronavirus/Pages/May-Archive.a... 2020 May 1 [accessed 2020 Aug 25].
-
- United States Census Bureau. U.S. Department of Commerce. QuickFacts: Allegheny County, Pennsylvania, https://www.census.gov/quickfacts/alleghenycountypennsylvania; 2020 Jun 25 [accessed 2020 Aug 25].
MeSH terms
LinkOut - more resources
Full Text Sources
Other Literature Sources
Medical
Miscellaneous
