. 2021 Feb;590(7847):635-641.
doi: 10.1038/s41586-020-03148-w. Epub 2021 Jan 11.

Circuits between infected macrophages and T cells in SARS-CoV-2 pneumonia

Collaborators, Affiliations

Circuits between infected macrophages and T cells in SARS-CoV-2 pneumonia

Rogan A Grant et al. Nature. 2021 Feb.

Abstract

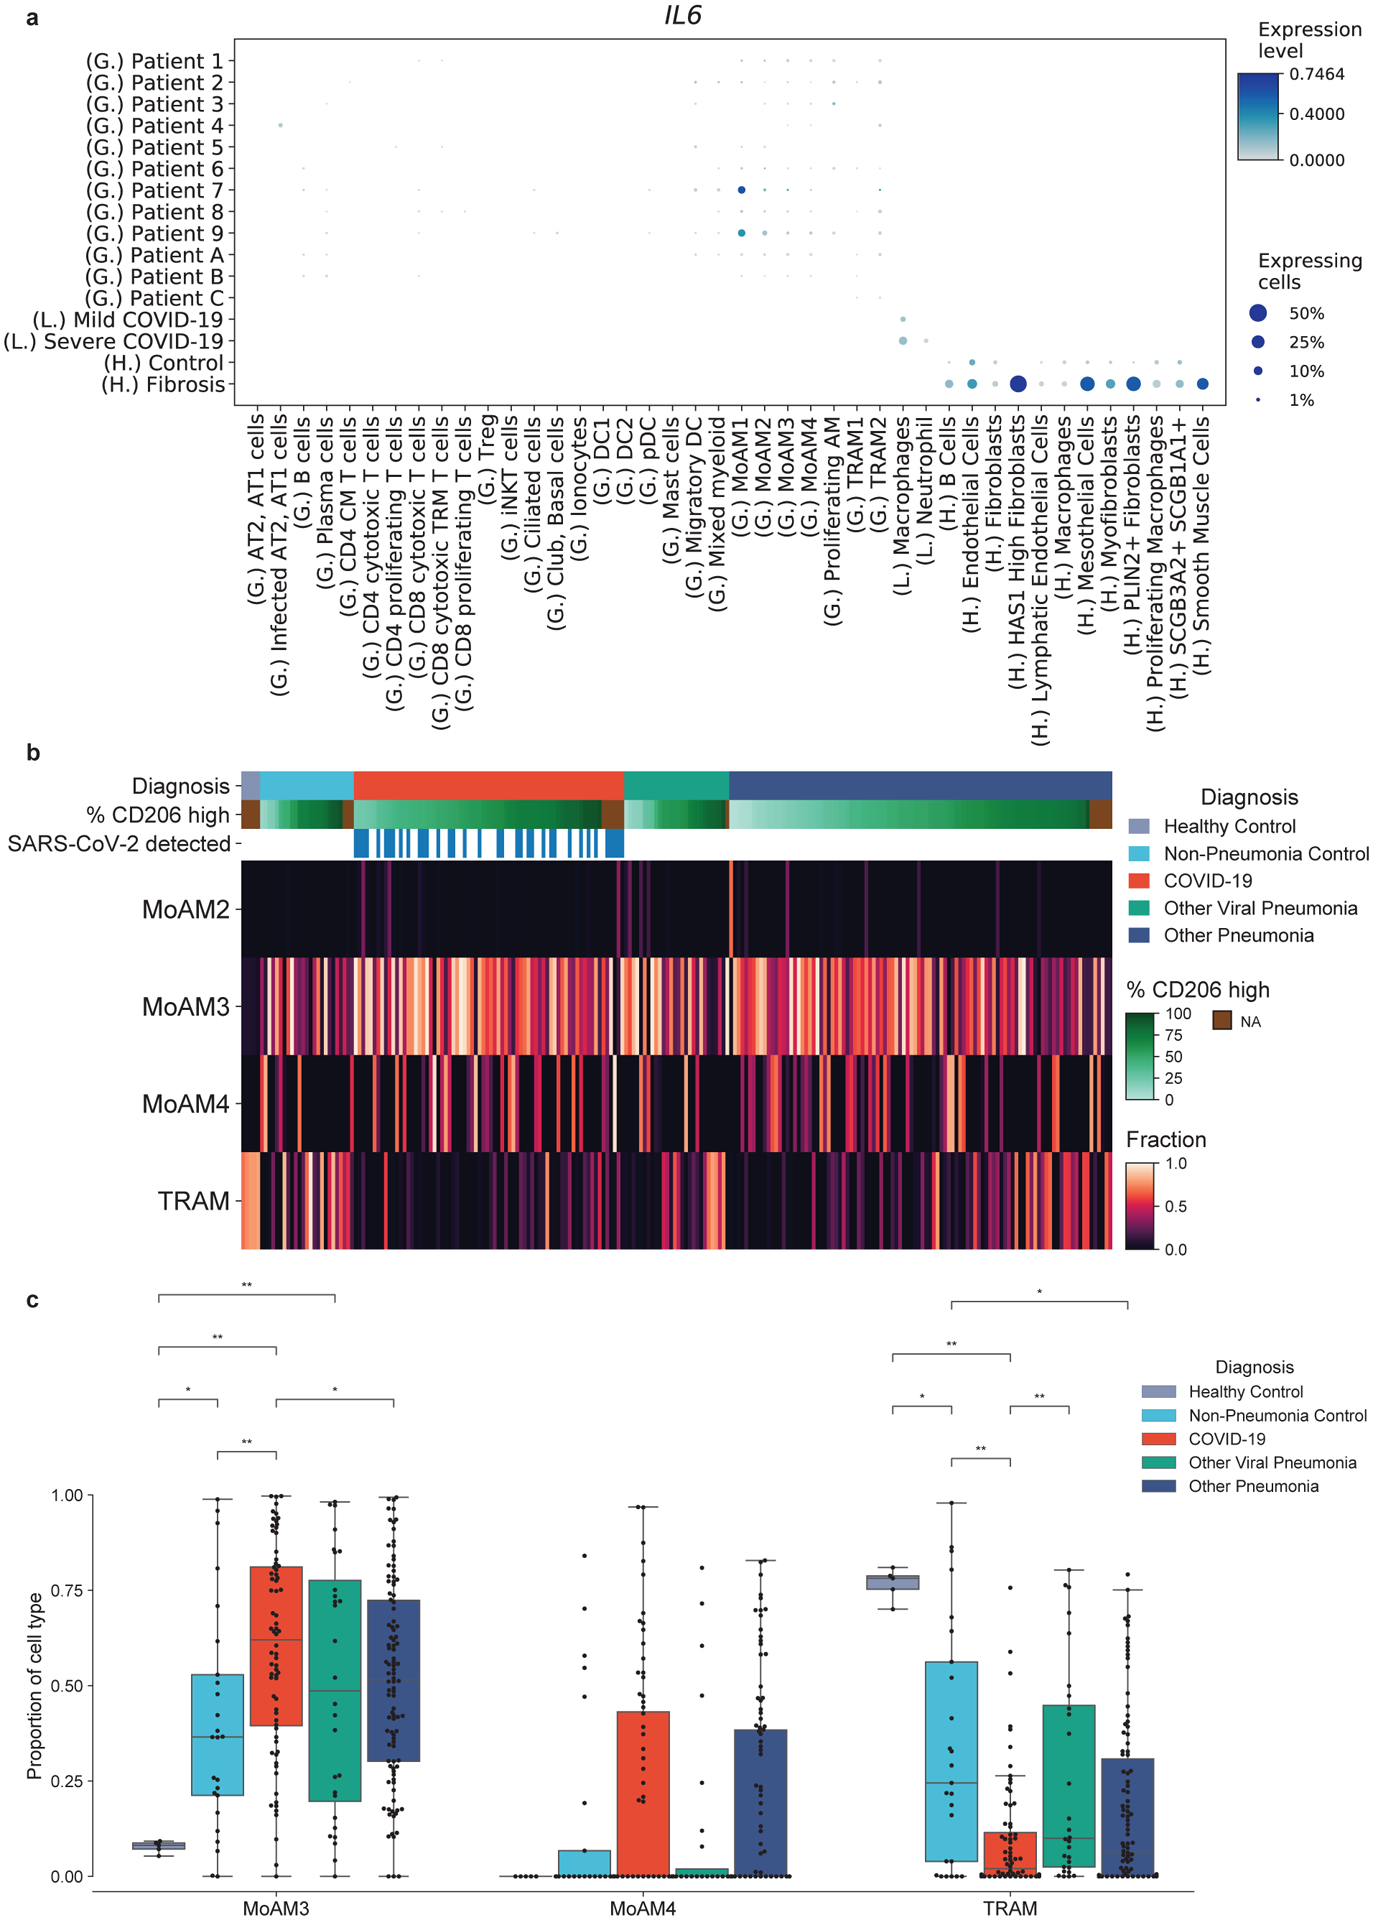
Some patients infected with severe acute respiratory syndrome coronavirus 2 (SARS-CoV-2) develop severe pneumonia and acute respiratory distress syndrome1 (ARDS). Distinct clinical features in these patients have led to speculation that the immune response to virus in the SARS-CoV-2-infected alveolus differs from that in other types of pneumonia2. Here we investigate SARS-CoV-2 pathobiology by characterizing the immune response in the alveoli of patients infected with the virus. We collected bronchoalveolar lavage fluid samples from 88 patients with SARS-CoV-2-induced respiratory failure and 211 patients with known or suspected pneumonia from other pathogens, and analysed them using flow cytometry and bulk transcriptomic profiling. We performed single-cell RNA sequencing on 10 bronchoalveolar lavage fluid samples collected from patients with severe coronavirus disease 2019 (COVID-19) within 48 h of intubation. In the majority of patients with SARS-CoV-2 infection, the alveolar space was persistently enriched in T cells and monocytes. Bulk and single-cell transcriptomic profiling suggested that SARS-CoV-2 infects alveolar macrophages, which in turn respond by producing T cell chemoattractants. These T cells produce interferon-γ to induce inflammatory cytokine release from alveolar macrophages and further promote T cell activation. Collectively, our results suggest that SARS-CoV-2 causes a slowly unfolding, spatially limited alveolitis in which alveolar macrophages containing SARS-CoV-2 and T cells form a positive feedback loop that drives persistent alveolar inflammation.


Conflict of interest statement

Authors do not declare conflict of interest.

Figures

Extended Data Fig. 1:
Extended Data Fig. 1:. Overview of the study and biomarkers.
We compared BAL fluid obtained sequentially from 88 patients with severe SARS-CoV-2 pneumonia requiring mechanical ventilation with 38 patients with confirmed pneumonia secondary to other respiratory viruses (other viral pneumonia), 173 patients with non-viral pneumonia (other pneumonia) and 42 mechanically ventilated patients without pneumonia undergoing BAL (non-pneumonia controls). a. Sankey diagram illustrating steps in analysis performed for at least one BAL sample for participants with COVID-19, other viral pneumonia, non-viral pneumonia (other pneumonia), non-pneumonia controls, and healthy controls. This includes samples from patients 1) enrolled in the SCRIPT study (346 patients), 2) analyzed via flow cytometry (241 patients), 3) for whom bulk RNA-seq was performed on flow cytometry-sorted alveolar macrophages (181 patients) and 4) for whom single-cell RNA-seq was performed on cells from BAL fluid (10 patients with SARS-CoV-2 pneumonia, 1 patient with bacterial pneumonia and 1 patient intubated for reasons other than pneumonia (gastrointestinal bleeding requiring endoscopy, a non-pneumonia control)). Some samples were cryopreserved and sorted post-cryorecovery. Because cryopreservation affects the number of neutrophils, these samples were not included in flow cytometric analysis but were used for bulk RNA-seq profiling of flow cytometry-sorted alveolar macrophages. Samples for which flow or bulk RNA-seq analysis was skipped are represented by alluvia flowing over the grouping bars. b. Sankey diagram illustrating steps in analysis performed for all BAL samples from participants with COVID-19, other viral pneumonia, non-viral pneumonia (other pneumonia) and non-pneumonia controls. This includes samples from patients 1) enrolled in the SCRIPT study (564 samples), 2) analyzed via flow cytometry (352 samples), 3) for whom bulk RNA-seq was performed on flow cytometry-sorted alveolar macrophages (232 samples) and 4) for whom single-cell RNA-seq was performed on cells from BAL fluid (12 samples). c. Self-reported smoking status. Significantly fewer active smokers were observed in the COVID-19 cohort as compared with all control groups (q < 0.05, pairwise Chi-square tests of proportions with continuity and FDR correction). d–i. Biomarkers: C-reactive protein (CRP), D-dimer, ferritin, procalcitonin, creatine phosphokinase (CPK), lactate dehydrogenase (LDH). The green-shaded area indicates the normal range. j. Number of patients remaining on mechanical ventilation. k. Number of BAL per day of mechanical ventilation. l. The BAL sampling rate per day among patients with COVID-19 was not higher than the sampling rate among patients with other pneumonias.
Extended Data Fig. 2:
Extended Data Fig. 2:. Representative gating strategy to identify immune cell subsets in BAL samples.
a. We developed a gating strategy that allowed us to quantify immune cell populations including monocytes, alveolar macrophage subsets, and T cell subsets. Importantly, we defined alveolar macrophages by their expression of CD206, subdividing them into early monocyte-derived alveolar macrophages (CD206lo) and more mature (CD206hi) alveolar macrophages. T cells were identified as CD3-positive and further subdivided into CD4+ and CD8+ T cells. Tregs were identified as CD3+CD4+CD25+CD127−. Neutrophils were identified as CD15+ cells. Monocytes were identified as HLA-DR+CD4+CD206− cells. Of note, only CD206hi alveolar macrophages were flow cytometry-sorted for bulk RNA-seq analysis (Figs. 2 and 3); hence, early monocyte-derived alveolar macrophages (MoAM1 and MoAM2 in our single-cell RNA-seq data, Fig. 4a–h) were not captured in bulk RNA-seq. Representative sample from a patient without neutrophilia is shown. Solid red arrows indicate direct sequential gating, dashed blue arrows indicate Boolean “not” gates. Numbers on plots indicate the percentage of the parent population. Axis labels indicate laser line (UV – 355 nm, V – 405 nm, B – 488 nm, YG – 552 nm, R – 640 nm), bandpass filter, fluorochrome and antigen/dye. b. Representative sample from a patient with neutrophilia illustrates loss of CD206hi alveolar macrophages and influx of monocyte-derived CD206lo alveolar macrophages. c–d. Contour plot and histogram overlays illustrating forward (FSC) and side scatter (SSC) properties of the CD3+ T cells (CD3), CD15+ neutrophils (CD15), monocytes, CD206lo alveolar macrophages (CD206lo), and CD206hi alveolar macrophages (CD206hi) in the representative sample from a patient without neutrophilia (c.) and with neutrophilia (d.). Note that neutrophils have higher side scatter than monocytes. e. Representative contour plots illustrating a sample with two distinct populations of CD206hi alveolar macrophages. Single-cell RNA-seq analysis (Fig. 4a–h) suggests that CD206hi alveolar macrophages (double-head arrow) are bona fide tissue-resident alveolar macrophages.
Extended Data Fig. 3.
Extended Data Fig. 3.. At the time of intubation, the alveolar space in patients with severe SARS-CoV-2 pneumonia is enriched for T cells and monocytes and contains alveolar macrophages harboring SARS-CoV-2 RNA.
a. Proportions of cells detected within 48 hours of intubation (q < 0.05, pairwise Wilcoxon rank-sum tests with FDR correction). Comparisons are not significant unless otherwise noted. b. Hierarchical clustering of viral reads for SARS-CoV-2 and influenza A/California/07/2009 virus using Ward’s method. Log10(DESeq2-normalized counts) are shown. c. Cumulative coverage plot of RNA-seq reads from flow cytometry-sorted alveolar macrophages aligned to the SARS-CoV-2 genome.
Extended Data Fig. 4.
Extended Data Fig. 4.. The BAL fluid from patients with SARS-CoV-2 pneumonia is persistently enriched for T cells irrespective of superinfection status.
a. Heatmap of flow cytometry data demonstrating composition of BAL samples from all time points, grouped by diagnosis and ordered by the duration of mechanical ventilation. Column headers are color-coded by the diagnosis, duration of mechanical ventilation (white color indicates chronically ventilated patients), and presence or absence of superinfection (“Infection Status”). “Infection Status” refers only to the “COVID-19” and “Other Viral Pneumonia” groups; blanks in these groups refer to samples for which microbiology data were incomplete and infectious status could not be determined. “Viral infection only” refers to viral pathogens as the only detected pathogen in a sample and “Viral infection with bacterial/fungal superinfection” refers to detection of a viral pathogen with one or more bacterial or fungal co-pathogens. b. Comparison of percentage of CD206lo and CD206hi alveolar macrophages between early (<48 hours after intubation) and late (>48 hours of mechanical ventilation) samples (q < 0.05, pairwise Wilcoxon rank-sum tests with FDR correction). c. Comparison of CD4+ and CD8+ T cell and neutrophil abundance in the COVID-19 group, with and without superinfection in early and late sampling. Superinfection is represented by lighter bars. Differences between groups are not significant after FDR correction.
Extended Data Fig. 5.
Extended Data Fig. 5.. SARS-CoV-2 pneumonia is characterized by a persistent interferon-response signature in alveolar macrophages.
a. k-means clustering of the 2,323 significantly variable genes (q < 0.05, likelihood-ratio test) across diagnosis, columns represent each individual patient, grouped by diagnosis and ordered by day from first intubation. “Infection Status” refers only to the “COVID-19” and “Other Viral Pneumonia” groups; blanks in these groups refer to samples for which microbiology data were incomplete and infectious status could not be determined. “Viral infection only” refers to viral pathogens as the only detected pathogen in a sample and “Viral infection with bacterial/fungal superinfection” refers to detection of a viral pathogen with one or more bacterial or fungal co-pathogens. Representative genes and GO biological processes are shown for each cluster. Column headers are color-coded by diagnosis and duration of mechanical ventilation (white color indicates chronically ventilated patients). b. Expression of selected genes between the groups. Note that expression of IL6 is not increased in any group. All significant comparisons are shown (q < 0.05, Wald test with FDR correction in DESeq2). c. Weighted gene co-expression network analysis (WGCNA). d–f. Interferon-response signatures in alveolar macrophages from patients with COVID-19 gradually decrease over the course of disease. Correlation between average expression of genes from GO:0060337 “type I interferon signaling pathway” (R = −0.51, P = 5.7×10⁻⁶, Pearson correlation; panel d.), GO:0060333 “interferon-gamma-mediated signaling pathway” (R = −0.22, P = 0.06, Pearson correlation; panel e.), module 15 of WGCNA (R = −0.40, P = 5.5×10⁻⁴, Pearson correlation; panel f.) and time on mechanical ventilation. Gray boundaries represent 95% confidence intervals. g. UMAP projections of all bulk RNA-seq samples. Average expression of WGCNA module 15 (left) and percent of CD3+ T cells in BAL (right) are shown by point area. h. Heatmap demonstrating time-dependent changes in gene expression of the canonical interferon-response genes from module 15 from patients with positive outcomes (discharged home or inpatient facility) or poor outcomes (discharged to a long-term acute care facility (LTAC) or deceased. i. Correlation between detection of SARS-CoV-2 reads and disease progression (ρ = −0.49, p = 8.3×10⁻⁴, Spearman correlation).
Extended Data Fig. 6.
Extended Data Fig. 6.. Single-cell RNA-seq identifies a positive feedback loop between IFNγ-producing T cells and SARS-CoV-2-infected alveolar macrophages.
a. Subsets of alveolar macrophages and T cells are represented by the cells from all 10 patients with COVID-19. b. IFNG expression is detected in T cells from all 10 patients with COVID-19, T cells with at least one count of IFNG were used for analysis. c. Detection of the SARS-CoV-2 negative strand. Density projection plot, with expression averaged within hexagonal areas on UMAP. d. Coverage plot of single-cell RNA-seq reads aligned to the SARS-CoV-2 genome. Cumulative data from 10 patients. Reads were aligned to genes on the positive strand or to the entire negative strand. e. UMAP plot showing integrative analysis of 105,715 cells isolated from 10 patients with severe COVID-19 within 48 hours after intubation (see Fig. 4a–h), one intubated patient with bacterial pneumonia and one intubated non-pneumonia control patient. AT1 – alveolar epithelial type 1 cells; AT2 – alveolar epithelial type 2 cells; DC1 – conventional dendritic cells type 1, CLEC9A+; DC2 – conventional dendritic cells type 2, CD1C+; Migratory DC – migratory dendritic cells, CCR7+; pDC – plasmacytoid dendritic cells, CLEC4C+; Mixed myeloid – mixed cluster containing transitory dendritic cells and very immature monocyte-derived macrophages; TRAM – tissue-resident alveolar macrophages; MoAM – monocyte-derived alveolar macrophages; iNKT cells – invariant natural killer T cells; Treg – regulatory T cells, FOXP3+. f. Cells from non-pneumonia control (patient 6) and a patient with bacterial pneumonia (Patient C) primarily contribute to the TRAM1 cluster and have limited contribution to MoAM clusters. g. UMAP plot showing cells from non-pneumonia control (patient 6) and a patient with bacterial pneumonia (Patient C) from the integrative analysis on Extended Data Fig. 5e. h. Presence of co-infection does not affect clustering. UMAP plot showing cells from patients with and without co-infection from the integrative analysis in Fig. 4.
Extended Data Fig. 7.
Extended Data Fig. 7.. Deconvolution of bulk RNA-seq demonstrates loss of tissue-resident alveolar macrophages and persistence of mature monocyte-derived alveolar macrophages in patients with severe COVID-19.
a. Dot plot showing IL6 expression across cell types. Dot size is proportional to the number of cells expressing IL6 in the corresponding cluster. Data from this study (G.) are presented per patient, data from Liao et al. 2020 (L.) and Haberman et al. 2020 (H.) are averaged by condition. b. Heatmap demonstrating proportion of alveolar macrophage subsets predicted from deconvolution analysis. Data are grouped by condition and ordered by proportion of CD206hi alveolar macrophages. c. Proportion of alveolar macrophage cell types in patients with COVID-19 in comparison to other types of pneumonia obtained from deconvolution analysis (pairwise Wilcoxon rank-sum tests with FDR correction, * q < 0.05, ** q < 0.01, *** q < 0.001).
Fig. 1.
Fig. 1.. Schematic and demographics of the SCRIPT cohort.
a. Schematic illustrating the interpretation of the main findings. 1. The normal alveolus contains ACE2-expressing alveolar type 1 and type 2 cells (AT1 and AT2, respectively) and tissue-resident alveolar macrophages (TRAM). 2. SARS-CoV-2 infects AT1 and AT2 cells and TRAM. Infected TRAM express T cell chemokines. 3. Cross-reactive or de novo-generated effector-memory T cells recognize SARS-CoV-2 antigens presented by TRAM and produce IFNγ, further activating TRAM to produce cytokines and chemokines. 4. Activated T cells proliferate and continue to produce IFNγ, eventually leading to death of infected TRAM and recruitment of monocytes, which rapidly differentiate into monocyte-derived alveolar macrophages (MoAM). 5. Recruited MoAM become infected with SARS-CoV-2, continuing to present antigens to T cells and maintaining the feedback loop until viral clearance is achieved. b. Timing of hospital admission (square), BAL fluid collection (diamonds), length of mechanical ventilation (bold red line), and hospital stay (thin grey line) in patients with severe COVID-19 grouped by outcomes (crossed open red circles – death; green circles – discharged). Day 0 is defined as the day of the first intubation. c. Distribution of patient age. Differences not significant by pairwise t-test with FDR correction. d. Proportions of females (red) and males (blue) (pairwise Chi-square tests of proportions with continuity and FDR correction). e. Self-reported ethnicity (pairwise Chi-square tests of proportions with continuity and FDR correction). f. Body mass index (BMI) (t-test with FDR correction). g. The Sequential Organ Failure Assessment (SOFA) score (pairwise Wilcoxon rank-sum tests with FDR correction). h. The Acute Physiology Score (APS) (pairwise Wilcoxon rank-sum tests with FDR correction). i. ICU length of stay (pairwise t-tests with FDR correction). j. The duration of mechanical ventilation (pairwise t-tests with FDR correction). k. Mortality in patients with COVID-19 was similar to patients in other groups (25% vs. 35%, P = 0.10, χ2 = 2.63, Chi-square tests of proportions).
Fig. 2.
Fig. 2.. At the time of intubation, the alveolar space in patients with severe SARS-CoV-2 pneumonia is enriched for T cells and monocytes and contains alveolar macrophages harboring SARS-CoV-2 RNA and expressing interferon response genes.
a. Hierarchical clustering of flow cytometry data from BAL samples collected within 48 hours of intubation. Column headers are color-coded by the diagnosis and presence or absence of co-infection (“Infection Status”). “Infection Status” refers only to the “COVID-19” and “Other Viral Pneumonia” groups. “Viral infection only” refers to viral pathogens as the only detected pathogen in a sample and “Viral infection with bacterial/fungal co-infection” refers to detection of a viral pathogen with one or more bacterial or fungal co-pathogens. Samples were clustered by Euclidean distance using Ward’s method. b. Proportions of cells detected within 48 hours of intubation (q < 0.05, pairwise Wilcoxon rank-sum tests with FDR correction). Comparisons are not significant unless otherwise noted. c. k-means clustering of the 1,194 significantly variable genes (q < 0.05, likelihood-ratio test) across diagnosis. Columns represent each individual sample and are clustered using Ward’s method. Column headers are color-coded by the diagnosis and presence or absence of a co-infecting pathogen (“Infection Status”). “Infection Status” refers only to the “COVID-19” and “Other Viral Pneumonia” groups; blanks in these groups refer to samples for which microbiology data were incomplete and infectious status could not be determined. “Viral infection only” refers to viral pathogens as the only detected pathogen in a sample and “Viral infection with bacterial/fungal co-infection” refers to detection of a viral pathogen with one or more bacterial or fungal co-pathogens. Representative genes and GO biological processes are shown for each cluster.
Fig. 3.
Fig. 3.. The BAL fluid from patients with SARS-CoV-2 pneumonia is persistently enriched for T cells and characterized by an interferon-response signature in alveolar macrophages.
a. Hierarchical clustering of flow cytometry analysis of BAL samples from all time points from patients with serial sampling (n > 1) based on their composition. Column headers are color-coded by the diagnosis, patient, duration of mechanical ventilation, and presence or absence of superinfection (“Infection Status”). “Infection Status” refers only to the “COVID-19” and “Other Viral Pneumonia” groups; blanks in these groups refer to samples for which microbiology data were incomplete and infectious status could not be determined. “Viral infection only” refers to viral pathogens as the only detected pathogen in a sample and “Viral infection with bacterial/fungal superinfection” refers to detection of a viral pathogen with one or more bacterial or fungal co-pathogens. Samples were clustered by Euclidean distance using Ward’s method. b. Comparison of percentage of CD4+ and CD8+ T cells and neutrophils between early (<48 hours after intubation) and late (>48 hours of mechanical ventilation) samples (q < 0.05, pairwise Wilcoxon rank-sum tests with FDR correction). c. k-means clustering of the 2,323 significantly variable genes (q < 0.05, likelihood-ratio test) across diagnosis, columns represent each individual patient and clustered using Ward’s method. Representative genes and GO biological processes are shown for each cluster. Column headers are color-coded by the diagnosis, duration of mechanical ventilation (white color indicates chronically ventilated patients), and presence or absence of superinfection (“Infection Status”). “Infection Status”, “Viral infection only” and “Viral infection with bacterial/fungal superinfection” are as in panel a.
Fig. 4.
Fig. 4.. Single-cell RNA-seq identifies a positive feedback loop between IFNγ-producing T cells and SARS-CoV-2-infected alveolar macrophages.
a. UMAP plot showing integrated analysis of 77,146 cells isolated from 10 patients with severe COVID-19 within 48 hours after intubation. AT1 – alveolar epithelial type 1 cells; AT2 – alveolar epithelial type 2 cells; DC1 – conventional dendritic cells type 1, CLEC9A+; DC2 – conventional dendritic cells type 2, CD1C+; Migratory DC – migratory dendritic cells, CCR7+; pDC – plasmacytoid dendritic cells, CLEC4C+; Mixed myeloid – mixed cluster containing transitory dendritic cells and very immature monocyte-derived macrophages; TRAM – tissue-resident alveolar macrophages; MoAM – monocyte-derived alveolar macrophages; iNKT cells – invariant natural killer T cells; Treg – regulatory T cells, FOXP3+. b. Heatmap demonstrating expression of the selected genes of interest in two subsets of tissue-resident (TRAM1 and TRAM2) and four subsets of monocyte-derived (MoAM1, MoAM2, MoAM3, MoAM4) alveolar macrophages. Each column represents a single patient with COVID-19. c. Expression of IFNG is restricted to T cells. d. Detection of SARS-CoV-2 transcripts. Plot shows cumulative number of SARS-CoV-2 genes plus negative strand. e-g. Specific upregulation of selected cytokines and chemokines in TRAM2: CXCL10 (e.), CCL4 (f.), IL1B (g.). Density projection plots, expression averaged within hexagonal areas on UMAP. h. Heatmap demonstrating selected differentially expressed genes between two subsets of tissue-resident alveolar macrophages (TRAM1 and TRAM2). i. SARS-CoV-2 infection is spatially restricted. Combined immunofluorescence microscopy for CD206, a marker of mature macrophages (red arrows), and smFISH (RNAscope) for positive- (yellow arrowheads) and negative-strand (cyan doublehead arrows) SARS-CoV-2 transcripts. Inserts show infected and non-infected CD206-positive alveolar macrophages in the adjacent alveoli.

Update of

Comment in

References

    1. Yang X et al. Clinical course and outcomes of critically ill patients with SARS-CoV-2 pneumonia in Wuhan, China: a single-centered, retrospective, observational study. Lancet Respir Med 8, 475–481 (2020). - PMC - PubMed
    1. Gattinoni L et al. COVID-19 Does Not Lead to a “Typical” Acute Respiratory Distress Syndrome. American Journal of Respiratory and Critical Care Medicine vol. 201 1299–1300 (2020). - PMC - PubMed
    1. Baud D et al. Real estimates of mortality following COVID-19 infection. Lancet Infect. Dis 20, 773 (2020). - PMC - PubMed
    1. Zhou F et al. Clinical course and risk factors for mortality of adult inpatients with COVID-19 in Wuhan, China: a retrospective cohort study. Lancet 395, 1054–1062 (2020). - PMC - PubMed
    1. RECOVERY Collaborative Group et al. Dexamethasone in Hospitalized Patients with Covid-19 - Preliminary Report. N. Engl. J. Med (2020) doi:10.1056/NEJMoa2021436. - DOI - PMC - PubMed

Publication types

MeSH terms