. 2021 Sep 2;22(5):bbaa381.
doi: 10.1093/bib/bbaa381.

DeepCNV: a deep learning approach for authenticating copy number variations

Affiliations

DeepCNV: a deep learning approach for authenticating copy number variations

Joseph T Glessner et al. Brief Bioinform. .

Abstract

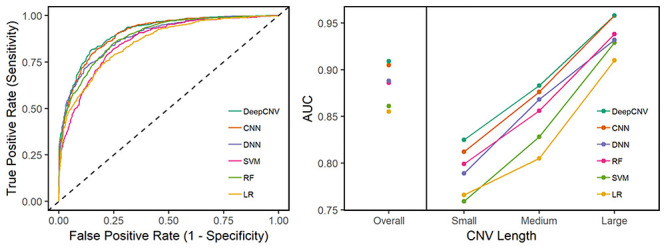
Copy number variations (CNVs) are an important class of variations contributing to the pathogenesis of many disease phenotypes. Detecting CNVs from genomic data remains difficult, and the most currently applied methods suffer from an unacceptably high false positive rate. A common practice is to have human experts manually review original CNV calls for filtering false positives before further downstream analysis or experimental validation. Here, we propose DeepCNV, a deep learning-based tool, intended to replace human experts when validating CNV calls, focusing on the calls made by one of the most accurate CNV callers, PennCNV. The sophistication of the deep neural network algorithm is enriched with over 10 000 expert-scored samples that are split into training and testing sets. Variant confidence, especially for CNVs, is a main roadblock impeding the progress of linking CNVs with the disease. We show that DeepCNV adds to the confidence of the CNV calls with an optimal area under the receiver operating characteristic curve of 0.909, exceeding other machine learning methods. The superiority of DeepCNV was also benchmarked and confirmed using an experimental wet-lab validation dataset. We conclude that the improvement obtained by DeepCNV results in significantly fewer false positive results and failures to replicate the CNV association results.

Keywords: copy number variation; deep learning.


Figures

Figure 1
Figure 1
Two representative examples of the CNV image data. LRR scatter plot is on the top and BAF scatter plot is on the bottom. Both plots are drawn against the same SNP positions. Right panels show a false positive call made by PennCNV (a sample without CNV) in which the LRR dots concentrate around zero reference line and the BAF dots show three normal kinds of B Alleles, for example, AA, AB and BB. Left panels show a true positive call (a sample with CNV) in which the LRR dots colored red are above the zero reference line and BAF dots colored red show four kinds of B Alleles, for example, BBB, ABB, AAB and AAA.
Figure 2
Figure 2
The architecture of DeepCNV model. The upper part is the CNN for modeling the image data. The lower part is the DNN for modeling the meta data.
Figure 3
Figure 3
The Grad-CAM pipeline. The Grad-CAM pipeline detects important regions of the image data.
Figure 4
Figure 4
Prediction performance on the human-labeled dataset. The left panel presents the ROC curves. The right panel shows the overall AUC values and the AUC values stratified by the CNV sizes.
Figure 5
Figure 5
Consistency between DeepCNV and human expert labeling in different CN scenarios. The CN refers to the actual integer CN estimates calculated by PennCNV [10], and the normal CN is 2. For autosome, CN = 0 or 1 means there is a deletion and CN ≥ 3 means there is a duplication [10].
Figure 6
Figure 6
t-SNE visualization of the last hidden layer representations in the CNN for two image classes. Here, we show the CNN’s internal representation of four important disease classes by applying t-SNE, a method for visualizing high-dimensional data, to the last hidden layer representation in the CNN. Colored point clouds represent the different image categories, showing how the algorithm clusters the images. Insets show images corresponding to various points.
Figure 7
Figure 7
An example of feature importance heatmap from Grad-CAM pipeline. The left panel is the original image; the middle panel is the heatmap (the yellower, the more important) and the right panel combines the original image and the heatmap to show the highlighted part of original image.

Similar articles

Cited by

References

    1. Consortium IS. Rare chromosomal deletions and duplications increase risk of schizophrenia. Nature 2008;455:237. - PMC - PubMed
    1. Yang T-L, Chen X-D, Guo Y, et al. . Genome-wide copy-number-variation study identified a susceptibility gene, UGT2B17, for osteoporosis. Am J Hum Genet 2008;83:663–74. - PMC - PubMed
    1. Pinto D, Darvishi K, Shi X, et al. . Comprehensive assessment of array-based platforms and calling algorithms for detection of copy number variants. Nat Biotechnol 2011;29:512. - PMC - PubMed
    1. Curtis C, Lynch AG, Dunning MJ, et al. . The pitfalls of platform comparison: DNA copy number array technologies assessed. BMC Genom 2009;10:588. - PMC - PubMed
    1. Hester SD, Reid L, Nowak N, et al. . Comparison of comparative genomic hybridization technologies across microarray platforms. J Biomol Tech 2009;20:135. - PMC - PubMed

Publication types