. 2021 May 10;31(6):2834-2844.
doi: 10.1093/cercor/bhaa391.

Heritability of Functional Connectivity in Resting State: Assessment of the Dynamic Mean, Dynamic Variance, and Static Connectivity across Networks

Affiliations

Heritability of Functional Connectivity in Resting State: Assessment of the Dynamic Mean, Dynamic Variance, and Static Connectivity across Networks

Anita D Barber et al. Cereb Cortex. .

Abstract

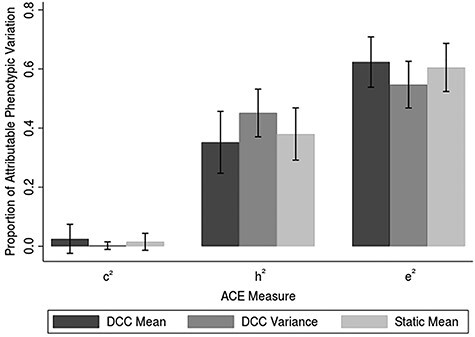
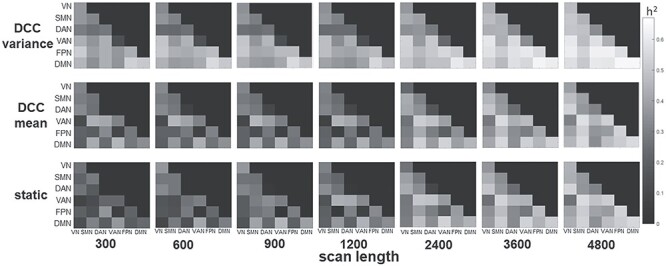
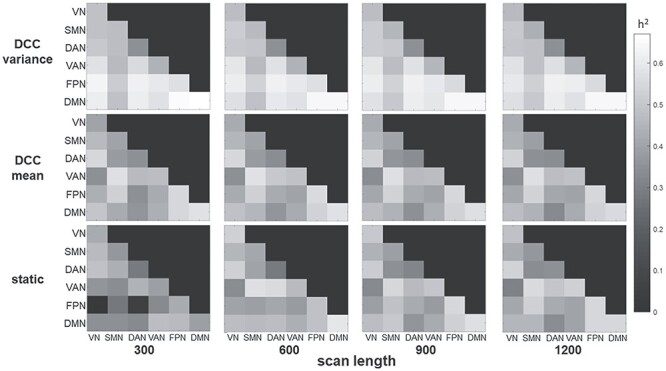
Recent efforts to evaluate the heritability of the brain's functional connectome have predominantly focused on static connectivity. However, evaluating connectivity changes across time can provide valuable insight about the inherent dynamic nature of brain function. Here, the heritability of Human Connectome Project resting-state fMRI data was examined to determine whether there is a genetic basis for dynamic fluctuations in functional connectivity. The dynamic connectivity variance, in addition to the dynamic mean and standard static connectivity, was evaluated. Heritability was estimated using Accelerated Permutation Inference for the ACE (APACE), which models the additive genetic (h2), common environmental (c2), and unique environmental (e2) variance. Heritability was moderate (mean h2: dynamic mean = 0.35, dynamic variance = 0.45, and static = 0.37) and tended to be greater for dynamic variance compared to either dynamic mean or static connectivity. Further, heritability of dynamic variance was reliable across both sessions for several network connections, particularly between higher-order cognitive and visual networks. For both dynamic mean and static connectivity, similar patterns of heritability were found across networks. The findings support the notion that dynamic connectivity is genetically influenced. The flexibility of network connections, not just their strength, is a heritable endophenotype that may predispose trait behavior.

Keywords: ACE; dynamic connectivity; heritability; resting state networks; static connectivity.


Figures

Figure 1
Figure 1
Schematic for data processing pipeline.
Figure 2
Figure 2
Relative contributions to connectivity measures. Bar graphs represent the averaged ACE measures across both sessions, with error bars reflecting standard deviation. For both sessions individually, heritability was higher for the DCC variance relative to DCC mean (session 1: t(20) = 2.20, P = 0.040; session 2: t(20) = 5.15, P = 4.88 × 10−5) and was higher for DCC variance relative to static connectivity (session 1: t(20) = 2.40, P = 0.026; session 2: t(20) = 2.87, P = 0.0095).Abbreviations: h2 = genetic variance, c2 = common environmental variance, e2 = unique environmental variance.
Figure 3
Figure 3
Heritability as a function of consecutive scan length. Connectivity values were computed for the first 300, 600, 900, 1200, 2400, 3600, or 4800 consecutive time points, resulting in 3.6, 7.2, 10.8, 14.4, 28.8, 43.2, or 57.6 min of data. The connectivity metrics were first computed over the consecutive scan length in each subject before performing APACE. Heritability based on consecutive scans required 2400–3600 time points (i.e., between 28 and 43 min of scanning) before the heritability measures became stable. This was the case for all 3 connectivity metrics although, as was consistently found in the current study, the DCC variability tended to result in higher heritability at all scan lengths, and required fewer time points to stabilize than DCC mean and static connectivity.
Figure 4
Figure 4
Heritability as a function of scan length averaged over 4 runs. Connectivity values were computed for the first 300, 600, 900, or 1200 time points of each run, resulting in 3.6, 7.2, 10.8, or 14.4 min of data per run (i.e., 14.4, 28.8, 43.2, or 57.6 min of data across the 4 runs). As with the primary analyses, the connectivity metrics were first computed within each run and then averaged across the 4 runs before performing APACE. Heritability values were generally stable across all scan lengths for the DCC metrics. Heritability values were tended to be lower for the scan length of 300 for static connectivity.

References

    1. Abou-Elseoud A, Starck T, Remes J, Nikkinen J, Tervonen O, Kiviniemi V. 2010. The effect of model order selection in group PICA. Hum Brain Mapp. 31:1207–1216. - PMC - PubMed
    1. Abou Elseoud A, Littow H, Remes J, Starck T, Nikkinen J, Nissila J, Timonen M, Tervonen O, Kiviniemi V. 2011. Group-ICA model order highlights patterns of functional brain connectivity. Front Syst Neurosci. 5:37. - PMC - PubMed
    1. Achterberg M, Bakermans-Kranenburg MJ, van Ijzendoorn MH, van der Meulen M, Tottenham N, Crone EA. 2018. Distinctive heritability patterns of subcortical-prefrontal cortex resting state connectivity in childhood: a twin study. Neuroimage. 175:138–149. - PubMed
    1. Adhikari BM, Jahanshad N, Shukla D, Glahn DC, Blangero J, Fox PT, Reynolds RC, Cox RW, Fieremans E, Veraart J et al. 2018. Comparison of heritability estimates on resting state fMRI connectivity phenotypes using the ENIGMA analysis pipeline. Hum Brain Mapp. 39:4893–4902. - PMC - PubMed
    1. Allen EA, Damaraju E, Plis SM, Erhardt EB, Eichele T, Calhoun VD. 2014. Trackgging whole-brain connectivity dynamics in the resting state. Cereb Cortex. 24:663–676. - PMC - PubMed

Publication types