Review
. 2021 Jan 7;13(2):177.
doi: 10.3390/cancers13020177.

CD73, Tumor Plasticity and Immune Evasion in Solid Cancers

Affiliations
Review

CD73, Tumor Plasticity and Immune Evasion in Solid Cancers

Haitang Yang et al. Cancers (Basel). .

Abstract

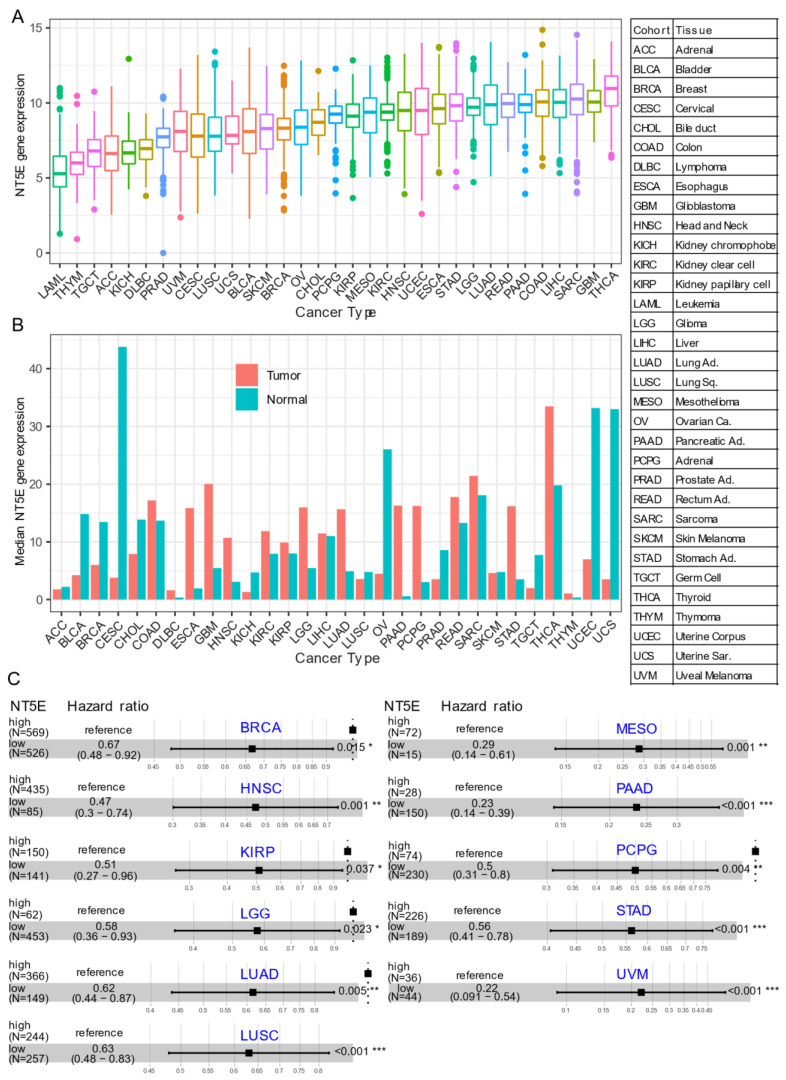
Regulatory networks controlling cellular plasticity, important during early development, can re-emerge after tissue injury and premalignant transformation. One such regulatory molecule is the cell surface ectoenzyme ecto-5'-nucleotidase that hydrolyzes the conversion of extracellular adenosine monophosphate to adenosine (eADO). Ecto-5'-nucleotidase (NT5E) or cluster of differentiation 73 (CD73), is an enzyme that is encoded by NT5E in humans. In normal tissue, CD73-mediated generation of eADO has important pleiotropic functions ranging from the promotion of cell growth and survival, to potent immunosuppression mediated through purinergic G protein-coupled adenosine receptors. Importantly, tumors also utilize several mechanisms mediated by CD73 to resist therapeutics and in particular, evade the host immune system, leading to undesired resistance to targeted therapy and immunotherapy. Tumor cell CD73 upregulation is associated with worse clinical outcomes in a variety of cancers. Emerging evidence indicates a link between tumor cell stemness with a limited host anti-tumor immune response. In this review, we provide an overview of a growing body of evidence supporting the pro-tumorigenic role of CD73 and adenosine signaling. We also discuss data that support a link between CD73 expression and tumor plasticity, contributing to dissemination as well as treatment resistance. Collectively, targeting CD73 may represent a novel treatment approach for solid cancers.

Keywords: CD73; cancer stemness; drug repurposing; immunotherapy; metastasis; targeted therapy; treatment resistance; tumor differentiation; tumor plasticity.


Conflict of interest statement

The authors declare no conflict of interest.

Figures

Figure 1
Figure 1
CD73 in human cancers. (A) NT5E (encoding CD73) gene expression across human solid tumors. Data were downloaded and reanalyzed from TCGA (The Cancer Genome Atlas Program) pan-cancer cohort. (B) Bar plot showing the NT5E gene expression in tumor compared with the matched normal tissue. The height of the bar represents the median expression of the indicated tumor type (red) or normal tissue (blue). (C) Forest blots showing the Cox proportional-hazards model-based survival analysis of cancer patients stratified by the gene expression of NT5E across the TCGA pan-solid cancer cohort. Only significant (p < 0.05) results were presented. The “high” and “low” expression groups were stratified by the optimal cutoff value using “survminer” and “survival” packages in R software. N, the total number in each group. Scale line indicates the 95% confidence interval for effect estimate for each survival-influencing factor with the hazard ratio showing to the right. ACC, adrenocortical carcinoma; BLCA, bladder urothelial carcinoma; BRCA, breast invasive carcinoma; CESC, cervical squamous cell carcinoma and endocervical adenocarcinoma; CHOL, cholangiocarcinoma; COAD, colon adenocarcinoma; ESCA, esophageal carcinoma; GBM, glioblastoma multiforme; HNSC, head and neck squamous cell carcinoma; KICH, kidney chromophobe; KIRC, kidney renal clear cell carcinoma; KIRP, kidney renal papillary cell carcinoma; LGG, brain lower grade glioma; LIHC, liver hepatocellular carcinoma; LUAD, lung adenocarcinoma; LUSC, lung squamous cell carcinoma; MESO, mesothelioma; OV, ovarian serous cystadenocarcinoma; PAAD, pancreatic adenocarcinoma; PCPG, pheochromocytoma and paraganglioma; PRAD, prostate adenocarcinoma; READ, rectum adenocarcinoma; SARC, sarcoma; SKCM, skin cutaneous melanoma; STAD, stomach adenocarcinoma; TGCT, testicular germ cell tumors; THCA, thyroid carcinoma; UCS, uterine carcinosarcoma; UCEC, uterine corpus endometrial carcinoma; UVM, uveal melanoma. Ca., carcinoma; Ad., adenocarcinoma; Sq., squamous; Sa., sarcoma. * p < 0.05, ** p < 0.01, *** p < 0.001. The detailed information about the bioinformatic analysis can be found in Appendix A.
Figure 2
Figure 2
CD73 and tumor stemness signature. (A,B) Correlation analysis of the stemness signature score and NT5E gene expression. Curated mRNA- (A) and epigenetics-based (B) stemness scores derived by the Stemness group were used (see the methods in Appendix A). (C) Correlation matrix showing the correlation between gene expression of NT5E and four classical transcription factors (OCT-3/4, KLF4, SOX2, and c-Myc) that reprogram pluripotent stem cells across several TCGA (The Cancer Genome Atlas) solid cancer types. Positive (in blue) and negative (in red) correlations are shown to the right, with color intensity and the size of the circle proportional to the correlation coefficient. Non-significant correlation coefficient values are left blank. On the right side of the correlogram, the legend color shows the correlation coefficients and the corresponding colors. p-value < 0.05 is considered significant. (D) Violin plots showing the association between NT5E gene expression and histological grades of TCGA PAAD (pancreatic adenocarcinoma) tumors. Note that the information on the histological grades is only available for several cancer types. The detailed information about the bioinformatic analysis can be found in Appendix A.
Figure 3
Figure 3
CD73 and tumor metastasis. (A) Correlation analysis of the epithelial-to-mesenchymal transition (EMT) and gene expression of NT5E across the TCGA pan-solid cancer cohort. Curated EMT signature score was used (see the methods in Appendix A). (B) NT5E gene expression across the metastatic tumors at different sites. MET500 cancer cohort was used, which provides the transcriptomic data of 500 adult patients with various metastatic solid tumors (see the methods in Appendix A). (C) NT5E gene expression across different secondary tumors with the same primary origin. (D) Pathway enrichment analysis of genes significantly positively (left) or negatively (right) correlated with NT5E gene expression in TCGA GBM (glioblastoma multiforme) tumors. The detailed information about the bioinformatic analysis can be found in the supplementary material.
Figure 4
Figure 4
CD73 and tumor immune microenvironment. (A) Percentage (NT5E expression low vs. high) of immune subtype models (C1–C6) across TCGA (The Cancer Genome Atlas) pan-cancer cohort. The genes contained in each signature were evaluated using model-based clustering by p the “mclust” R package. Each sample was finally to be grouped based on its predominance with the C1–C6 signature. The immune subtype models were based on Thorsson V et al. Immunity. 2018 (see the methods in Appendix A). (B) Systematic correlation analysis of immune infiltrates (Tregs [left], CD8+ [middle], CD4+ [right]) with gene expression of NT5E across TCGA pan-cancer cohort. The number of patients was shown in parenthesis. Data were downloaded from TIMER (version 2.0), a comprehensive resource for systematic analysis of immune infiltrates across diverse cancer types (http://timer.comp-genomics.org/) (Ref. [98]). The red color indicates a positive correlation, while the blue color represents a negative correlation. The detailed information about the bioinformatic analysis can be found in Appendix A.
Figure 5
Figure 5
Drug repurposing for CD73 targeted therapy. (A) Integrated correlation analysis of NT5E gene expression with drug (n = 481) response profiles (reflected by Z-score normalized area under the curve [AUC] value) across solid cancer cell lines (n = 659). Red dots indicate drugs whose AUC value significantly (adj. p < 0.05) positively correlates with NT5E gene expression, while the blue represent the significantly negatively correlated ones. The drug response data were downloaded from a previously published study (see the methods in Appendix A). (B) Drug repurposing identifying NT5E as one target of Pentoxifylline. Data were downloaded from ReframeDB database (https://reframedb.org/). The detailed information about the bioinformatic analysis can be found in Appendix A.

Similar articles

Cited by

References

    1. Yuan S., Norgard R.J., Stanger B.Z. Cellular Plasticity in Cancer. Cancer Discov. 2019;9:837–851. doi: 10.1158/2159-8290.CD-19-0015. - DOI - PMC - PubMed
    1. Nieto M.A., Huang R.Y., Jackson R.A., Thiery J.P. Emt: 2016. Cell. 2016;166:21–45. doi: 10.1016/j.cell.2016.06.028. - DOI - PubMed
    1. Lim J., Thiery J.P. Epithelial-mesenchymal transitions: Insights from development. Development. 2012;139:3471–3486. doi: 10.1242/dev.071209. - DOI - PubMed
    1. Dawson M.A., Kouzarides T. Cancer epigenetics: From mechanism to therapy. Cell. 2012;150:12–27. doi: 10.1016/j.cell.2012.06.013. - DOI - PubMed
    1. Boumahdi S., de Sauvage F.J. The great escape: Tumour cell plasticity in resistance to targeted therapy. Nat. Rev. Drug Discov. 2020;19:39–56. doi: 10.1038/s41573-019-0044-1. - DOI - PubMed

LinkOut - more resources