. 2021 Jan;14(1):e007022.
doi: 10.1161/CIRCHEARTFAILURE.120.007022. Epub 2021 Jan 12.

Proteomic and Functional Studies Reveal Detyrosinated Tubulin as Treatment Target in Sarcomere Mutation-Induced Hypertrophic Cardiomyopathy

Affiliations

Proteomic and Functional Studies Reveal Detyrosinated Tubulin as Treatment Target in Sarcomere Mutation-Induced Hypertrophic Cardiomyopathy

Maike Schuldt et al. Circ Heart Fail. 2021 Jan.

Abstract

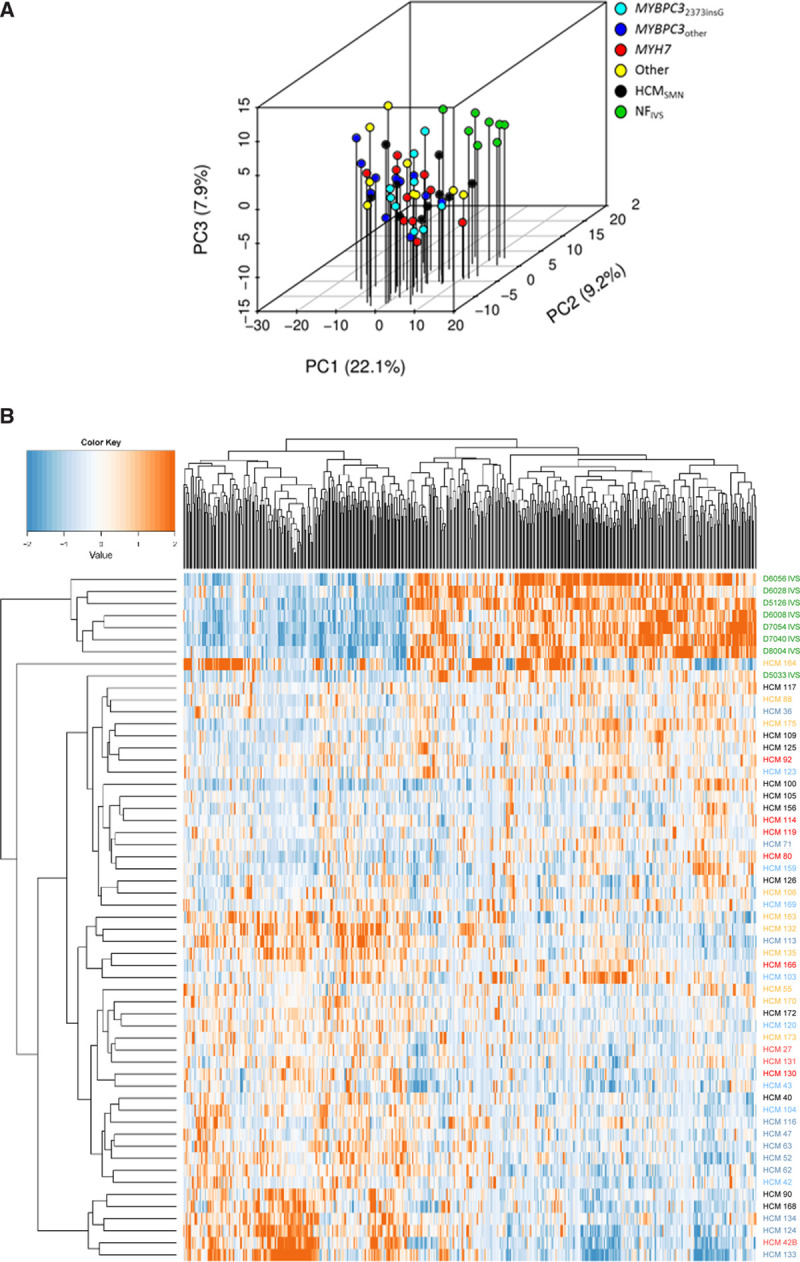
Background: Hypertrophic cardiomyopathy (HCM) is the most common genetic heart disease. While ≈50% of patients with HCM carry a sarcomere gene mutation (sarcomere mutation-positive, HCMSMP), the genetic background is unknown in the other half of the patients (sarcomere mutation-negative, HCMSMN). Genotype-specific differences have been reported in cardiac function. Moreover, HCMSMN patients have later disease onset and a better prognosis than HCMSMP patients. To define if genotype-specific derailments at the protein level may explain the heterogeneity in disease development, we performed a proteomic analysis in cardiac tissue from a clinically well-phenotyped HCM patient group.

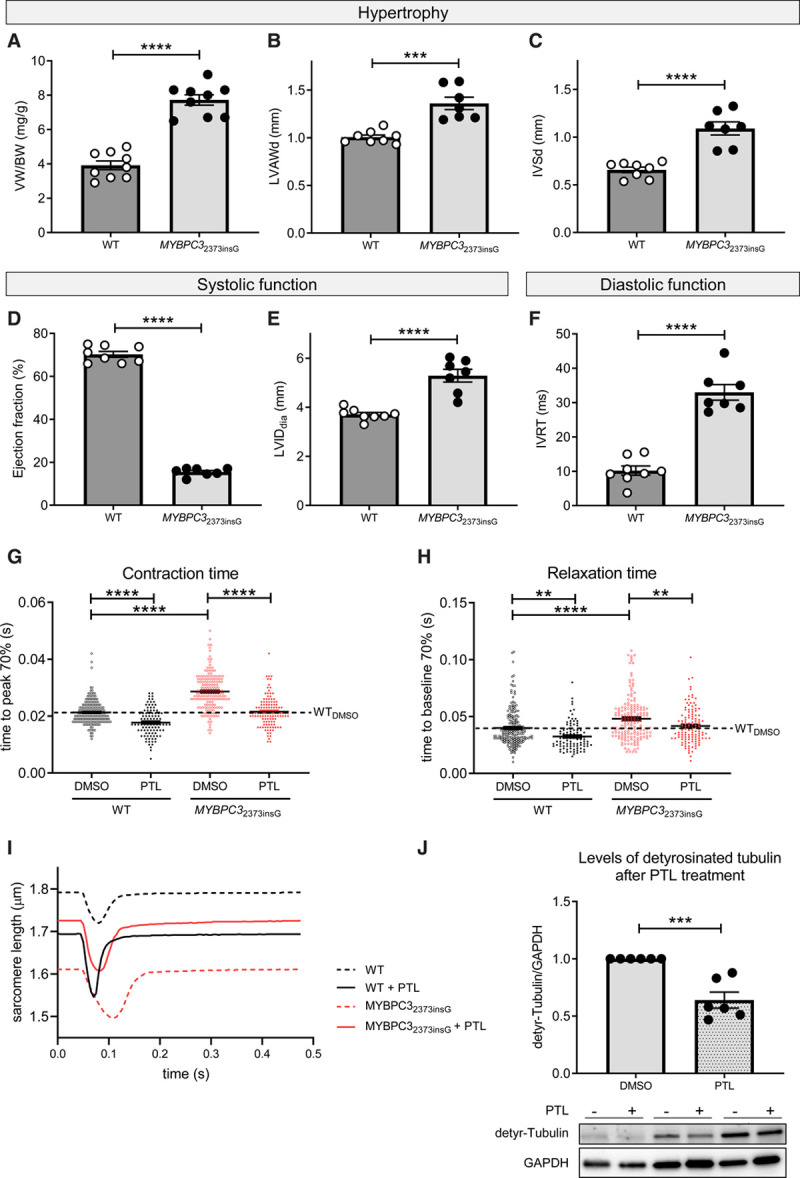
Methods: A proteomics screen was performed in cardiac tissue from 39 HCMSMP patients, 11HCMSMN patients, and 8 nonfailing controls. Patients with HCM had obstructive cardiomyopathy with left ventricular outflow tract obstruction and diastolic dysfunction. A novel MYBPC32373insG mouse model was used to confirm functional relevance of our proteomic findings.

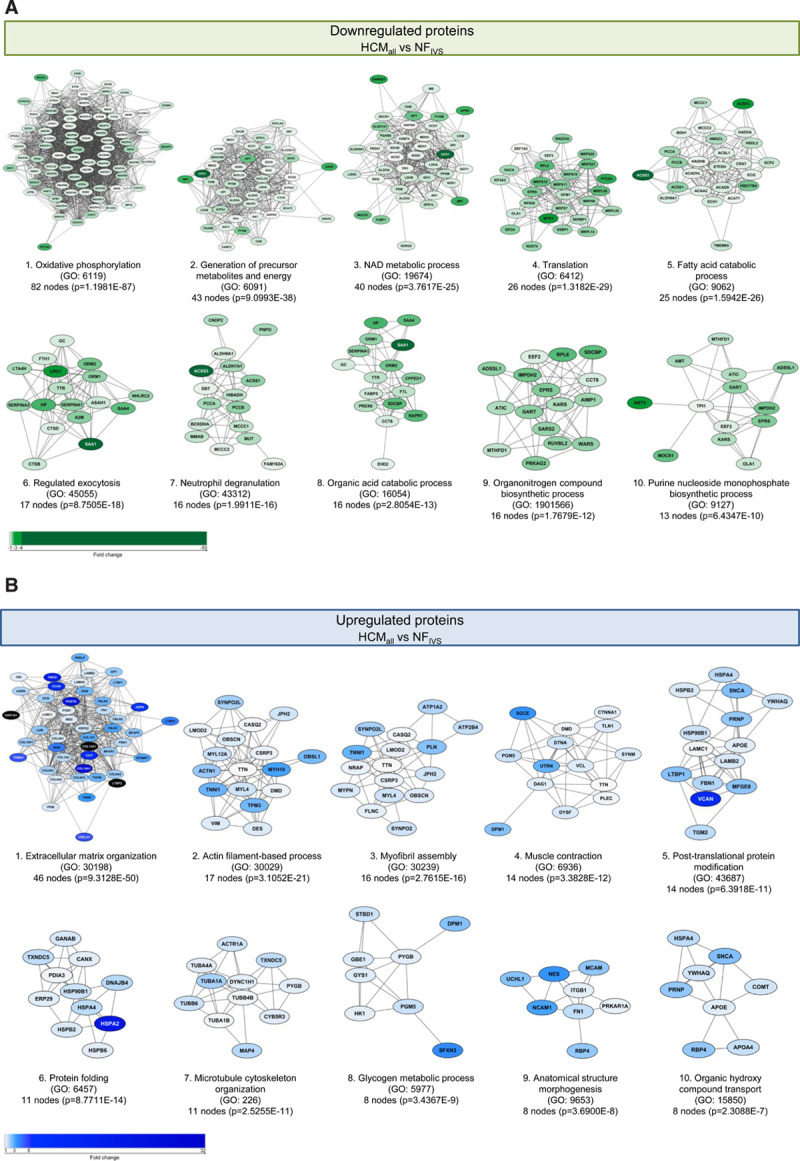
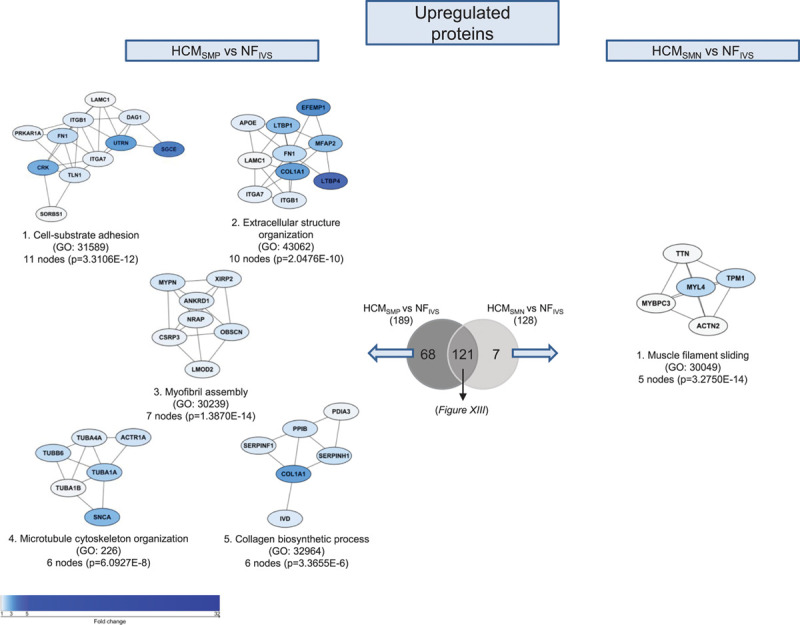
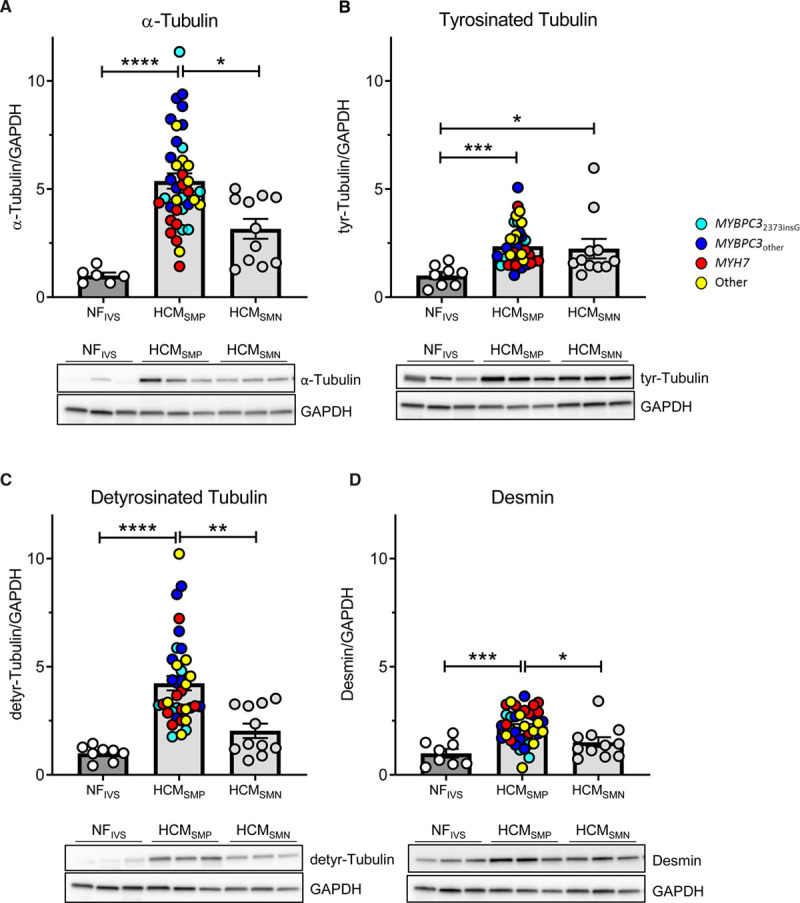
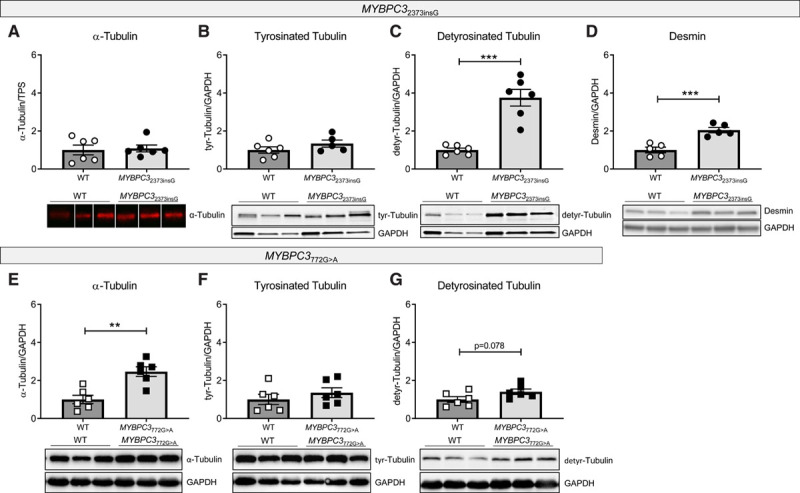
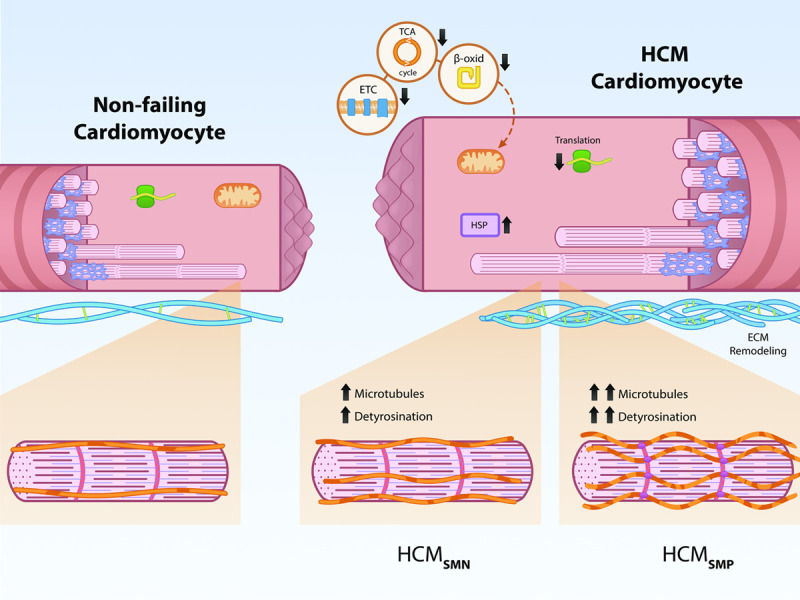
Results: In all HCM patient samples, we found lower levels of metabolic pathway proteins and higher levels of extracellular matrix proteins. Levels of total and detyrosinated α-tubulin were markedly higher in HCMSMP than in HCMSMN and controls. Higher tubulin detyrosination was also found in 2 unrelated MYBPC3 mouse models and its inhibition with parthenolide normalized contraction and relaxation time of isolated cardiomyocytes.

Conclusions: Our findings indicate that microtubules and especially its detyrosination contribute to the pathomechanism of patients with HCMSMP. This is of clinical importance since it represents a potential treatment target to improve cardiac function in patients with HCMSMP, whereas a beneficial effect may be limited in patients with HCMSMN.

Keywords: cardiomyopathies; genotype; heart diseases; mutation; proteomics; treatment; tubulin.


Conflict of interest statement

None.

Figures

Figure 1.
Figure 1.
Clustering of proteome of controls and patient samples. A, Principal component (PC) analysis of the filtered protein expression data reveals separate clustering of the nonfailing interventricular septum (NFIVS) samples (n=8) and the hypertrophic cardiomyopathy (HCM) samples (n=50) showing that the overall protein expression profile between NFIVS and HCM samples differs. HCM samples did not form separate clusters based on genotypes, indicating that genotype does not lead to major changes in protein expression profile. Also sarcomere mutation-positive (HCMSMP) and sarcomere mutation-negative (HCMSMN) samples do not show major differences at the overall protein expression profile as they cluster together. B, Hierarchical clustering of a multigroup comparison of all proteins that are differently expressed at P<0.05 when comparing all HCM (HCMall) with NFIVS. Hierarchical clustering of all significantly different proteins between HCMall and NFIVS shows that the NFIVS samples cluster together and are most different from the HCM samples. Also among this selection of proteins, the HCM samples do not cluster based on genotype or based on presence or absence of mutation (HCMSMP and HCMSMN).
Figure 2.
Figure 2.
Hypertrophic cardiomyopathy (HCM)-specific changes in biological processes. Protein interaction cluster of significantly different proteins between all HCM (HCMall) and nonfailing interventricular septum (NFIVS) were identified and are displayed with the most significant corresponding gene ontology (GO) term. A, Top 10 downregulated protein interaction cluster based on cluster size with the most significant biological process related to this cluster. B, Top 10 upregulated protein interaction cluster based on cluster size with the most significant biological process related to this cluster. The color gradient from light to dark indicates an increase in fold change.
Figure 3.
Figure 3.
Differences in upregulated proteins between patients with hypertrophic cardiomyopathy sarcomere mutation-positive (HCMSMP) and sarcomere mutation-negative (HCMSMN). Protein interaction cluster of proteins that are only significantly upregulated for the HCMSMP vs nonfailing interventricular septum (NFIVS) or the HCMSMN vs NFIVS comparison were identified and are displayed with the most significant corresponding gene ontology (GO) term. The top 5 protein interaction clusters of upregulated proteins are displayed The color gradient from light to dark indicates an increase in fold change.
Figure 4.
Figure 4.
Tubulin expression and post-translational modifications in patients with hypertrophic cardiomyopathy (HCM). Protein levels of α-tubulin (A), its tyrosinated (B) and detyrosinated forms (C) and desmin (D), all normalized to GAPDH, in tissue of patients with HCM. Kruskal-Wallis test with Dunn's multiple comparisons test, ****P<0.0001, ***P=0.0003 in (B), ***P=0.0009 in (D), **P=0.0074, *P=0.0437 in (A), *P=0.0499 in (B) and *P=0.0357 in (D). Average of the control group is set to 1. n(nonfailing interventricular septum [NFIVS]/HCMSMP/HCMSMN)=6/38/11 for (A), 8/36/11 for (B and C), 8/37/11 for (D). SMN indicates sarcomere mutation-negative; and SMP, sarcomere mutation-positive.
Figure 5.
Figure 5.
Tubulin composition in MYBPC32373insG and MYBPC3772G>A mouse models. Quantification and representative Western blot images of (A) α-tubulin, (B) tyrosinated tubulin, (C) detyrosinated tubulin, and (D) desmin in MYBPC32373insG mice and (E) α-tubulin, (F) tyrosinated tubulin and (G) detyrosinated tubulin in MYBPC3772G>A mice, respectively. A is normalized to total protein stain (TPS, image provided in Figure XVD in the Data Supplement). B–G are normalized to GAPDH. Lanes in A were run on the same gel but were noncontiguous. n(wild type [WT]/MYBPC32373insG/MYBPC3 772G>A)=6/6 (4 females, 2 males/3 females, 3 males of 20–27 wk for MYBPC32373insG and the corresponding WT; 2 females, 4 males for of 55–59 wk for MYBPC3772G>A and the corresponding WT) for (A, C, and E–G), 6/5 (4 females, 2 males/3 females, 2 males; 20–27 wk) for (B) and 5/5 (3 females, 2 males/2 females, 3 males; 20–27 wk) for (D), unpaired 2-tailed t test, ***P=0.0001 in (C) and P=0.009 in (D), **P=0.0014.
Figure 6.
Figure 6.
Morphometric and phenotypic analysis of MYBPC32373insG mice and contractile function of isolated MYBPC32373insG cardiomyocytes upon inhibition of tubulin detyrosination. Quantification of the hypertrophy parameters (A) ventricle weight (VW)/body weight (BW) ratio and (B) anterior wall thickness in diastole (LWADd) and (C) interventricular septum thickness in diastole (IVSd) measured by echocardiography. D and E show parameters of systolic function measured by ejection fraction and left ventricular internal diameter (LVID) and (F) displays diastolic function assessed by isovolumetric relaxation time (IVRT). n(wild type [WT]/MYBPC32373insG)=9/9 (4 females, 5 males; 20–27 wk) for (A) and 8/7 (3 females, 5 resp. 4 males; 25–27 wk) for (B–F), unpaired 2-tailed t test, ****P<0.0001, ***P=0.0001. G displays the effect of tubulin detyrosination inhibition by parthenolide (PTL) on the contractile parameter time to peak 70% and (H) on the diastolic parameter time to baseline 70%. The dotted line visualizes the WT baseline level. I shows example force transients for each condition of the single-cell measurements. For (G and H) N(WT mice)=4 (2 females and 2 males, 13–33 wk) with total n(cells dimethyl sulfoxide [DMSO]/PTL)=191/99 and N(MYBPC32373insG mice)=6 (2 females and 4 males, 13–35 wk) with total n(cells DMSO/PTL)=169/123. G and H were analyzed by 2-way ANOVA, **P<0.01, ****P<0.0001. J, Levels of detyrosinated tubulin normalized to GAPDH in isolated MYBPC32373insG cardiomyocytes upon inhibition of tubulin detyrosination by PTL. Every PTL treated sample was normalized to the DMSO control condition from the same animal. N(MYBPC32373insG mice)=6 (2 females, 4 males, 13–19 wk); J was analyzed with an unpaired 2-tailed t test, ***P=0.0004.
Figure 7.
Figure 7.
Schematic representation of genotype-independent changes in hypertrophic cardiomyopathy (HCM) and genotype-specific differences in the microtubular system. Our analysis shows that all patients with HCM display downregulation of metabolic pathways (electron transport chain [ETC], tricarboxylic acid [TCA] cycle, β-oxidation [β-oxid]) and ribosomal proteins (translation), as well as an upregulation of protein-folding proteins (HSPs [heat shock proteins]) and ECM (extracellular matrix) proteins. HCMSMP patients have a large increase in microtubules and levels of its detyrosinated form, whereas HCMSMN patients only have a slight increase compared with nonfailing controls.

Comment in

References

    1. Michels M, Olivotto I, Asselbergs FW, van der Velden J. Life-long tailoring of management for patients with hypertrophic cardiomyopathy: awareness and decision-making in changing scenarios. Neth Heart J. 2017;25:186–199. doi: 10.1007/s12471-016-0943-2 - PMC - PubMed
    1. Ingles J, Burns C, Barratt A, Semsarian C. Application of genetic testing in hypertrophic cardiomyopathy for preclinical disease detection. Circ Cardiovasc Genet. 2015;8:852–859. doi: 10.1161/CIRCGENETICS.115.001093 - PubMed
    1. Elliott PM, Anastasakis A, Borger MA, Borggrefe M, Cecchi F, Charron P, Hagege AA, Lafont A, Limongelli G, Mahrholdt H, et al. ; Authors/Task Force. 2014 ESC Guidelines on diagnosis and management of hypertrophic cardiomyopathy: the Task Force for the Diagnosis and Management of Hypertrophic Cardiomyopathy of the European Society of Cardiology (ESC). Eur Heart J. 2014;35:2733–2779. doi: 10.1093/eurheartj/ehu284 - PubMed
    1. Richard P, Charron P, Carrier L, Ledeuil C, Cheav T, Pichereau C, Benaiche A, Isnard R, Dubourg O, Burban M, et al. ; EUROGENE Heart Failure Project. Hypertrophic cardiomyopathy: distribution of disease genes, spectrum of mutations, and implications for a molecular diagnosis strategy. Circulation. 2003;107:2227–2232. doi: 10.1161/01.CIR.0000066323.15244.54 - PubMed
    1. Vakrou S, Fukunaga R, Foster DB, Sorensen L, Liu Y, Guan Y, Woldemichael K, Pineda-Reyes R, Liu T, Tardiff JC, et al. Allele-specific differences in transcriptome, miRNome, and mitochondrial function in two hypertrophic cardiomyopathy mouse models. JCI Insight. 2018;3doi: 10.1172/jci.insight.94493 - PMC - PubMed

Publication types

MeSH terms