

Recent incidence trend of elderly patients with glioblastoma in the United States, 2000-2017
- PMID: 33430813
- PMCID: PMC7802341
- DOI: 10.1186/s12885-020-07778-1
Recent incidence trend of elderly patients with glioblastoma in the United States, 2000-2017
Abstract
Background: The incidence of glioblastoma increases significantly with age. With the growing and aging population, there is a lack of comprehensive analysis of recent glioblastoma incidence trend in the United States. This study aims to provide in-depth description of the patterns of incidence trends and to examine the age-period-cohort effects to the trends of glioblastoma specific to elderly patients.
Methods: The incidence rates were age-adjusted and reported per 100,000 population. We calculated the annual percent change (APC) in incidence using the Joinpoint Regression Program and conducted an age-period-cohort analysis of elderly glioblastoma reported between 2000 and 2017 to the Surveillance Epidemiology and End Results (SEER) 18 registry database.
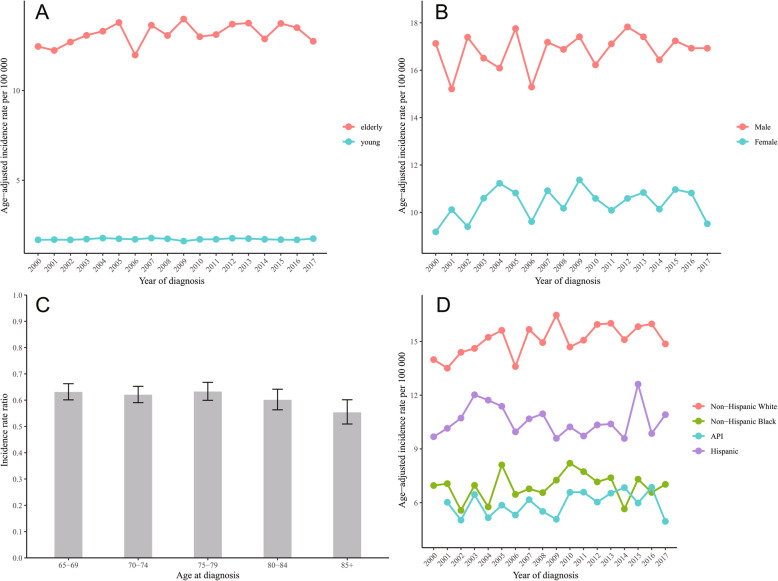
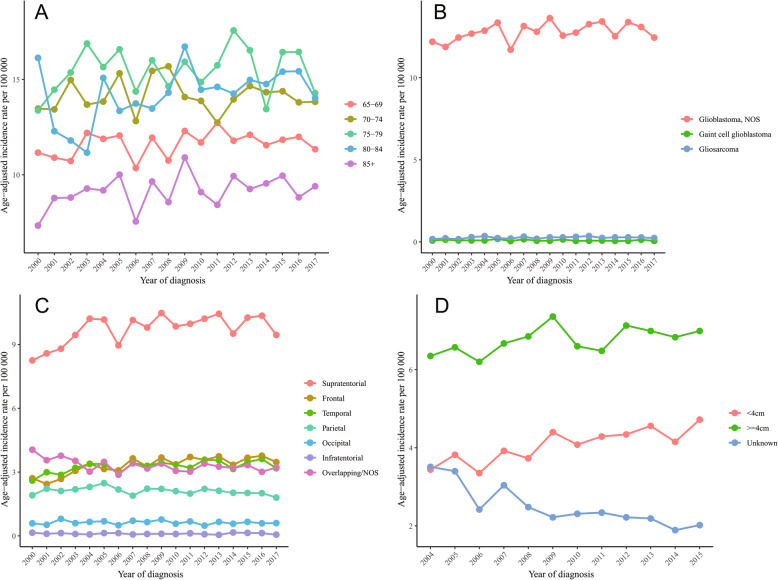
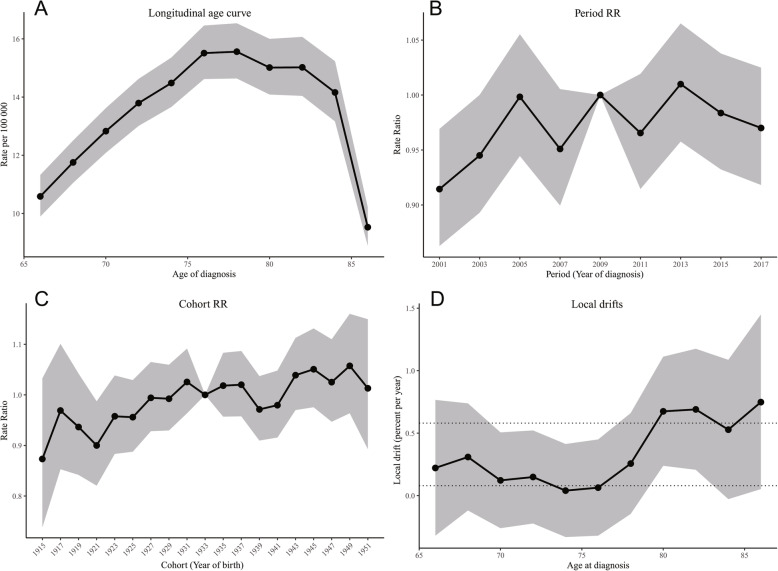
Results: The overall incidence rate of elderly patients with glioblastoma was 13.16 per 100,000 (95% CI, 12.99-13.32) from 2000 to 2017. Non-Hispanic whites (20,406, 83.6%) made up the majority. The incidence rate of male was about 1.62 times that of female. The trend of incidence remained stable and there was a non-significant increasing tendency for all elderly patients (APC 0.3, 95% CI, - 0.1 to 0.7, p = 0.111). There was a significantly increasing incidence trend for non-Hispanic white (APC 0.6, 95% CI, 0.2 to 1.1, p = 0.013), supratentorial location (APC 0.7, 95% CI, 0.2 to 1.3, p = 0.016), tumor size < 4 cm (APC 2.5, 95% CI, 1.4 to 3.6, p < 0.001), and a significantly decreasing trend for overlapping/NOS location (APC -0.9, 95% CI, - 1.6 to - 0.2, p = 0.012), and unknown tumor size (APC -4.9, 95% CI, - 6.6 to - 3.3, p < 0.001). The age-period-cohort analysis showed the effect of age on incidence trends (p< 0.001, Wald test), while did not indicate the period and cohort effects of the incidence trends of glioblastoma (p = 0.063 and p =0.536, respectively, Wald test).
Conclusion: The overall incidence of glioblastoma in the elderly population remained stable between 2000 and 2017. Period and cohort effects were not evident in the trend of glioblastoma incidence. Future population-based studies exploring the difference in the trend of glioblastoma incidence by specific molecular subgroups are warranted to further our understanding of the etiology of glioblastoma.
Keywords: Age-adjusted incidence rate; Age-period-cohort analysis; Annual percentage change; Elderly; Glioblastoma; Join-point analysis; SEER.
Conflict of interest statement
The authors declare that they have no competing interests.
Figures
References
-
- Paszat L, Laperriere N, Groome P, Schulze K, Mackillop W, Holowaty E. A population-based study of glioblastoma multiforme. Int J Radiat Oncol Biol Phys. 2001;51(1):100–107. - PubMed
-
- Stupp R, Mason WP, van den Bent MJ, Weller M, Fisher B, Taphoorn MJ, Belanger K, Brandes AA, Marosi C, Bogdahn U, et al. Radiotherapy plus concomitant and adjuvant temozolomide for glioblastoma. New England J Med. 2005;352(10):987–996. - PubMed
MeSH terms
Grants and funding
LinkOut - more resources
Full Text Sources
Other Literature Sources
