

Spatio-temporal analysis of the main dengue vector populations in Singapore
- PMID: 33430945
- PMCID: PMC7802191
- DOI: 10.1186/s13071-020-04554-9
Spatio-temporal analysis of the main dengue vector populations in Singapore
Abstract
Background: Despite the licensure of the world's first dengue vaccine and the current development of additional vaccine candidates, successful Aedes control remains critical to the reduction of dengue virus transmission. To date, there is still limited literature that attempts to explain the spatio-temporal population dynamics of Aedes mosquitoes within a single city, which hinders the development of more effective citywide vector control strategies. Narrowing this knowledge gap requires consistent and longitudinal measurement of Aedes abundance across the city as well as examination of relationships between variables on a much finer scale.
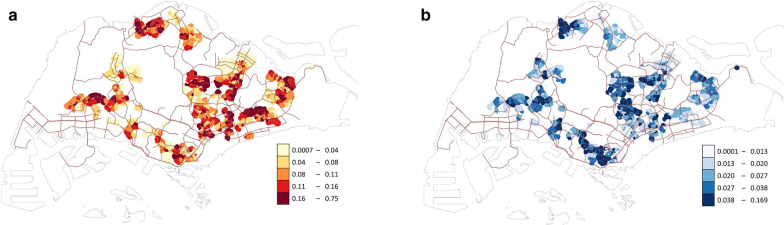
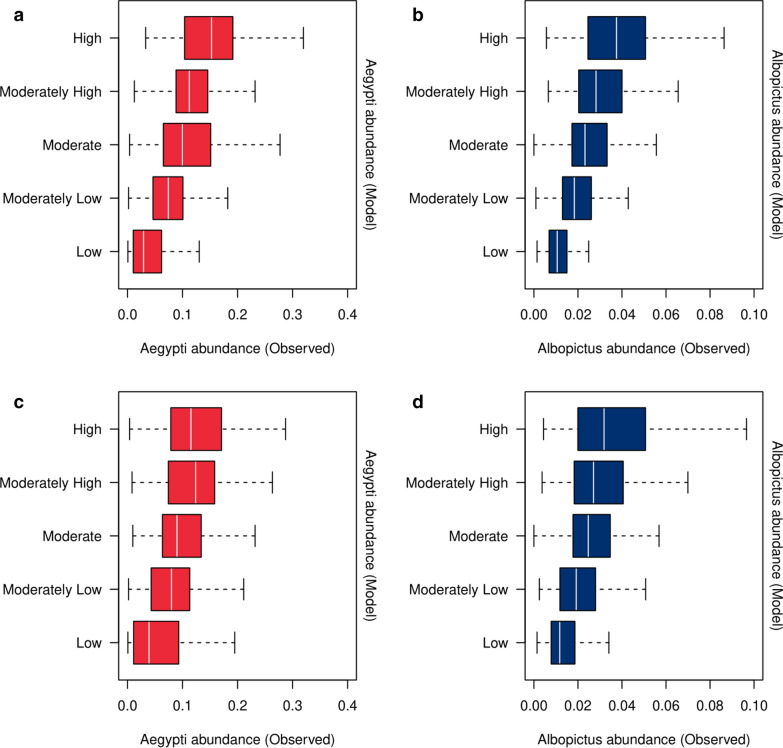
Methods: We utilized a high-resolution longitudinal dataset generated from Singapore's islandwide Gravitrap surveillance system over a 2-year period and built a Bayesian hierarchical model to explain the spatio-temporal dynamics of Aedes aegypti and Aedes albopictus in relation to a wide range of environmental and anthropogenic variables. We also created a baseline during our model assessment to serve as a benchmark to be compared with the model's out-of-sample prediction/forecast accuracy as measured by the mean absolute error.
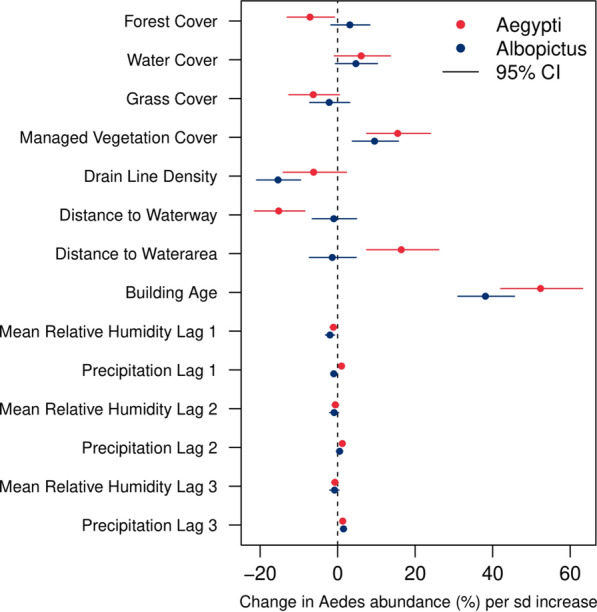
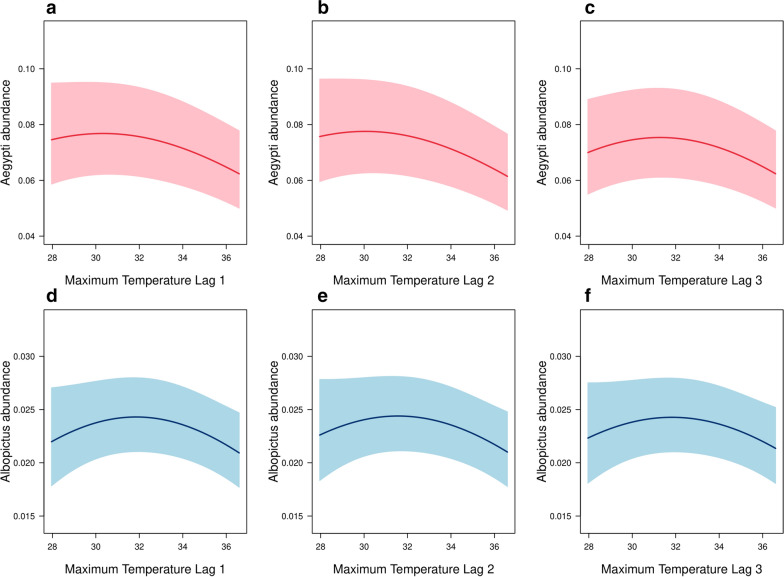
Results: For both Aedes species, building age and nearby managed vegetation cover were found to have a significant positive association with the mean mosquito abundance, with the former being the strongest predictor. We also observed substantial evidence of a nonlinear effect of weekly maximum temperature on the Aedes abundance. Our models generally yielded modest but statistically significant reductions in the out-of-sample prediction/forecast error relative to the baseline.
Conclusions: Our findings suggest that public residential estates with older buildings and more nearby managed vegetation should be prioritized for vector control inspections and community advocacy to reduce the abundance of Aedes mosquitoes and the risk of dengue transmission.
Keywords: Aedes; Dengue; Spatio-temporal modeling; Vector control.
Conflict of interest statement
The authors declare that they have no competing interests.
Figures
References
-
- World Health Organization (2009) Dengue: guidelines for diagnosis, treatment, prevention, and control. WHO/HTM/NTD/DEN/20091. - PubMed
-
- World Health Organization (2018) Questions and Answers on Dengue Vaccines. In: Immunization, Vaccines Biol. https://www.who.int/immunization/research/development/dengue_q_and_a/en/. Accessed 30 Jun 2020.
MeSH terms
Grants and funding
LinkOut - more resources
Full Text Sources
Other Literature Sources
Medical
Miscellaneous
