Review
. 2020 Sep 17;12(1):56.
doi: 10.1186/s13321-020-00460-5.

Molecular representations in AI-driven drug discovery: a review and practical guide

Affiliations
Review

Molecular representations in AI-driven drug discovery: a review and practical guide

Laurianne David et al. J Cheminform. .

Abstract

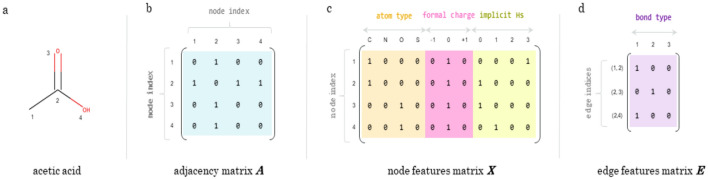
The technological advances of the past century, marked by the computer revolution and the advent of high-throughput screening technologies in drug discovery, opened the path to the computational analysis and visualization of bioactive molecules. For this purpose, it became necessary to represent molecules in a syntax that would be readable by computers and understandable by scientists of various fields. A large number of chemical representations have been developed over the years, their numerosity being due to the fast development of computers and the complexity of producing a representation that encompasses all structural and chemical characteristics. We present here some of the most popular electronic molecular and macromolecular representations used in drug discovery, many of which are based on graph representations. Furthermore, we describe applications of these representations in AI-driven drug discovery. Our aim is to provide a brief guide on structural representations that are essential to the practice of AI in drug discovery. This review serves as a guide for researchers who have little experience with the handling of chemical representations and plan to work on applications at the interface of these fields.

Keywords: Artificial intelligence; Cheminformatics; Drug discovery; Linear notation; Macromolecules; Molecular graphs; Molecular representation; Reaction prediction; Small molecules.


Conflict of interest statement

All the authors were employed by AstraZeneca and declare no competing interests.

Figures

Fig. 1
Fig. 1
Example graph representation for acetic acid. a Graph representation of acetic acid with nodes numbered from one to four. b Example adjacency matrix, A, for an acetic acid graph with the corresponding node ordering on the left. c Example node features matrix, X, which one-hot encodes a few selected properties. d Example edge features matrix, E, where each edge feature vector is a one-hot encoding of single, double, or triple bonds. “Implicit Hs” stands for the number of implicit hydrogens on a given node
Fig. 2
Fig. 2
Graph traversal algorithms. Three widespread graph traversal algorithms are illustrated above for an example branched graph. The numbers correspond to the order in which the nodes are explored, starting at node 1. a A depth-first search first explores each “branch” of a graph to the fullest extent, then goes back and explores branches at the last branched node, until all branches have been explored. b A breadth-first search first explores all nearest neighbours of a node, and then the nearest neighbours of the nearest neighbours, and so on, until the whole graph has been explored. c A random search explores nodes in the graph in an arbitrary order, regardless of how they are connected
Fig. 3
Fig. 3
The MDL family of file formats are collectively known as CTfiles (chemical table files) as they are built upon connection tables (Ctab), shown at the top of the figure. The connection table is split into an atom and bond block, describing the atoms and their corresponding connectivity. The Ctab is built upon to form the Molfile for the description of single molecules, RGfile for handling queries, SDfile for structure and associated data, RXNfile for the description of single reactions, RDfile for either a series of molecules/reactions and their associated data, and the XDfile for the transfer of structure or reaction data based on the XML format
Fig. 4
Fig. 4
Canonical (a) and randomized (b) SMILES representations of aspirin. Randomized SMILES correspond to the various representations of a molecule obtained by randomly selecting the starting node in the graph traversal algorithm, thus changing the order of the nodes traversed in the molecular graph (still using depth-first search). Numbers represent the order of graph traversal, where 1 is the initial node (user defined). Considering a as being the canonical representation of aspirin, b shows a different ordering of the atoms of the molecule. The final SMILES is one possible SMILES among all the randomized SMILES which can be generated. Green arrows indicate how the molecular graph is traversed. Both SMILES strings shown represent the same molecule but, as the atom numberings are different, the generated SMILES strings are, too. The original figure can be found in [47]
Fig. 5
Fig. 5
InChI notation of aspirin. Red letters are the standard beginning of the notation. The following 1 corresponds to the InChI version number, and S states that the notation is a standard InChI. Slashes (blue) are delimiters
Fig. 6
Fig. 6
A selection of representations for a simple esterification reaction. The atom mapped reaction is shown in the top left as a structural diagram. The atom maps are consistent between reactant and product as shown. The atom maps in the SMIRKS do not correspond to the atom maps in the full reaction. Rather, they are used to keep track of the atoms within the SMIRKS. The condensed reaction graph and corresponding signature was generated using CGRtools [73]
Fig. 7
Fig. 7
Atomic environments included in the description of the reaction centre. The reaction centre is used in calculations of atom hash codes for varying degrees of specificity
Fig. 8
Fig. 8
Example of linear notations for different types of macromolecules. Cyclosporin is an immunosuppressant medication and natural product. Lactose is a disaccharide used in the food industry. Insulin is a peptide hormone which regulates the metabolism of carbohydrates, fats, and protein. pHEMA or poly(2-hydroxyethyl methacrylate) is a polymer that forms hydrogel in water. Copolymers of pHEMA are used to make contact lenses
Fig. 9
Fig. 9
Graph and HELM representation of a biphalin analog. Amino acids are coloured coded as followed: blue, green, red, and pink for tyrosine (Y), alanine (A), glycine (G), and phenylalanine (F), respectively)
Fig. 10
Fig. 10
Examples of various molecules drawn using different display types. bd Generated with Avogadro [32]. a Skeletal structure of the Fe-porphyrin subunit of haem B. b Ribbon diagram of haemoglobin. c Space-filling model of the Fe-porphyrin subunit of haem B. d Ball-and-stick model of the Fe-porphyrin subunit of haem B. Note the different orientations. e 2D visualization of protein–ligand interactions (PDB code: 2HPS). Reprinted with permission from [115]. Copyright 2020 American Chemical Society. f 3D visualization of protein–ligand interactions (PDB code: 6KYA)

References

    1. Lawlor B. The chemical structure association trust. Chem Int. 2016;38(2):12–15. doi: 10.1515/ci-2016-0206. - DOI
    1. Wiswesser WJ. 107 years of line-formula notations (1861–968) J Chem Doc. 1968;8(3):146–150. doi: 10.1021/c160030a007. - DOI
    1. Zhou P, Shang Z. 2D molecular graphics: a flattened world of chemistry and biology - PubMed
    1. Clark AM, Labute P, Santavy M. 2D structure depiction. J Chem Inf Model. 2006;46(3):1107–1123. doi: 10.1021/ci050550m. - DOI - PubMed
    1. RasMol and OpenRasMol. http://www.openrasmol.org/. Accessed 27 Apr 2020.

LinkOut - more resources