. 2021 May;11(5):1118-1137.
doi: 10.1158/2159-8290.CD-20-0751. Epub 2021 Jan 11.

Targeting the p300/CBP Axis in Lethal Prostate Cancer

Affiliations

Targeting the p300/CBP Axis in Lethal Prostate Cancer

Jonathan Welti et al. Cancer Discov. 2021 May.

Abstract

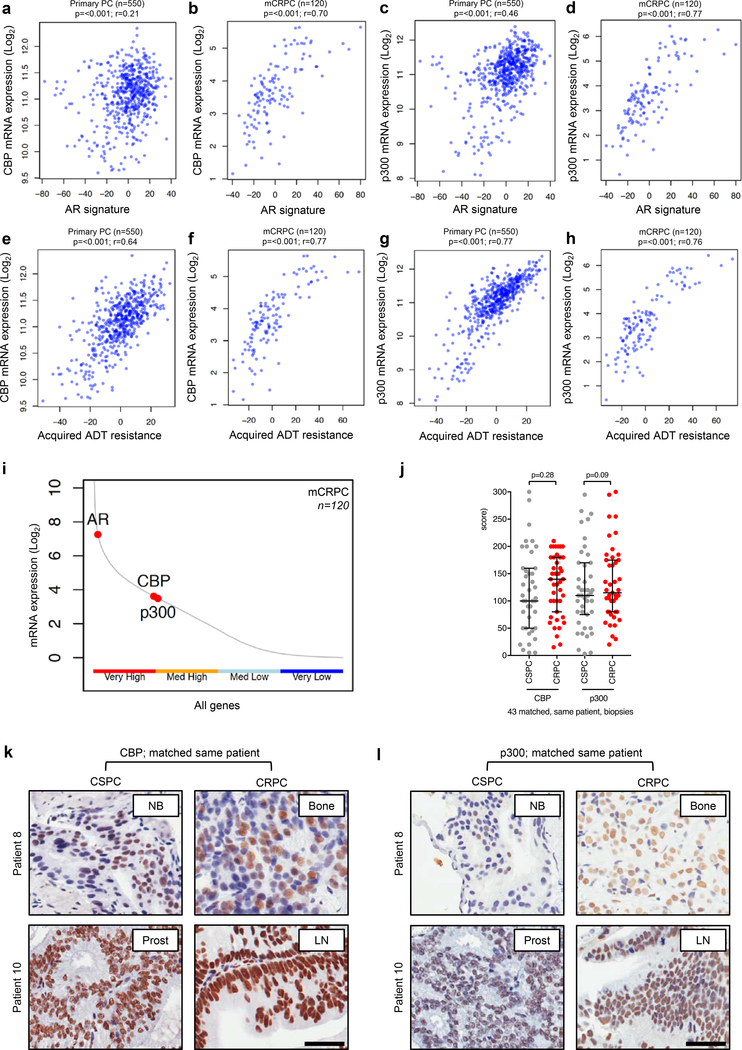
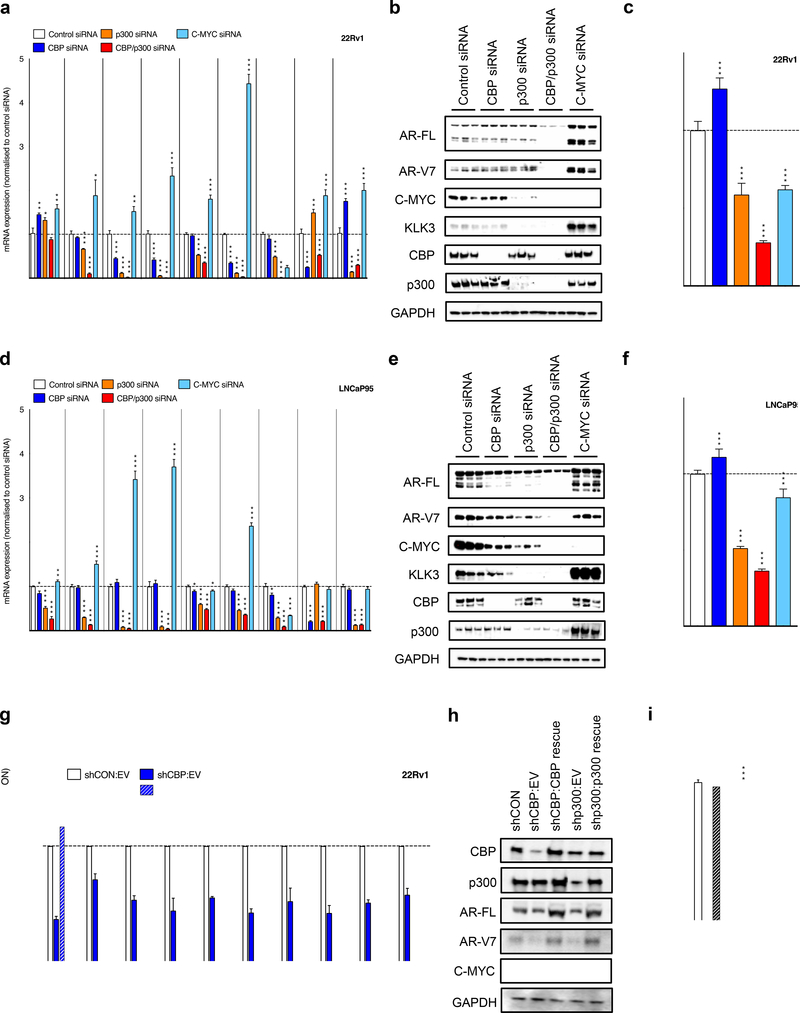
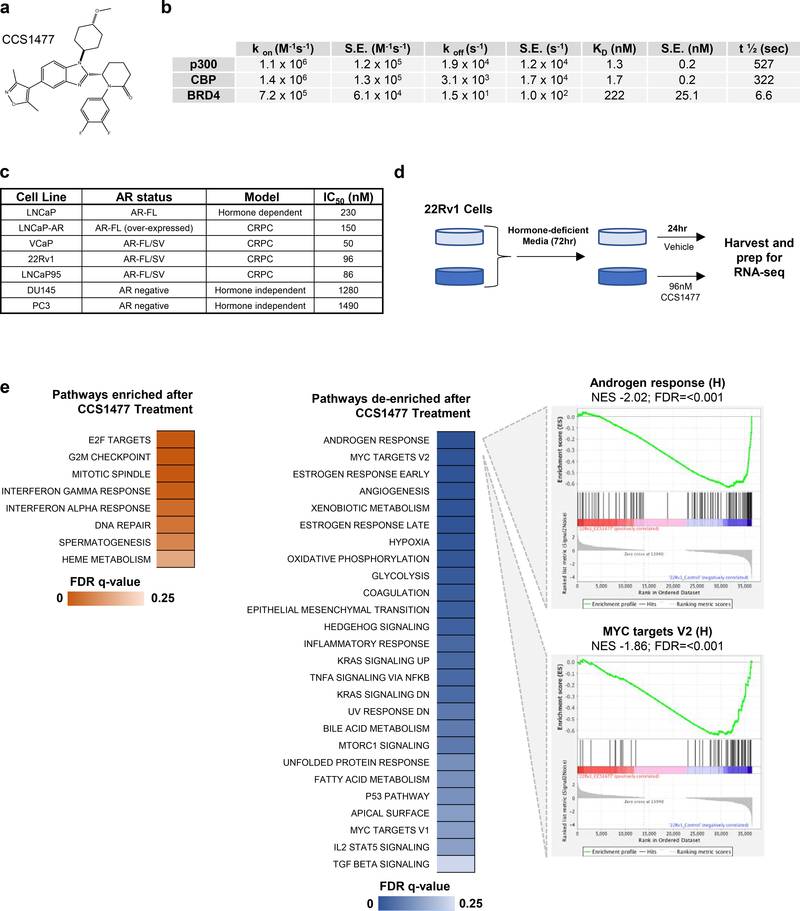
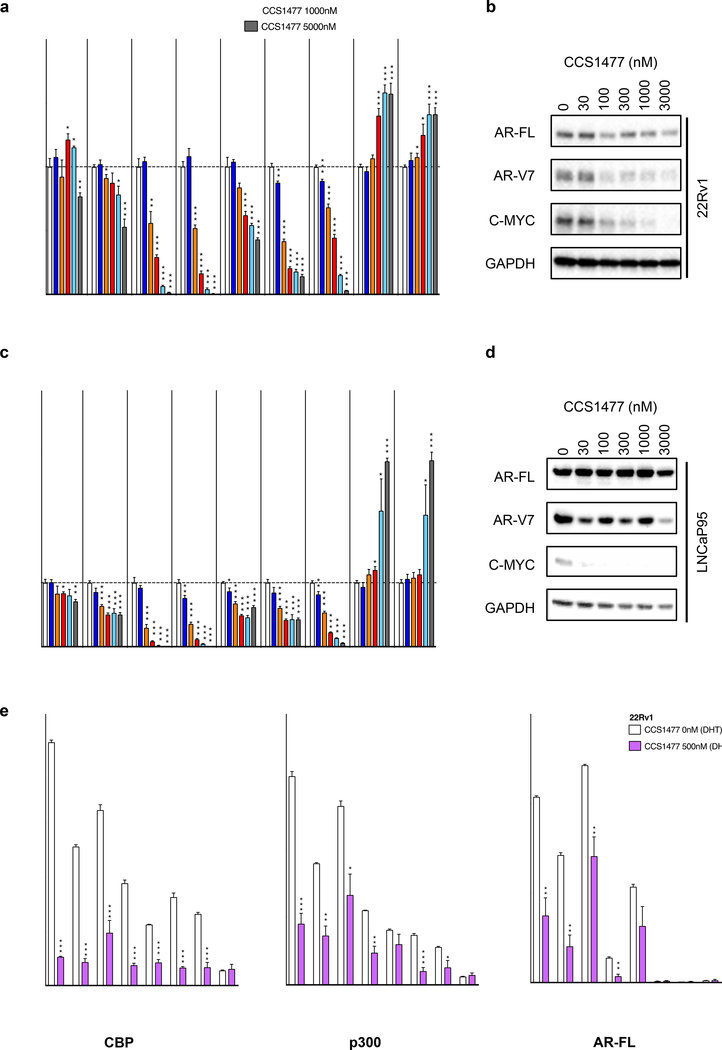
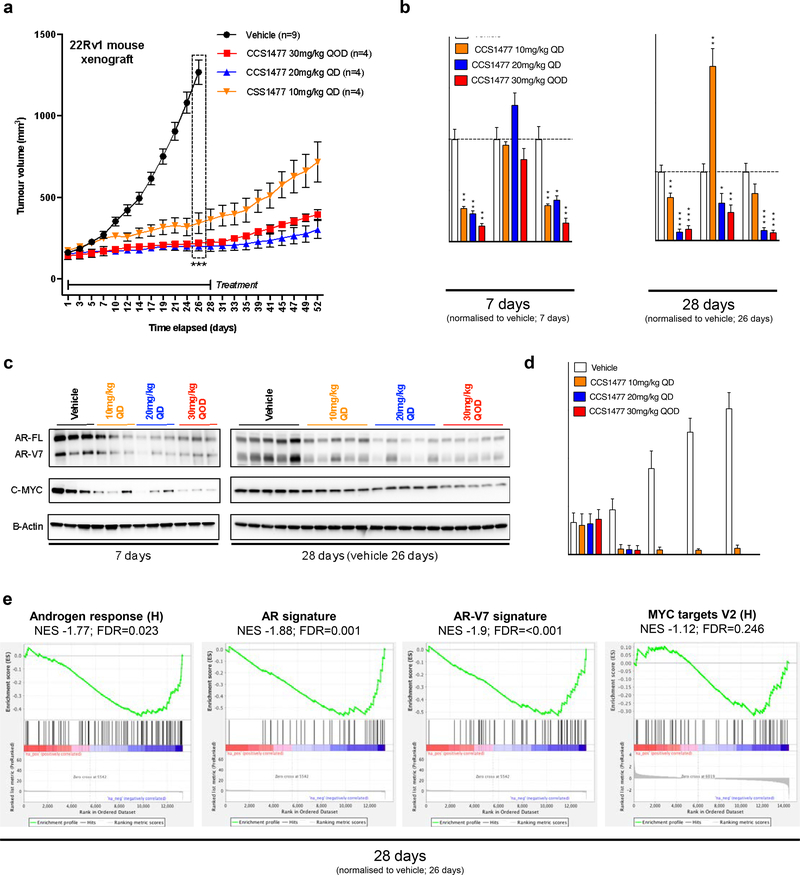
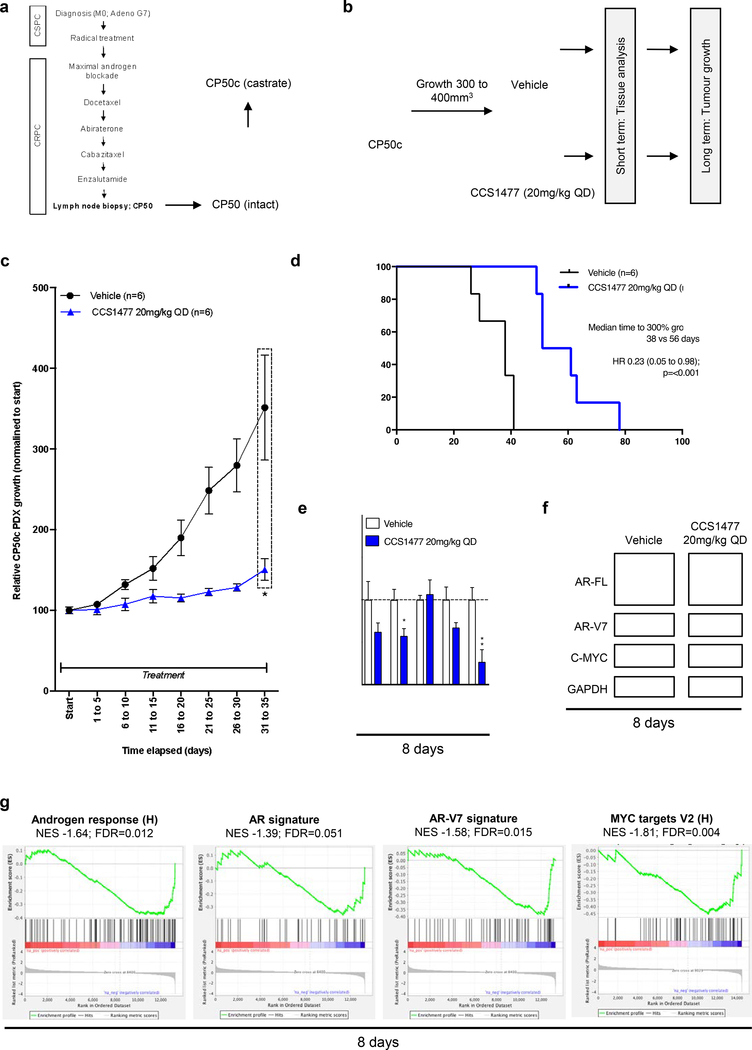
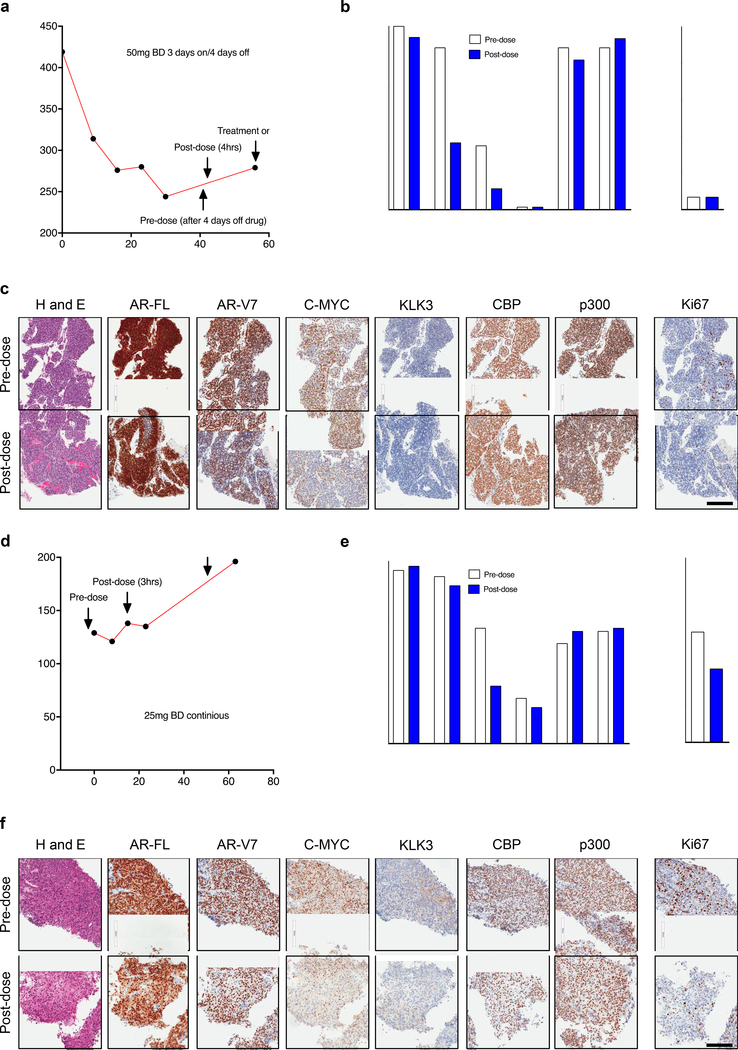
Resistance to androgen receptor (AR) blockade in castration-resistant prostate cancer (CRPC) is associated with sustained AR signaling, including through alternative splicing of AR (AR-SV). Inhibitors of transcriptional coactivators that regulate AR activity, including the paralog histone acetyltransferase proteins p300 and CBP, are attractive therapeutic targets for lethal prostate cancer. Herein, we validate targeting p300/CBP as a therapeutic strategy for lethal prostate cancer and describe CCS1477, a novel small-molecule inhibitor of the p300/CBP conserved bromodomain. We show that CCS1477 inhibits cell proliferation in prostate cancer cell lines and decreases AR- and C-MYC-regulated gene expression. In AR-SV-driven models, CCS1477 has antitumor activity, regulating AR and C-MYC signaling. Early clinical studies suggest that CCS1477 modulates KLK3 blood levels and regulates CRPC biopsy biomarker expression. Overall, CCS1477 shows promise for the treatment of patients with advanced prostate cancer. SIGNIFICANCE: Treating CRPC remains challenging due to persistent AR signaling. Inhibiting transcriptional AR coactivators is an attractive therapeutic strategy. CCS1477, an inhibitor of p300/CBP, inhibits growth and AR activity in CRPC models, and can affect metastatic CRPC target expression in serial clinical biopsies.See related commentary by Rasool et al., p. 1011.This article is highlighted in the In This Issue feature, p. 995.


Figures

Figure 1:
Figure 1:. CBP and p300 expression and association with AR activity and acquired endocrine resistance in primary, and castration resistant, prostate cancer.
(a-d) Association between primary prostate cancer (PC) CBP (a), metastatic castration resistant prostate cancer (mCRPC) CBP (b), primary PC p300 (c), and mCRPC p300 (d) expression levels with androgen receptor (AR) signature from either TCGA primary PC expression data (a, c; n=550) or SU2C/PCF mCRPC expression data (b, d; n=120). r-values and p-values are shown and were calculated using Spearman’s correlation. (e-h) Association between primary prostate cancer (PC) CBP (e), metastatic castration resistant prostate cancer (mCRPC) CBP (f), primary PC p300 (g), and mCRPC p300 (h) expression levels with acquired androgen deprivation therapy (ADT) resistance signature from either TCGA primary PC expression data (e, g; n=550) or SU2C/PCF mCRPC expression data (f, h; n=120). r-values and p-values are shown and were calculated using Spearman’s correlation. (i) SU2C/PCF mCRPC transcriptome analyses of RNA-sequencing data from 120 patient biopsies for CBP, p300 and AR expression divided into very high (upper 25% expressed genes), medium high (50%−75% expressed genes), medium low (25%−50% expressed genes) and very low (lower 25% expressed genes). (j) Nuclear protein expression (H-score) of CBP and p300 in 43 matched, same patient, castration sensitive prostate cancer (CSPC; grey) and CRPC (red). Median H-score and interquartile range is shown. p-values were calculated using Wilcoxon matched-pair signed rank test. (k-l) Representative micrographs of CBP and p300 detection by immunohistochemistry in matched, same patient, CSPC and CRPC biopsies. Needle biopsies (NB), prostatectomies (prost), bone biopsies (bone) and lymph node biopsies (LN) are shown. Scale bar represents 50 μm.
Figure 2:
Figure 2:. CBP and p300 protein knockdown impacts AR-V7 expression and AR signaling independent of C-MYC expression in castration resistant prostate cancer models.
(a-c) 22Rv1 and (d-f) LNCaP95 were transfected with a total of 100nM siRNA with 50nM of either CBP, p300, p300 plus CBP, or C-MYC siRNA (made up to total with Control siRNA) for 72 hours. The effect of each condition on AR-FL, AR-V7, KLK2, KLK3, FKBP5, TMPRSS2, C-MYC, CBP and p300 mRNA expression (22Rv1 a; LNCaP95 d) and AR- FL, AR-V7, C-MYC, KLK3, CBP, p300 and GAPDH protein expression was determined (22Rv1 b; LNCaP95 e). Mean mRNA expression (normalized to an average of B2M/GAPDH/HPRT1 and control siRNA; defined as 1.0) with standard error of mean from three individual experiments is shown. Growth assays by CellTitre-Glo were carried out (22Rv1 c; LNCaP95 f) (normalized to control siRNA; defined as 1.0) with standard deviation of an individual experiment with six replicates is shown. p-values (*p=<0.05, **p=<0.01, ***p=<0.001) were calculated for each condition compared to control siRNA (at equivalent concentration) using unpaired student t-test. Western blots are shown in triplicate. (g-i) 22Rv1 cells with doxycycline-inducible short hairpin (sh) RNA to Control (shCON), CBP (shCBP) or p300 (shp300) were treated with 10ng/μg doxycycline for 48 hours prior to transfection with empty vector plasmid (EV), CBP plasmid (CBP rescue) or p300 plasmid (p300 rescue). The effect of each condition on CBP, p300, AR-FL, AR-V7, KLK3, FKBP5, TMPRSS2, C-MYC, ODC and CAD mRNA expression (g) and CBP, p300, AR-FL, AR-V7, C-MYC and GAPDH protein expression (h) was determined after 48 hours. Mean mRNA expression (normalized to 18S and shCON:EV; defined as 1.0) with standard error of mean from three individual experiments is shown. p-values (*p=<0.05, **p=<0.01, ***p=<0.001) were calculated for shCBP:EV compared to shCBP:CBP rescue, and shp300:EV compared to shp300:p300 rescue, using unpaired student t-test. Western blots demonstrate single experiment. The effect of each condition on relative growth was determined after 5 days using the PicoGreen dsDNA assay (i). Mean relative growth (normalized to baseline and shCON:EV; defined as 1.0) with standard error of mean from three individual experiments is shown. p-values (*p=<0.05, **p=<0.01, ***p=<0.001) were calculated for shCBP:EV compared to shCBP:CBP rescue, and shp300:EV compared to shp300:p300 rescue, using unpaired student t-test.
Figure 3:
Figure 3:. CCS1477, a selective p300/CBP inhibitor, downregulates AR and C-MYC signaling, and inhibits the growth of prostate cancer models.
(a) Chemical structure of CCS1477. (b) A summary of the derived kinetic parameters from analysis of CCS1477 in a Surface Plasmon Resonance SPR assay (Kon is the rate constant for the association of the protein-ligand reaction, S.E. is the standard error of the mean, Koff is the rate constant for the dissociation of the protein-ligand reaction, Kd is the equilibrium constant for the dissociation equilibrium, T1/2 is the half-life of the protein-ligand reaction). (c) Inhibition of cell proliferation by CCS1477 in prostate cancer cell lines representative of hormone dependent, hormone independent or CRPC with the IC50 determined by either Cell Titre Glo or CyQuant. (d) Schematic of RNA-sequencing experimental setup. Briefly, 22Rv1 cells were grown in hormone-deficient media for 72 hours prior to treatment CCS1477 (96 nM) or vehicle control. RNA-sequencing was performed in biological triplicate. (e) Gene set enrichment analysis using the hallmarks pathway from the molecular signatures database (FDR <0.25). Briefly, normalized RNA-sequencing counts were queried for over-represented pathways with enrichment (left) and de-enrichment (right) after CCS1477 treatment are shown. Leading edge plots for the top two de-enriched pathways after CCS1477 treatment are shown. Normalized enrichment score (NES) and false discovery rate (FDR) are shown.
Figure 4:
Figure 4:. CCS1477 inhibits AR and C-MYC signaling in cell line models of castration resistant prostate cancer.
(a-b) 22Rv1 and (c-d) LNCaP95 were treated with vehicle (0nM = DMSO 0.1%) or various concentrations of CCS1477 (1nM, 10nM, 30nM, 100nM, 300nM, 1000nM, 3000nM or 5000nM) for 48-hours (72 hours for b). The effect of each condition on AR-FL, AR-V7, KLK2, KLK3, FKBP5, TMPRSS2, C-MYC, CBP and p300 mRNA expression (22Rv1 a; LNCaP95 c) and AR-FL, AR-V7, C-MYC, and GAPDH protein expression was determined (22Rv1 b; LNCaP95 d). Mean mRNA expression (normalized to an average of B2M/GAPDH/HPRT1 and control siRNA; defined as 1.0) with standard error of mean from three individual experiments is shown. p-values (*p=<0.05, **p=<0.01, ***p=<0.001) were calculated for each treatment condition compared to vehicle using unpaired student t-test. Single representative western blot shown from three separate experiments. (e) 22Rv1 cells were plated in hormone-deficient media for 72 hours. Following which, cells were treated with vehicle (0nM = DMSO 0.1%) or CCS1477 500nM for 8 hours, with 10nM dihydrotestosterone (DHT) being added 3 hours before harvest. Chromatin immunoprecipitation (ChIP) was performed with CBP, p300 and AR-FL antibodies, followed by PCR with primers designed for known AR binding sites whose gene expression was significantly downregulated by CCS1477 treatment (KLK3, TMPRSS2, FKBP5 ANKRD30B and CHRNA2), and to known CBP binding sites (TFF1 and TGFA enhancer, enh). Mean binding as percentage input with standard error of mean from three individual experiments is shown. p-values (*p=<0.05, **p=<0.01, ***p=<0.001) were calculated for vehicle compared to CCS1477 treatment using unpaired student t-test.
Figure 5:
Figure 5:. CCS1477 decreases AR and AR-V7 signaling and inhibits growth in a 22Rv1 mouse xenograft model.
(a) Once 22Rv1 xenograft tumor volume reached 150mm3 then treatment commenced with either vehicle (measurements for n=9) or CCS1477 (measurements for n=4 per group), administered by oral gavage, at 10 or 20 mg/kg once daily (QD) or at 30 mg/kg every other day (QOD) for 28 days (vehicles collected at 26 days due to reaching a legal maximum). Mean tumor volume with standard error of mean is shown. p-values (*p=<0.05, **p=<0.01, ***p=<0.001) were calculated for vehicle compared to CCS1477 at 10mg/kg QD, 20 mg/kg QD, and 30 mg/kg QOD at 26 days using unpaired student t-test. (b) The effect of each condition on C-MYC, KLK3 and TMPRSS2 mRNA expression was determined for 7 days (left) and 28 days (26 days for vehicle) (right). Mean mRNA expression (normalized to an average of GAPDH/RPLP0 and vehicle treatment; defined as 1.0) with standard error of mean from individual tumors in each group (3 per group in 7 days, 5 per group from 28 days) are shown. p-values (*p=<0.05, **p=<0.01, ***p=<0.001) were calculated for each treatment condition compared to vehicle using unpaired student t-test. (c) The effect of each condition on AR-FL, AR-V7, C-MYC, and beta-actin protein expression was determined for 7 days (left) and 28 days (26 days for vehicle) (right). (d) Blood plasma KLK3 protein levels (ng/ml) were determined every 7 days by ELISA. Mean KLK3 protein levels with standard deviation from mice in each treatment group are shown. (e) Gene set enrichment analysis of RNA-sequencing for 26 days vehicle group and 28 days 20mg/kg CCS1477 QD group comparing the androgen response (left), AR signature (center) and AR-V7 signature (right) with normalized enrichment score (NES) and false discovery rate (FDR) are shown.
Figure 6:
Figure 6:. CCS1477 decreases AR and AR-V7 signaling and inhibits growth in a patient- derived model of lethal prostate cancer.
(a) Patient-derived xenograft (PDX) CP50c was developed from lymph node biopsy from a patient who had progressed through all standard-of-care treatments for CRPC. (b) Schematic overview of CP50c PDX experimental design. Once CP50c PDX tumor volume reached 300mm3 treatment, administered by oral gavage, commenced with either vehicle or 20 mg/kg CCS1477 daily (QD) until reaching 300% of starting volume (long term, n=6 per group), with an additional subset treated for short term analysis at 8 days (n=4 per group for mRNA; n=3 for western blot). (c-d) Mean growth (normalized to start; defined as 100%) with standard error of mean was determined for each tumor. p-value (*p=<0.05, **p=<0.01, ***p=<0.001) was calculated for vehicle compared to CCS1477 at 20 mg/kg QD at 31 to 35 days using unpaired student t-test. (c). Time to reach 300% growth was used as a surrogate endpoint for survival. Hazard ratio (HR) with 95% confidence intervals and p-values for univariate cox survival model are shown (d). (e-f) The effect of 20mg/kg CCS1477 QD compared to vehicle at eight-days on AR, AR-V7, KLK3, TMPRSS2, and C-MYC mRNA expression (e) and on AR- FL, AR-V7, C-MYC, and GAPDH protein expression was determined (f). Mean mRNA expression (normalized to an average of B2M/GAPDH/HPRT1 and vehicle treatment; defined as 1.0) with standard error of mean from individual tumors in each group is shown. p-values (*p=<0.05, **p=<0.01, ***p=<0.001) were calculated for each treatment condition compared to vehicle using unpaired student t-test. (g) Gene set enrichment analysis of RNA-sequencing from vehicle group and 20mg/kg CCS1477 QD group at 8-days comparing the androgen response (left), AR signature (center left), AR-V7 signature (center right) and MYC targets V2 (right) with normalized enrichment score (NES) and false discovery rate (FDR) presented.
Figure 7:
Figure 7:. CCS1477 regulates key prostate cancer therapeutic targets and modulates blood KLK3 in patients with castration resistant prostate cancer.
(a-f) Patient 1 (a-c) and patient 2 (d-f) were treated with CCS1477 within an ongoing Phase I clinical trial (NCT03568656). Patient 1 (a-c) was treated orally with 50mg twice daily (BD) on a 3- days-on-and-4 days-off-schedule. Blood KLK3 levels and timing of pre-dose (after 4-days off treatment) and post-dose (4-hours post-CCS1477 dose) biopsies are shown (a). The patient remains on trial. Quantification (b) and representative micrographs for haematoxylin and eosin (H and E), AR-FL, AR-V7, C-MYC, KLK3, CBP, p300 and Ki67 immunohistochemistry pre-dose and post-dose are shown (c). Scale bar represents 200 μm. Patient 2 (d-f) was treated orally with 25mg BD continuously. Blood KLK3 levels and timing of pre-dose (prior to starting treatment) and post-dose (3 hours post CCS1477 dose) biopsies are shown (d). The patient has stopped treatment. Quantification (e) and representative micrographs for H and E, AR-FL, AR-V7, C-MYC, KLK3, CBP, p300 and Ki67 immunohistochemistry pre-dose and post-dose are shown (f). Scale bar represents 200 μm.

Comment in

References

    1. Culp MB, Soerjomataram I, Efstathiou JA, Bray F, Jemal A. Recent Global Patterns in Prostate Cancer Incidence and Mortality Rates. European urology. 2020;77(1):38–52. - PubMed
    1. Visakorpi T, Hyytinen E, Koivisto P, Tanner M, Keinanen R, Palmberg C, et al. In vivo amplification of the androgen receptor gene and progression of human prostate cancer. Nature genetics. 1995;9(4):401–6. - PubMed
    1. Chen CD, Welsbie DS, Tran C, Baek SH, Chen R, Vessella R, et al. Molecular determinants of resistance to antiandrogen therapy. Nat Med 2004;10(1):33–9. - PubMed
    1. Abida W, Cyrta J, Heller G, Prandi D, Armenia J, Coleman I, et al. Genomic correlates of clinical outcome in advanced prostate cancer. Proceedings of the National Academy of Sciences of the United States of America. 2019;116(23):11428–36. - PMC - PubMed
    1. Beer TM, Armstrong AJ, Rathkopf DE, Loriot Y, Sternberg CN, Higano CS, et al. Enzalutamide in metastatic prostate cancer before chemotherapy. The New England journal of medicine. 2014;371(5):424–33. - PMC - PubMed

Publication types

MeSH terms