. 2021 Jan 27;13(578):eabe8146.
doi: 10.1126/scitranslmed.abe8146. Epub 2021 Jan 11.

Single-cell RNA sequencing reveals SARS-CoV-2 infection dynamics in lungs of African green monkeys

Affiliations

Single-cell RNA sequencing reveals SARS-CoV-2 infection dynamics in lungs of African green monkeys

Emily Speranza et al. Sci Transl Med. .

Abstract

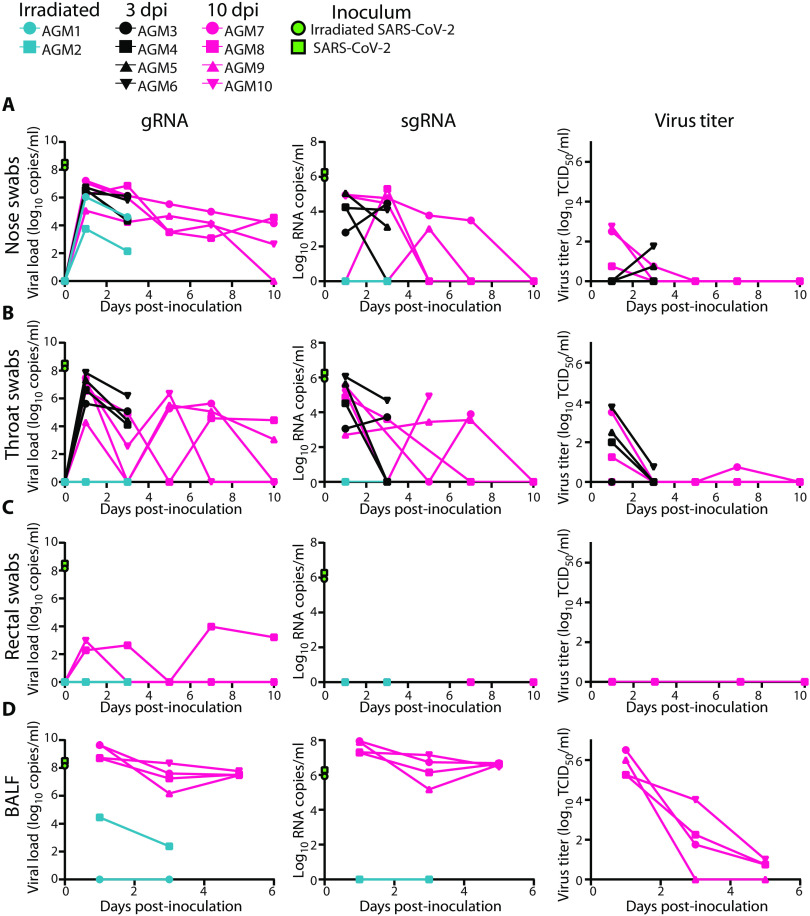
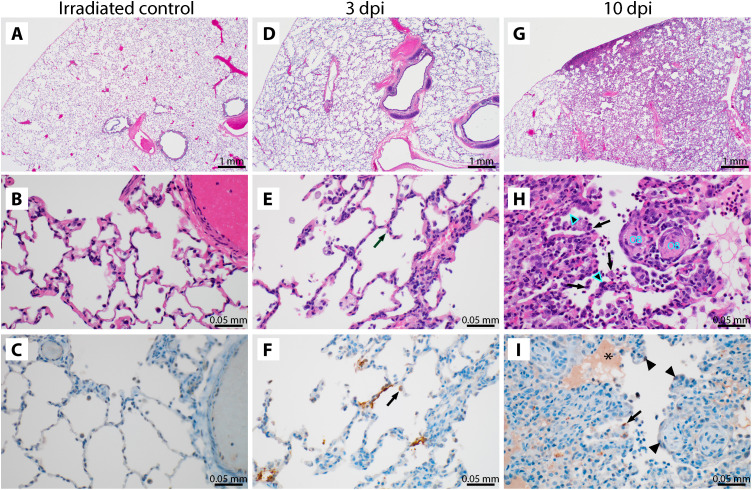
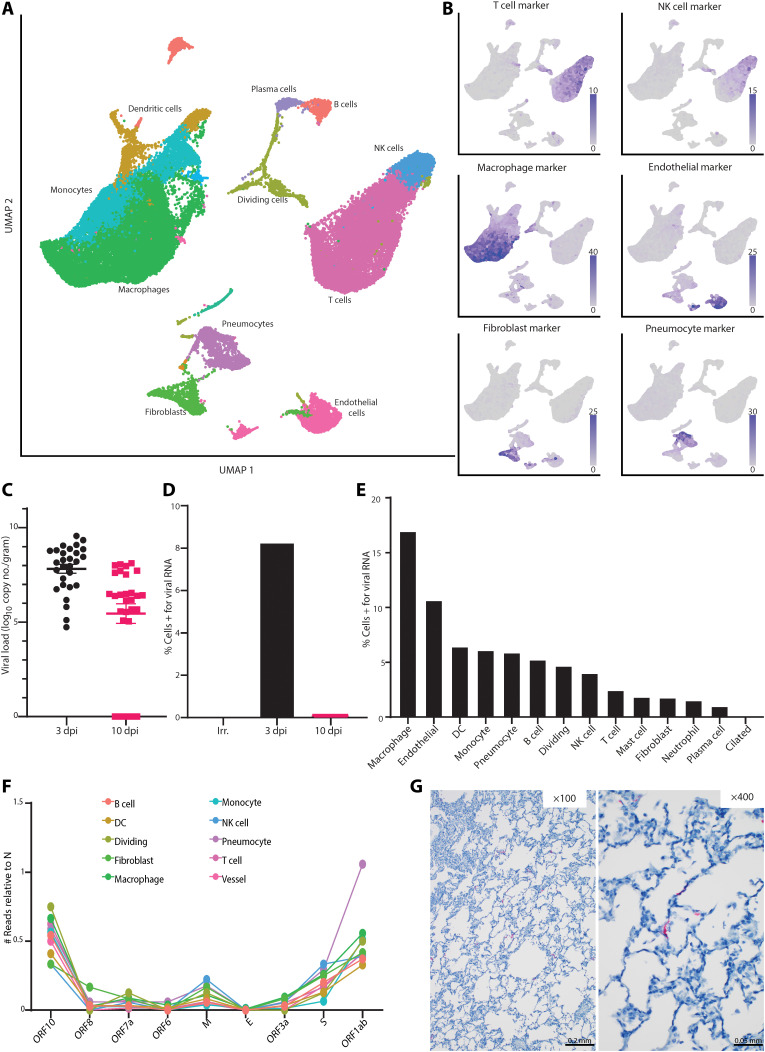
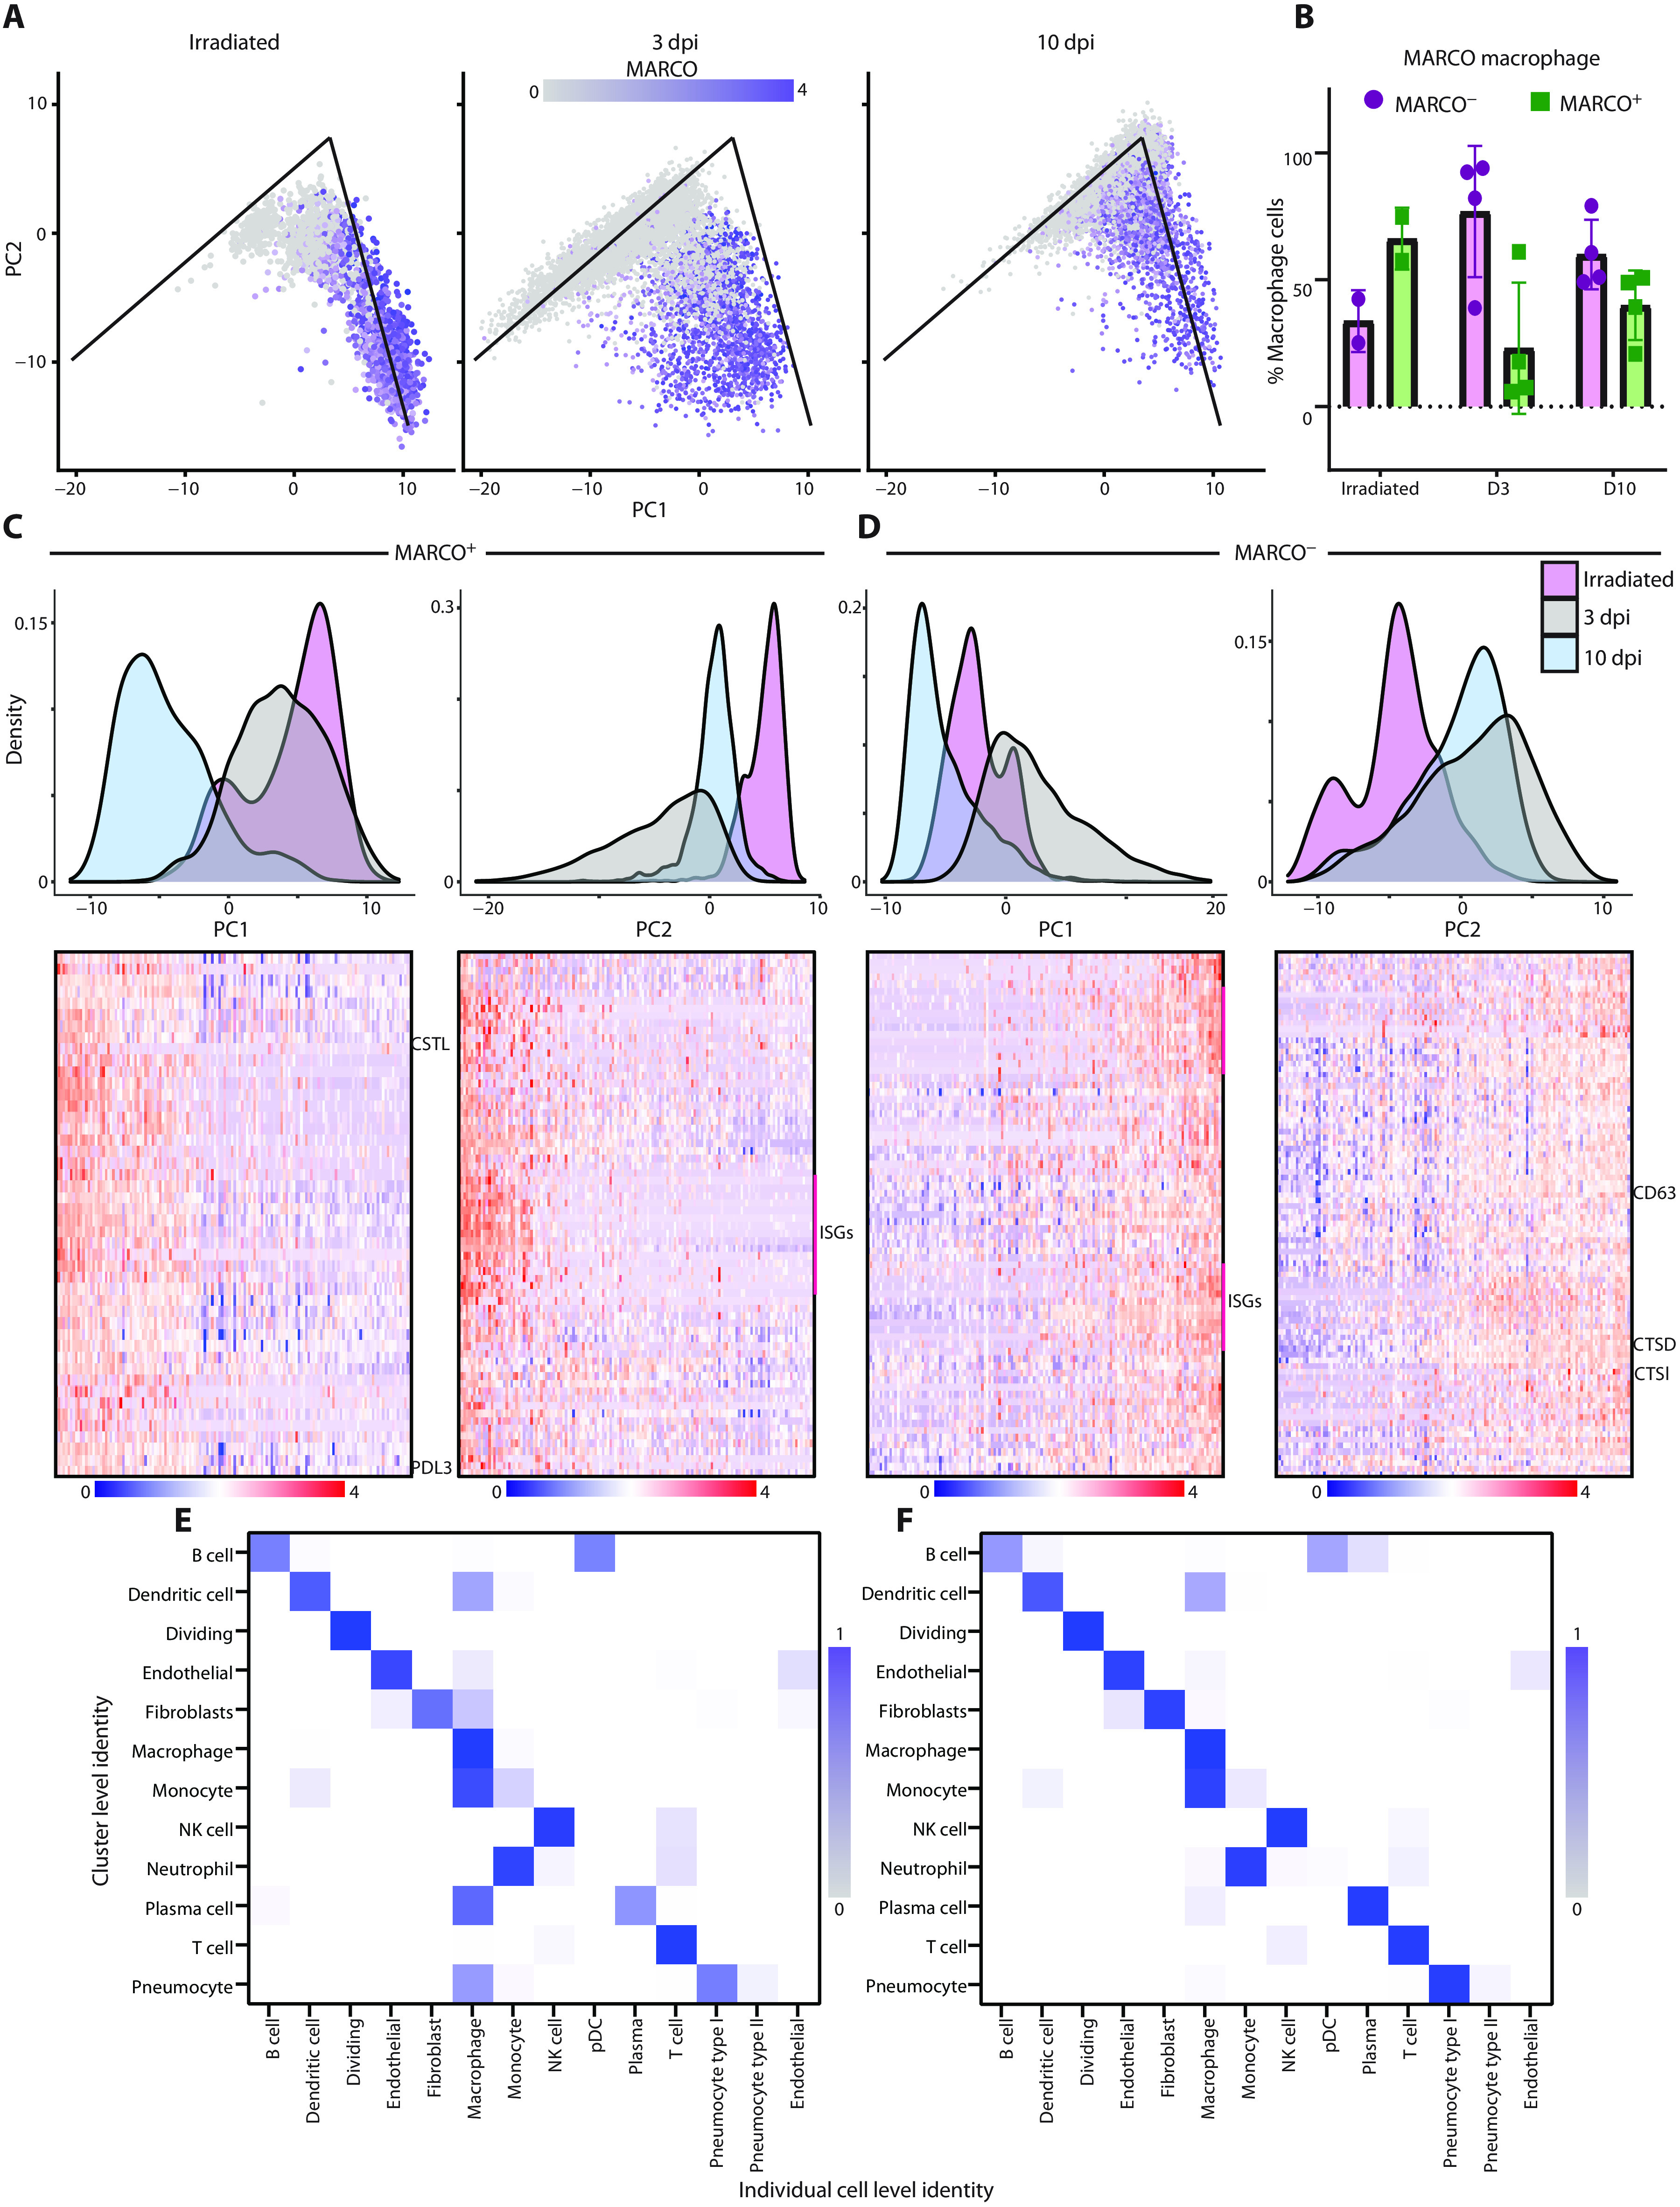
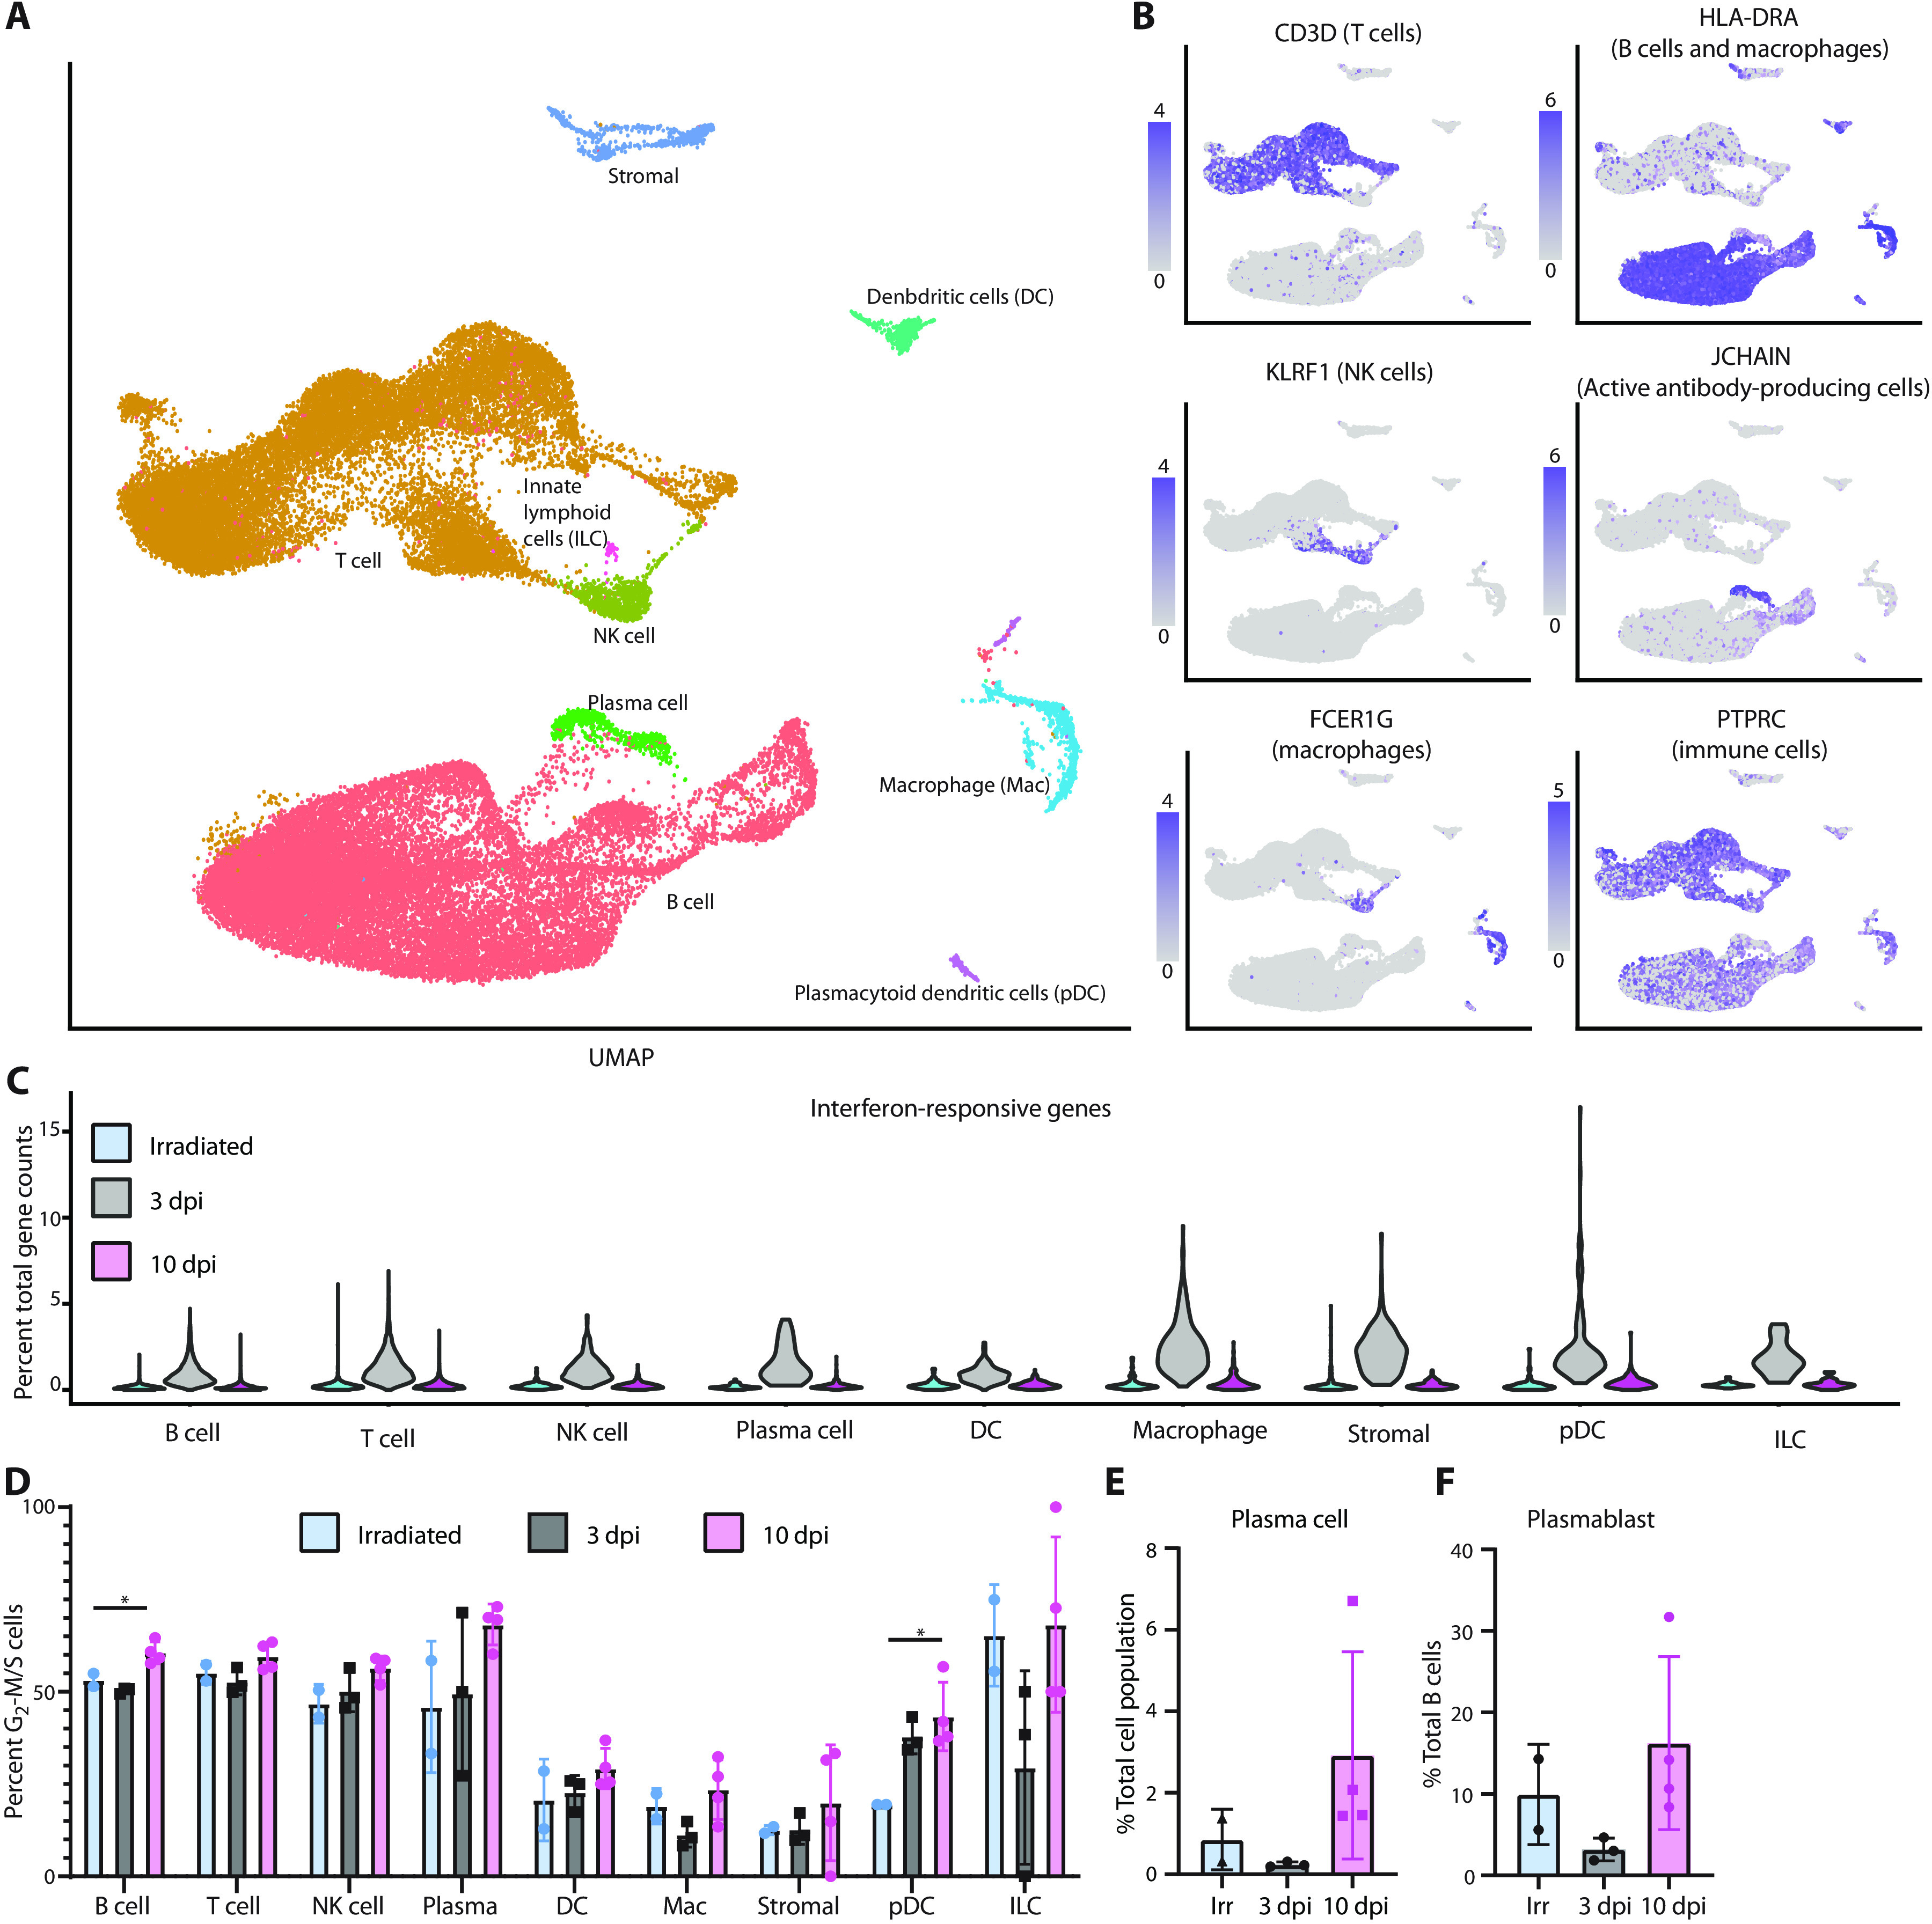
Detailed knowledge about the dynamics of severe acute respiratory syndrome coronavirus 2 (SARS-CoV-2) infection is important for uncovering the viral and host factors that contribute to coronavirus disease 2019 (COVID-19) pathogenesis. Old-World nonhuman primates recapitulate mild to moderate cases of COVID-19, thereby serving as important pathogenesis models. We compared African green monkeys inoculated with infectious SARS-CoV-2 or irradiated, inactivated virus to study the dynamics of virus replication throughout the respiratory tract. Genomic RNA from the animals inoculated with the irradiated virus was found to be highly stable, whereas subgenomic RNA, an indicator of viral replication, was found to degrade quickly. We combined this information with single-cell RNA sequencing of cells isolated from the lung and lung-draining mediastinal lymph nodes and developed new analysis methods for unbiased targeting of important cells in the host response to SARS-CoV-2 infection. Through detection of reads to the viral genome, we were able to determine that replication of the virus in the lungs appeared to occur mainly in pneumocytes, whereas macrophages drove the inflammatory response. Monocyte-derived macrophages recruited to the lungs, rather than tissue-resident alveolar macrophages, were most likely to be responsible for phagocytosis of infected cells and cellular debris early in infection, with their roles switching during clearance of infection. Together, our dataset provides a detailed view of the dynamics of virus replication and host responses over the course of mild COVID-19 and serves as a valuable resource to identify therapeutic targets.


Figures

Fig. 1
Fig. 1. Viral loads and virus titers in swabs and BALF from African green monkeys.
Two African green monkeys were inoculated with γ-irradiated SARS-CoV-2 (n = 2). Eight African green monkeys were inoculated with infectious SARS-CoV-2 isolate nCoV-WA1-2020. After inoculation, clinical exams were performed during which nose (A), throat (B), and rectal swabs (C) were collected; (D) bronchoalveolar lavages were performed at 1, 3, and 5 dpi on the four animals remaining in the study through 10 dpi; and viral loads and titers were measured. qRT-PCR was performed to detect gRNA (left column) and sgRNA (middle column), and in vitro virus titration was performed to detect infectious virus (right column) in these samples. Amount of gRNA and sgRNA in the inocula (γ-irradiated and infectious) is indicated at time point zero. Teal: animals inoculated with γ-irradiated virus; black: animals inoculated with infectious virus and euthanized at 3 dpi; pink: animals inoculated with infectious virus and euthanized at 10 dpi.
Fig. 2
Fig. 2. Histological changes are observed in the lungs of African green monkeys inoculated with SARS-CoV-2.
(A to C) African green monkeys were inoculated with γ-irradiated SARS-CoV-2 (n = 2) and euthanized at 3 dpi; eight animals were inoculated with SARS-CoV-2 isolate nCoV-WA1-2020. (D to F) Four of those were euthanized at 3 dpi. (G to I) The remaining four animals were euthanized at 10 dpi. Histological analysis was performed on lung tissue from all animals. (A) Lungs of animals inoculated with γ-irradiated SARS-CoV-2 were normal at 3 dpi. (B) This was further confirmed at high magnification. (C) No SARS-CoV-2 antigen could be detected in lungs from animals inoculated with γ-irradiated SARS-CoV-2. (D) Mildly thickened septa were observed at 3 dpi in animals inoculated with infectious SARS-CoV-2. (E) Alveolar septa are slightly thickened and more cellular at 3 dpi. (F) Cytoplasmic and membrane-associated viral antigen in pneumocytes at 3 dpi. (G) Discrete foci of interstitial pneumonia are apparent at the periphery of the lung at 10 dpi. (H) Alveolar edema (*), type II pneumocyte hyperplasia (arrowheads), increased alveolar macrophages (arrows), and infiltrating lymphocytes and neutrophils are observed at 10 dpi, as well as proliferative nodules associated with terminal airways resembling obstructive bronchiolitis (OB). (I) Rare viral antigen could be detected in mononuclear cells, presumably alveolar macrophages, with cytoplasmic debris (arrows) at 10 dpi; background blush is observed in alveolar proteinaceous fluid (*), but pneumocytes do not exhibit immunoreactivity (arrowheads). Magnification, ×20 (scale bars: 1 mm) (A to C) and ×400 (scale bars: 0.05 mm) (D to I).
Fig. 3
Fig. 3. Single-cell sequencing reveals viral dynamics in lung tissue.
(A) UMAP projection of scRNA-seq data from whole lung sections from all 10 animals combined. Each point is an individual cell; colors are based on cell type annotation. Cell names are shown next to their largest cluster. NK, natural killer. (B) Validation of cell type identities using marker gene sets. The intensity of the purple color represents higher expression of the indicated marker set. Gray coloring indicates that the cell did not express any genes in the marker set. (C) Viral load in cells isolated from the lungs was evaluated via qRT-PCR for gRNA and grouped for all lobes across each animal in the indicated groups. (D) The percentage of cells identified by scRNA-seq that were positive for any reads aligning to the viral genome by dpi is reported. (E) Percentage of cells from the 3-dpi samples positive for any reads aligning to the viral genome grouped by cell type. DC, dendritic cell. (F) The number of cells grouped by cell type with reads aligning to other locations across the viral genome, all normalized to the number of cells expressing nucleocapsid (N) gene. M, membrane; E, envelope; S, spike. Genes are ordered from the 3′ to 5′ end of the SARS-CoV-2 genome. (G) ISH for viral spike RNA in lung tissues at 3 dpi. Viral RNA staining is shown in red at ×100 magnification (scale bar: 0.2 mm) and ×400 magnification (scale bar: 0.05 mm).
Fig. 4
Fig. 4. Macrophage populations in the lungs are dynamic during SARS-CoV-2 infection.
(A) Graphs depicting PC analysis of lung macrophages. The x axis is PC1, and the y axis is PC2. Experimental groups are plotted independently. Each point is an individual cell and is colored on the basis of the expression of MARCO. The lines on the PC graphs are for reference across the samples and represent matching locations. (B) Quantification of the percentage of macrophages that are MARCO (purple) or MARCO+ (green) across the three different experimental groups. (C) The MARCO+ macrophage PC analysis (density plots) was plotted by histograms representing the experimental groups. PC1 is shown on the left, and PC2 is shown on the right. The heatmap below showing the individual cells (columns) sorted based on their location along PC1 or PC2. Top genes showing high correlation along that PC are clustered in rows. A few of the gene names are noted just to the right of the heatmaps. (D) The density plots and histograms are shown as in (C) for MARCO cells. (E and F) Comparison between the individual cell identity (columns) and the cluster identity (rows) based on an unbiased identification algorithm at 3 dpi (E) or 10 dpi (F) for SARS-CoV-2−infected animals. The color intensity represents the percent of individual cells in the cluster that match the identified phenotype.
Fig. 5
Fig. 5. Single-cell sequencing of mediastinal lymph nodes shows resolution of inflammatory response.
(A) UMAP projection of single-cell sequencing data from cells isolated from the mediastinal lymph nodes of all 10 animals combined. Each point represents an individual cell, and cells are colored on the basis of their cell type. The names of the cell types are placed next to their largest cluster. (B) Single gene expression analysis was used to validate cell type identifications. (C) Percent of total gene counts for each cell for a subset of interferon-responsive genes (y axis). The x axis denotes cell types and experimental group. (D) Percentage of each cell population (x axis) that is actively dividing (stage G2-M or S) as determined by a profile of gene expression. Each point is an individual animal, and bars represent the mean and SD of the samples. (E) The percentage of plasma cells in each sample compared relative to the total cell number is plotted. (F) The percentage of plasmablast cells relative to the number of B cells is plotted. *P < 0.05, one-way ANOVA.

Update of

References

    1. Tay M. Z., Poh C. M., Renia L., MacAry P. A., Ng L. F. P., The trinity of COVID-19: Immunity, inflammation and intervention. Nat. Rev. Immunol. 20, 363–374 (2020). - PMC - PubMed
    1. Ge H., Wang X., Yuan X., Xiao G., Wang C., Deng T., Yuan Q., Xiao X., The epidemiology and clinical information about COVID-19. Eur. J. Clin. Microbiol. Infect. Dis. 39, 1011–1019 (2020). - PMC - PubMed
    1. Sungnak W., Huang N., Bécavin C., Berg M., Queen R., Litvinukova M., Talavera-López C., Maatz H., Reichart D., Sampaziotis F., Worlock K. B., Yoshida M., Barnes J. L.; HCA Lung Biological Network , SARS-CoV-2 entry factors are highly expressed in nasal epithelial cells together with innate immune genes. Nat. Med. 26, 681–687 (2020). - PMC - PubMed
    1. Qi F., Qian S., Zhang S., Zhang Z., Single cell RNA sequencing of 13 human tissues identify cell types and receptors of human coronaviruses. Biochem. Biophys. Res. Commun. 526, 135–140 (2020). - PMC - PubMed
    1. Bost P., Giladi A., Liu Y., Bendjelal Y., Xu G., David E., Blecher-Gonen R., Cohen M., Medaglia C., Li H., Deczkowska A., Zhang S., Schwikowski B., Zhang Z., Amit I., Host-viral infection maps reveal signatures of severe COVID-19 patients. Cell 181, 1475–1488.e12 (2020). - PMC - PubMed

Publication types

MeSH terms