. 2022 Jan;71(1):163-175.
doi: 10.1136/gutjnl-2020-323395. Epub 2021 Jan 11.

PBMC transcriptomics identifies immune-metabolism disorder during the development of HBV-ACLF

Affiliations

PBMC transcriptomics identifies immune-metabolism disorder during the development of HBV-ACLF

Jiang Li et al. Gut. 2022 Jan.

Abstract

Objective: Hepatitis B virus-related acute-on-chronic liver failure (HBV-ACLF) pathophysiology remains unclear. This study aims to characterise the molecular basis of HBV-ACLF using transcriptomics.

Methods: Four hundred subjects with HBV-ACLF, acute-on-chronic hepatic dysfunction (ACHD), liver cirrhosis (LC) or chronic hepatitis B (CHB) and normal controls (NC) from a prospective multicentre cohort were studied, and 65 subjects (ACLF, 20; ACHD, 10; LC, 10; CHB, 10; NC, 15) among them underwent mRNA sequencing using peripheral blood mononuclear cells (PBMCs).

Results: The functional synergy analysis focusing on seven bioprocesses related to the PBMC response and the top 500 differentially expressed genes (DEGs) showed that viral processes were associated with all disease stages. Immune dysregulation, as the most prominent change and disorder triggered by HBV exacerbation, drove CHB or LC to ACHD and ACLF. Metabolic disruption was significant in ACHD and severe in ACLF. The analysis of 62 overlapping DEGs further linked the HBV-based immune-metabolism disorder to ACLF progression. The signatures of interferon-related, neutrophil-related and monocyte-related pathways related to the innate immune response were significantly upregulated. Signatures linked to the adaptive immune response were downregulated. Disruptions of lipid and fatty acid metabolism were observed during ACLF development. External validation of four DEGs underlying the aforementioned molecular mechanism in patients and experimental rats confirmed their specificity and potential as biomarkers for HBV-ACLF pathogenesis.

Conclusions: This study highlights immune-metabolism disorder triggered by HBV exacerbation as a potential mechanism of HBV-ACLF and may indicate a novel diagnostic and treatment target to reduce HBV-ACLF-related mortality.

Keywords: cirrhosis; hepatitis B; liver failure.


Conflict of interest statement

Competing interests: None declared.

Figures

Figure 1
Figure 1
Transcriptomic characteristics of patients with HBV-ACLF. (A) Study design and patient group allocation based on the COSSH-ACLF diagnostic criteria. (B) Flow chart of the functional synergy analysis strategy. (C) Principal component analysis of subjects in the ACLF, ACHD, LC, CHB and NC groups. (D) Number of DEGs analysed in pairwise comparisons among the five groups. (E) Venn diagram of the DEGs analysed in pairwise comparisons among subjects in the CHB, LC and NC groups. The number of mRNA sequencing (n=20/10/10/10/15, ACLF/ACHD/LC/CHB/NC groups, respectively). ACHD, acute-on-chronic hepatic dysfunction; ACLF, acute-on-chronic liver failure; CHB, chronic hepatitis B; COSSH, Chinese Group on the Study of Severe Hepatitis B; DEGs, differentially expressed genes; HBV, hepatitis B virus; LC, liver cirrhosis; NC, normal controls; PBMC, peripheral blood mononuclear cell.
Figure 2
Figure 2
Hepatitis B virus exacerbation and immune-metabolism disorder during ACLF aggravation. (A) Functional synergy analysis of the functional implications of the top 500 DEGs in pairwise comparisons between the ACLF/ACHD/LC/CHB and NC groups. (B) Network of the biological processes identified in the functional synergy analysis of 100 DEGs between the ACHD and NC groups. (C) Network of the biological processes identified in the functional synergy analysis of 100 DEGs between the ACLF and NC groups. (D) Network of the biological processes identified based on overlapping DEGs. Top panel, number of DEGs analysed in pairwise comparisons among the ACLF, ACHD, LC and CHB groups. Bottom panel, network of the biological processes identified in a functional synergy analysis of 62 overlapping DEGs. The number of mRNA sequencing (n=20/10/10/10/15, ACLF/ACHD/LC/CHB/NC groups, respectively). ACHD, acute-on-chronic hepatic dysfunction; ACLF, acute-on-chronic liver failure; CHB, chronic hepatitis B; DEGs, differentially expressed genes; IL, interleukin; LC, liver cirrhosis; NC, normal controls; NK, natural killer.
Figure 3
Figure 3
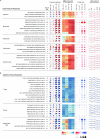
Spectra of immune responses defined by BTMs across ACLF development. (A) Innate immune response-related BTMs were activated in patients with ACLF. (B) Adaptive immune response-related BTMs were exhausted in patients with ACLF. The first column shows the frequency analysis of significant DEGs in each module. Coloured spots represent the percentage of significantly upregulated (red) or downregulated (blue) genes. The second column shows the results of the GSEA using BTMs as gene sets. The heatmap represents the Normalised Enrichment Score (NES) calculated by the GSEA for these modules. *p<0.05, **p<0.01, ***p<0.001. The third column shows the results of the paired t-test comparing member genes between patients with different disease stages and NC. The transcriptomics data were summarised into module level scores by calculating the mean values of member genes. The colour intensity and size of nodes represents the degree of perturbation. In the fourth column, line charts represent the mean expression of each module across disease stages. The number of mRNA sequencing (n=20/10/10/10/15, ACLF/ACHD/LC/CHB/NC groups, respectively). ACHD, acute-on-chronic hepatic dysfunction; ACLF, acute-on-chronic liver failure; BTM, blood transcriptional module; CHB, chronic hepatitis B; DEGs, differentially expressed genes; GSEA, gene set enrichment analysis; HBV, hepatitis B virus; LC, liver cirrhosis; NC, normal controls; NK, natural killer.
Figure 4
Figure 4
Regulation of metabolism across ACLF development. (A) Metabolic pathways that were significantly altered across disease stages based on enriched KEGG pathways with only p value <0.05 are depicted here. *p<0.05, **p<0.01, ***p<0.001. Lipid handing-related and usage-related pathways are highlighted in red. Pathways in which gene expression was increased or decreased are shown in red and blue in the heatmap, respectively. The colour intensity is proportional to the NES calculated using the GSEA. (B) Heatmap of genes from selected KEGG-derived metabolic pathways. For each pathway, the top 30 DEGs are shown (adjusted p value <0.05). (All DEGs are shown if the number of detected genes is <30.) Genes with higher (red) or lower (blue) expression are proportionally displayed. Significantly differentially expressed genes (|log2-fold change|>1.5) are shown in bold. The number of mRNA sequencing (n=20/10/10/10/15, ACLF/ACHD/LC/CHB/NC groups, respectively). ACHD, acute-on-chronic hepatic dysfunction; ACLF, acute-on-chronic liver failure; AMPK, AMP-activated protein kinase; CHB, chronic hepatitis B; DEGs, differentially expressed genes; GSEA, gene set enrichment analysis; HBV, hepatitis B virus; LC, liver cirrhosis; NC, normal controls; NES, Normalised Enrichment Score; KEGG, Kyoto Encyclopediaof Genes and Genomes; PPAR, peroxisome proliferator-activated receptor.
Figure 5
Figure 5
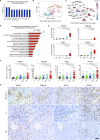
Immune-metabolism signatures associated with ACLF development. (A) The frequencies of the top 10 genes appearing in the top 50 DEGs of the four comparisons (ranked by adjusted p value). (B) The top 10 genes are shown in the volcano plot of the ACLF versus NC groups. Significantly differentially expressed genes (|log2-fold change|>1.5; adjusted p value <0.05) are shown in red or blue. The node size represents the frequency of key genes. (C) String network showing genes interacting with the top four genes (MER tyrosine kinase, MERTK; semaphorin 6B, SEMA6B; thrombospondin 1, THBS1 and PPAR gamma, PPARG). The colour represents the log2-fold change in the ACLF group compared with the NC group. (D) Significantly enriched pathways for the genes interacting with the top four genes (MERTK, SEMA6B, THBS1, PPARG, p<0.05). (E) Expression of four key genes in the sequencing group. Box plot, medians with (p25, p75). The false discovery rate was calculated using the Benjamini-Hochberg procedure. #No Significance, *adjusted p value <0.05, **adjusted p value <0.01, ***adjusted p value <0.001. The number of mRNA sequencing (n=20/10/10/10/15, ACLF/ACHD/LC/CHB/NC groups, respectively). (F) The qRT-PCR validation of four key genes (n=110/60/60/60/45, ACLF/ACHD/LC/CHB/NC groups, respectively). Plot, medians with (p25, p75). Mann-Whitney U test, #No Significance, *p<0.05, **p<0.01 and ***p<0.001. (G) Immunohistochemistry staining for four key proteins involved in ACLF development in patients from the HBV-ACLF, LC and NC groups. ACHD, acute-on-chronic hepatic dysfunction; ACLF, acute-on-chronic liver failure; CHB, chronic hepatitis B; DEGs, differentially expressed genes; HBV, hepatitis B virus; LC, liver cirrhosis; NC, normal controls.
Figure 6
Figure 6
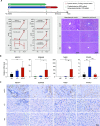
Validation of potential immune-metabolism biomarkers of ACLF development in a rat ACLF model. (A) ACLF was induced in porcine serum-treated rats through the injection of D-galactosamine and lipopolysaccharides. Top panel, schematic showing the design of the ACLF rat model. Bottom left panel, changes in six typical biochemical markers of liver function observed among the groups. Bottom right panel, pathological staining (H&E and Masson’s trichrome) of liver tissues (bar=250 µm). (B) The quantitative reverse transcription-PCR measurement of the expression of four key molecules in liver tissues (n=8/8/16, NC/LC/ACLF, respectively). (C) Images of IHC staining for four key molecules in rat liver tissues (bar=50 µm). Plot, means with SD. Kruskal-Wallis test, *p<0.05, **p<0.01, ***p<0.001 and ****p<0.001. ACHD, acute-on-chronic hepatic dysfunction; ACLF, acute-on-chronic liver failure; CHB, chronic hepatitis B; COSSH, Chinese Group on the Study of Severe Hepatitis B; DEGs, differentially expressed genes; HBV, hepatitis B virus; LC, liver cirrhosis; NC, normal controls.
Figure 7
Figure 7
Proposed mechanism of HBV-ACLF development and progression. HBV-ACLF may be aggravated by an excessive immune response triggered by HBV exacerbation during the initial stage. Subsequent inflammatory responses and metabolic disorders result in multiorgan failure. The immune-metabolism disorder triggered by HBV exacerbation may be an important mechanism that aggravates HBV-ACLF. ACLF, acute-on-chronic liver failure; HBV, hepatitis B virus; IL, interleukin.

References

    1. Bernal W, Jalan R, Quaglia A, et al. . Acute-On-Chronic liver failure. Lancet 2015;386:1576–87. 10.1016/S0140-6736(15)00309-8 - DOI - PubMed
    1. Moreau R, Jalan R, Gines P, et al. . Acute-On-Chronic liver failure is a distinct syndrome that develops in patients with acute decompensation of cirrhosis. Gastroenterology 2013;144:1426–37. 10.1053/j.gastro.2013.02.042 - DOI - PubMed
    1. Wu T, Li J, Shao L, et al. . Development of diagnostic criteria and a prognostic score for hepatitis B virus-related acute-on-chronic liver failure. Gut 2018;67:2181–91. 10.1136/gutjnl-2017-314641 - DOI - PubMed
    1. Schwabe RF, Luedde T. Apoptosis and necroptosis in the liver: a matter of life and death. Nat Rev Gastroenterol Hepatol 2018;15:738–52. 10.1038/s41575-018-0065-y - DOI - PMC - PubMed
    1. Clària J, Stauber RE, Coenraad MJ, et al. . Systemic inflammation in decompensated cirrhosis: characterization and role in acute-on-chronic liver failure. Hepatology 2016;64:1249–64. 10.1002/hep.28740 - DOI - PubMed

Publication types