. 2021 Jan 19;118(3):e2013962118.
doi: 10.1073/pnas.2013962118.

A link between synaptic plasticity and reorganization of brain activity in Parkinson's disease

Affiliations

A link between synaptic plasticity and reorganization of brain activity in Parkinson's disease

Diliana Rebelo et al. Proc Natl Acad Sci U S A. .

Abstract

The link between synaptic plasticity and reorganization of brain activity in health and disease remains a scientific challenge. We examined this question in Parkinson's disease (PD) where functional up-regulation of postsynaptic D2 receptors has been documented while its significance at the neural activity level has never been identified. We investigated cortico-subcortical plasticity in PD using the oculomotor system as a model to study reorganization of dopaminergic networks. This model is ideal because this system reorganizes due to frontal-to-parietal shifts in blood oxygen level-dependent (BOLD) activity. We tested the prediction that functional activation plasticity is associated with postsynaptic dopaminergic modifications by combining positron emission tomography/functional magnetic resonance imaging to investigate striatal postsynaptic reorganization of dopamine D2 receptors (using 11C-raclopride) and neural activation in PD. We used covariance (connectivity) statistics at molecular and functional levels to probe striato-cortical reorganization in PD in on/off medication states to show that functional and molecular forms of reorganization are related. D2 binding across regions defined by prosaccades showed increased molecular connectivity between both caudate/putamen and hyperactive parietal eye fields in PD in contrast with frontal eye fields in controls, in line with the shift model. Concerning antisaccades, parietal-striatal connectivity dominated in again in PD, unlike frontal regions. Concerning molecular-BOLD covariance, a striking sign reversal was observed: PD patients showed negative frontal-putamen functional-molecular associations, consistent with the reorganization shift, in contrast with the positive correlations observed in controls. Follow-up analysis in off-medication PD patients confirmed the negative BOLD-molecular correlation. These results provide a link among BOLD responses, striato-cortical synaptic reorganization, and neural plasticity in PD.

Keywords: functional connectivity; functional magnetic resonance imaging; molecular imaging; positron emission tomography.


Conflict of interest statement

The authors declare no competing interest.

Figures

Fig. 1.
Fig. 1.
Scheme of the fMRI experimental procedure. For both experiments, participants had to first fixate the white cross displayed in the center of the screen (1,250–1,750 ms total time) and then, toward the blue target (in the PSs task, represented by a green arrow) or in the opposite direction (in the ASs task, represented by a red arrow) quickly and accurately. The target would appear for 500 ms in four possible locations, ordered randomly (10° up, 10° down, 10° right, and 10° left), but organized in blocks of six horizontal saccades interleaved with blocks of six vertical saccades. The trial was completed when the target disappeared and a blank screen was shown for 1,000 ms.
Fig. 2.
Fig. 2.
Examples of areas of interest used for further statistical analysis (A) Image showing six areas of interest. The spheres correspond to left FEF (center MNI coordinates: −41, 24, and 41), right FEF (center MNI coordinates: 45, 19, and 41), left parietal PEF (center MNI coordinates: −31, −50, and 47), right PEF (center MNI coordinates: 42, −44, and 43). These areas were calculated as a mean ROI from the group in which FEF and PEF clusters, which are consistent with the anatomical literature, as well. Caudate and putamen are represented below. Both areas were segmented manually from molecular imaging data. The image was created using ITK-Snap and Paraview software. (B) Examples of functional magnetic imaging statistical activation maps, used to localize the FEF and PEF, and define the ROI masks computed in A. A healthy (Top) and an on-medication PD participant (Bottom) are represented in the figure. In this particular image, we depict the contrast vertical vs. baseline in the PSs experiment for the control subject (MNI coordinates: −54, 4, and 40; P = 0.001; T = 3.19) and for the PD patient (MNI coordinates: −32, −50, and 52; P = 0.001; T = 3.19). Color bar: t values.
Fig. 3.
Fig. 3.
Unimodal (molecular–molecular) correlations in the PSs experiment. The relationship between the DVR in caudate or putamen and the left FEF or right PEF, respectively, in the control group and in the PD group (which included on- and off-medication patients). Regression lines, correlation coefficient, and P value for each analysis are presented. The dashed lines represent the 95% confidence band.
Fig. 4.
Fig. 4.
Unimodal (molecular–molecular) in an AS experiment. The relationship (for the AS regions) between the DVR in the caudate or putamen and the left and right PEFs, respectively, in the control group and in the PD group (which included on- and off-medication patients). Regression line, correlation coefficient, and P value for each analysis are presented. The dashed lines represent the 95% confidence band.
Fig. 5.
Fig. 5.
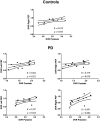
Multimodal molecular–functional correlations in healthy subjects and PD patients. Plot of BOLD fMRI vs. DVR between defined ROIs. The figures depict the relationship between the DVR in the putamen and the β-weights in the left and right FEFs in the control group and in the PD group (which included on- and off-medication patients), while performing vertical PSs. Similar results were found for the right and left FEFs for both groups. Regression lines, correlation coefficient, and P value for each analysis are presented. The dashed lines represent the 95% confidence band.

References

    1. Chaudhuri K. R., Healy D. G., Schapira A. H.; National Institute for Clinical Excellence , Non-motor symptoms of Parkinson’s disease: Diagnosis and management. Lancet Neurol. 5, 235–245 (2006). - PubMed
    1. Veronese M., et al. , Covariance statistics and network analysis of brain PET imaging studies. Sci. Rep. 9, 2496 (2019). - PMC - PubMed
    1. Antoniades C. A., Kennard C., Ocular motor abnormalities in neurodegenerative disorders. Eye (Lond.) 29, 200–207 (2015). - PMC - PubMed
    1. Lees A. J., Hardy J., Revesz T., Parkinson’s disease. Lancet 373, 2055–2066 (2009). - PubMed
    1. MacAskill M. R., Anderson T. J., Eye movements in neurodegenerative diseases. Curr. Opin. Neurol. 29, 61–68 (2016). - PubMed

Publication types

MeSH terms

LinkOut - more resources