. 2021 Jan 19;118(3):e2014408118.
doi: 10.1073/pnas.2014408118.

Interplay between desmoglein2 and hypoxia controls metastasis in breast cancer

Affiliations

Interplay between desmoglein2 and hypoxia controls metastasis in breast cancer

Po-Hao Chang et al. Proc Natl Acad Sci U S A. .

Abstract

Metastasis is the major cause of cancer death. An increased level of circulating tumor cells (CTCs), metastatic cancer cells that have intravasated into the circulatory system, is particularly associated with colonization of distant organs and poor prognosis. However, the key factors required for tumor cell dissemination and colonization remain elusive. We found that high expression of desmoglein2 (DSG2), a component of desmosome-mediated intercellular adhesion complexes, promoted tumor growth, increased the prevalence of CTC clusters, and facilitated distant organ colonization. The dynamic regulation of DSG2 by hypoxia was key to this process, as down-regulation of DSG2 in hypoxic regions of primary tumors led to elevated epithelial-mesenchymal transition (EMT) gene expression, allowing cells to detach from the primary tumor and undergo intravasation. Subsequent derepression of DSG2 after intravasation and release of hypoxic stress was associated with an increased ability to colonize distant organs. This dynamic regulation of DSG2 was mediated by Hypoxia-Induced Factor1α (HIF1α). In contrast to its more widely observed function to promote expression of hypoxia-inducible genes, HIF1α repressed DSG2 by recruitment of the polycomb repressive complex 2 components, EZH2 and SUZ12, to the DSG2 promoter in hypoxic cells. Consistent with our experimental data, DSG2 expression level correlated with poor prognosis and recurrence risk in breast cancer patients. Together, these results demonstrated the importance of DSG2 expression in metastasis and revealed a mechanism by which hypoxia drives metastasis.

Keywords: HIF1α; breast cancer; circulating tumor cells (CTCs); desmoglein2 (DSG2); metastasis.


Conflict of interest statement

Competing interest statement: P.-H.C. and M.-C.C. are coinventors on a DSG2 monoclonal antibody patent owned by Asclepiumm Taiwan Co., Ltd. M.-C.C. has equity ownership in and serves on the board of directors of Asclepiumm Taiwan Co., Ltd.

Figures
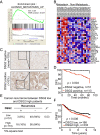
Fig. 1.
Fig. 1.
High DSG2 expression is positively correlated with metastasis and high recurrence risk in breast cancer patients. (A and B) GSEA-P enrichment plot (A) and heat map (B) for the top 30 up-regulated genes for metastasis in metastatic (n = 7) versus nonmetastatic breast cancer patients (n = 15). Normalized enrichment score (ES) and false discovery rate (FDR) q are listed on the enrichment plots. (C) (Left) Representative IHC of breast tumors classified as negative (Upper; <10% of the tumor cells have detectable DSG2 staining) or positive (Lower; >10% of tumor cells with intense membrane staining) for DSG2 expression. Enlarged images are presented on Right. (Scale bar, 30 μm.) (D) Kaplan−Meier disease free survival (DFS) analysis of breast cancer patients grouped by DSG2 expression. DSG2-positive group is indicated by red line (n = 113); DSG2-negative group is indicated by black line (n = 51). P = 0.004. The P value was determined by log-rank test. (E) Comparison of recurrence rate between patients with DSG2-positive (>10% cells with DSG2 staining) vs. DSG2-negative (<10% with DSG2 staining) tumors using χ2 test. P = 0.03. (F) Kaplan–Meier analysis of distant metastasis-free survival (DMFS) of patients with different levels of DSG2 using a breast cancer cohort (Yau 2010 dataset) from the UCSC Xena public hub. Receiver operating characteristic (ROC) curve analysis was used to determine the relative level of DSG2. P = 0.008. The P value was determined by log-rank test.
Fig. 2.
Fig. 2.
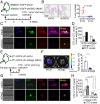
DSG2 expression promotes CTC clustering and metastatic colonization. (A) Diagram of the procedure used for orthotopic xenografts. MB231 cells expressing EGFP without (MB231-EGFP shCtrl) or with (shDSG2, #846) DSG2 depletion were injected into fourth mammary fat pads of NOD/SCIDγ mice. CTCs, primary tumors, and lung tissues were collected at 9 wk after injection. (B) Representative H&E staining of lung sections from mice orthotopically injected with (Left) shCtrl or (Right) shDSG2 MB231-EGFP cells and quantification of lung nodule numbers in shCtrl and shDSG2 groups. Error bars indicate SD; P value was determined by unpaired T test. (C) Representative images of CTCs from shCtrl or shDSG2 MB231-EGFP tumor-bearing mice captured by MiCareo on-chip filtration and having positive immunofluorescence (IF) staining of DAPI, EGFR, and GFP to identify MB231-EGFP cells. (Scale bar, 25 μm.) (D) Numbers of single CTCs and CTC clusters collected from pooled blood of shCtrl or shDSG2 MB231-EGFP tumor-bearing mice. Three mice per group were assayed. Data are CTC counts ± 95% CIs. (E) Diagram of the syngeneic mouse model procedure. The 4Tl-GFP/LUC without (shCtrl) or with (shDSG2, #604) DSG2 depletion were injected into fourth mammary fat pads of BALB/c mice. Primary tumors and lung tissues were collected at 3 wk after injection. (F) Bioluminescence imaging of lung metastasis and quantitation of bioluminescence between shCtrl and shDSG2 groups. Four mice were used for each group. Data are means ± SD, with significant difference determined by T test. (G) Representative images of CTCs from shCtrl or shDSG2 4T1-GFP/LUC tumor-bearing mice captured by MiCareo on-chip filtration and having positive IF staining of DAPI, CD29, and GFP to identify 4T1-GFP/LUC cells. (Scale bar, 25 μm.) (H) Numbers of single CTCs and CTC clusters collected from shCtrl- or shDSG2-transduced 4T1-GFP/LUC tumor-bearing mice. Four mice were used for each group. Data are means ± SD, with significant differences based on unpaired T test (* indicates P < 0.05, ** indicates P < 0.01).
Fig. 3.
Fig. 3.
DSG2 expression promoted metastatic colonization and tumor growth. (A) Lung metastasis and lung nodule numbers after tail vein injection using control (shCtrl) or DSG2-depleted (#846) SKBR3 cells. Data are means ± SD with P value based on unpaired T test. Images show representative H&E staining of lung sections from mice after tail vein injection. (Scale bar, 100 μm.) (B) Lung metastasis and lung nodule numbers after tail vein injection using control or DSG2 overexpressing MB157 cells. Data formatting is as described for A. (Scale bar, 100 μm.) (C) SACF assays using DSG2-depleted (#846 or #848) MB231 and SKBR3 cells. Data are shown as mean ± SD with P value based on unpaired T test. The experiments were repeated three times. **P < 0.01. (D) SACF assays using DSG2-overexpressing MB157 and MB468 cells. Replication and data formatting are as described for C. **P < 0.01. (E) Xenograft models in NOD/SCIDγ mice using control (shCtrl) or DSG2-depleted (#846) MB231 and SKBR3 cells. Five mice were used for each group. Data are means ± SD, and significant difference is based on unpaired T test of the tumor size at the last time point. **P < 0.01. (F) Xenograph models in NOD/SCIDγ mice using control or DSG2-overexpressing MB157 and MB468 cells. Replication and data analysis are as described for E. **P < 0.01, ***P < 0.001.
Fig. 4.
Fig. 4.
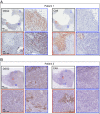
Negative correlation between hypoxia and DSG2 expression observed in clinical specimens for patients 1 (A) and 2 (B). Representative images of DSG2 and CA9 IHC staining using serial tumor sections from clinical breast cancer patients. Red boxes show enlarged images of low DSG2 but high CA9 expression regions. Blue boxes show enlarged images of high DSG2 but low CA9 expression regions. (Scale bars, 2 mm or 100 μm as shown in the images.) Examples shown are representative of 151 patient samples examined. Among the 151 samples, 66 slides contained DSG2high/CA9low cancer cells only, 40 slides contained DSG2low/CA9low cancer cells only, and 45 slides contains both DSG2high/CA9low and DSG2low/CA9high cells in different regions.
Fig. 5.
Fig. 5.
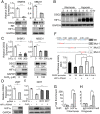
HIF1α suppressed DSG2 expression under hypoxic stress. (A) The qRT-PCR analysis of DSG2 level in SKBR3 and MB231 cells under normoxia (N) or hypoxia (H) for 16 h. Three independent experiments were performed, and data are means ± SD from one representative experiment (n = 3). Significant differences are based on unpaired T test. DSG2 and HIF1α protein expression were detected by immunoblot with glyceraldehyde-3-phosphate dehydrogenase (GAPDH) as a loading control. Blots shown are from one representative experiment of three replicates. RE, relative expression level. (B) Time course immunoblot of DSG2 and HIF1α in SKBR3 cells under normoxia or hypoxia. GAPDH was used as a loading control. Blots shown are from one representative experiment of three replicates. (C) The qRT-PCR analysis of DSG2 level in SKBR3 and MB231 cells treated with 100 μM or 200 μM CoCl2 for 16 h. Three independent experiments were performed, and data are means ± SD from one representative experiment (n = 3). Significant differences are based on unpaired T test. Elevated HIF1α protein level confirmed that cells were experiencing hypoxic stress. DSG2 and HIF1α expression in cells in the unstressed control or treated with 100 μM CoCl2 were detected by immunoblot with GAPDH as a loading control. Blots shown are from one representative experiment of three replicates. (D) The qRT-PCR analysis of DSG2 level in 293T cells transiently transfected with control vector (pcDNA) or HIF1α−P564A plasmid. HIF1α expression was detected by immunoblot with GAPDH as a loading control. Three independent experiments were performed, and data are means ± SD from one representative experiment (n = 3). Significant differences are based on unpaired T test. (E) The qRT-PCR of DSG2 level in 293T cells transduced with shHIF1α lentiviral vectors (clone #675 or #677) and treated with 100 μM CoCl2 for 24 h. Immunoblot of HIF1α shows that hypoxia-induced accumulation of HIF1α was effectively blocked by shHIF1α. The experiments were repeated three times. (F) Diagram shows three putative HIF1α binding sites on the DSG2 promoter predicted using ISMAR and the mutated promoter sequences used in luciferase reporter assays. Luciferase reporter assays were conducted using 293T cells cotransfected with pcDNA. HIF1α and the wild-type (Wt) or mutant DSG2 promoter constructs. Three replicate experiments were performed, and data are means ± SD from one representative experiment and significant differences detected using T test. (G) ChIP-qPCR analysis of HIF1α occupancy on the DSG2 promoter region containing putative HIF1α binding site (−946 nt to ∼−943 nt) in SKBR3 cells under normoxia or hypoxia. (H) ChIP-qPCR analysis of H3K27me3 on the same DSG2 promoter region as in G. For G and H, three independent experiments were performed, and data are means ± SD from one representative experiment with significant differences detected by unpaired T test. (* indicates P < 0.05, ** indicates P < 0.01, and *** indicates P < 0.001.)
Fig. 6.
Fig. 6.
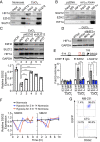
Hypoxia suppresses DSG2 expression via formation of a HIF1α-PRC2 complex. (A) Co-IP of HIF1α, EZH2, and SUZ12 in SKBR3 cells without (normoxia) or with CoCl2 treatment. IgG was used as a negative control. The experiments were repeated three times with consistent results. (B) Co-IP of SUZ12, EZH2, and HIF1α in 293T cells transfected with HIF1α−P564A. IgG was used as a negative control. The experiments were repeated three times. (C) Immunoblot of EZH2, SUZ12, and HIF1α (Top) and qRT-PCR analysis of DSG2 level (Bottom) in shCtrl (shC)-, shEZH2-, or shSUZ12-transduced SKBR3 cells treated with CoCl2. GAPDH was used as a control. The qRT-PCR data are means ± SD (n = 3). Significant differences were detected by T test (**P < 0.01, ***P < 0.001). (D) Immunoblot of HIF1α in SKBR3 cells transduced with shHIF1α lentiviral vectors (clones #674 and #677) and treated with CoCl2 for 6 h. The experiments were repeated three times. (E) ChIP-qPCR analysis of EZH2 and SUZ12 on the P2 promoter region (−1,062 to −552) in HIF1α-depleted SKBR3 cells with or without CoCl2 treatment. Data are mean ± SD with significant differences base on unpaired T test (*P < 0.05, **P < 0.01. ***P < 0.001). The experiments were repeated three times. (F) The qRT-PCR analysis of DSG2 in SKBR3 (Left) and MB231 (Right) cells kept under normoxia throughout the experiment (black line), or under hypoxia for 2 h (blue line) or 3 h (red line) and then released from the stress. Data are means ± SD (n = 3). Significant differences are based on T test of data at each time point. The experiments were repeated three times. (G) FACS analysis of DSG2 levels in shCtrl EGFP-MB231 cells before injection (Top) or in CTCs collected from pooled blood of four mice at 9 wk after injection (Bottom).
Fig. 7.
Fig. 7.
Dynamic changes of DSG2 expression contribute to breast tumorigenesis and metastasis. High DSG2 expression promotes breast tumor growth in mammary tissue. In nonhypoxic tumor regions with high DSG2, CTC clusters may be shed, and DSG2-mediated cell adhesion may facilitate CTC clustering prior to intravasation. Alternatively, when the tumor is large enough to induce hypoxia, HIF1α is stabilized and recruits PRC2 complex (EZH2 and SUZ12) to the DSG2 promoter to suppress its transcription. DSG2 suppression allows cancer cells to undergo EMT, and single CTCs are released from the primary tumor. In circulatory system, hypoxic stress is released, and reactivation of DSG2 expression allows colonization.

References

    1. Chaffer C. L., Weinberg R. A., A perspective on cancer cell metastasis. Science 331, 1559–1564 (2011). - PubMed
    1. Rankin E. B., Giaccia A. J., Hypoxic control of metastasis. Science 352, 175–180 (2016). - PMC - PubMed
    1. Twomey J. D., Zhang B., Circulating tumor cells develop resistance to TRAIL-induced apoptosis through autophagic removal of death receptor 5: Evidence from an in vitro model. Cancers (Basel) 11, E94 (2019). - PMC - PubMed
    1. Theodoropoulos P. A., et al. , Circulating tumor cells with a putative stem cell phenotype in peripheral blood of patients with breast cancer. Cancer Lett. 288, 99–106 (2010). - PubMed
    1. Cohen S. J., et al. , Relationship of circulating tumor cells to tumor response, progression-free survival, and overall survival in patients with metastatic colorectal cancer. J. Clin. Oncol. 26, 3213–3221 (2008). - PubMed

Publication types

MeSH terms