. 2021 Jan 19;118(3):e2021843118.
doi: 10.1073/pnas.2021843118.

Invariant timescale hierarchy across the cortical somatosensory network

Affiliations

Invariant timescale hierarchy across the cortical somatosensory network

Román Rossi-Pool et al. Proc Natl Acad Sci U S A. .

Erratum in

Abstract

The ability of cortical networks to integrate information from different sources is essential for cognitive processes. On one hand, sensory areas exhibit fast dynamics often phase-locked to stimulation; on the other hand, frontal lobe areas with slow response latencies to stimuli must integrate and maintain information for longer periods. Thus, cortical areas may require different timescales depending on their functional role. Studying the cortical somatosensory network while monkeys discriminated between two vibrotactile stimulus patterns, we found that a hierarchical order could be established across cortical areas based on their intrinsic timescales. Further, even though subareas (areas 3b, 1, and 2) of the primary somatosensory (S1) cortex exhibit analogous firing rate responses, a clear differentiation was observed in their timescales. Importantly, we observed that this inherent timescale hierarchy was invariant between task contexts (demanding vs. nondemanding). Even if task context severely affected neural coding in cortical areas downstream to S1, their timescales remained unaffected. Moreover, we found that these time constants were invariant across neurons with different latencies or coding. Although neurons had completely different dynamics, they all exhibited comparable timescales within each cortical area. Our results suggest that this measure is demonstrative of an inherent characteristic of each cortical area, is not a dynamical feature of individual neurons, and does not depend on task demands.

Keywords: behaving monkeys; inherent time constants; primary somatosensory cortex; somatosensory network; timescale hierarchy.


Conflict of interest statement

The authors declare no competing interest.

Figures

Fig. 1.
Fig. 1.
TPDT, performance, and recorded cortical areas. (A) Trials’ sequence of events. The mechanical probe is lowered (pd), indenting the glabrous skin of one fingertip of the right, restrained hand (500 µm); in response, the monkey places its left, free hand on an immovable key (kd). After a variable prestimulus period (from 2 to 4s), the probe vibrates for 1 s, generating one of two possible stimulus patterns (P1, either grouped [G] or extended [E]; mean frequency of 5 Hz). Note that in extended pattern E, pulses are delivered periodically. After a first delay (from 1 to 3 s) between P1 and P2, the second stimulus (P2) is delivered, again in either of the two possible patterns (P2, either G or E; 1 s duration); this is also called the comparison period. After a second 2-s delay (from 4 to 6 s) between the end of P2 and the probe up (pu), the monkey releases the key (ku) and presses, with its left free hand, either the lateral or the medial pushbutton (pb) to indicate whether the patterns were the same (P1 = P2) or different (P1 ≠ P2). (B) Performance for the whole TPDT (85%, gray; nSES = 954 sessions), for each class (86% G-G [red], 83% G-E [orange], 84% E-G [green], 87% E-E [blue]) and for the entire LCT (100%, yellow; nSES = 226 sessions). In the LTC, the same stimuli were delivered as in the TPDT, but the rewarding pushbutton press was visually guided. (C) Top (Left), lateral (Middle), and coronal (Right) views of the brain locations where single neurons were recorded. Cortical areas include areas 3b (green), 1 (blue), 2 (pink), 5 (violet), 7b (cyan), S2 (red), and DPC (orange). Recordings in S2 and DPC were made contralateral and ipsilateral to the stimulated fingertip.
Fig. 2.
Fig. 2.
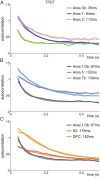
Hierarchical ordering of intrinsic timescales during TPDT. The autocorrelation function was computed for neuronal activity during the TPDT basal period with 40-ms time bins. An exponential decay function was fit to the autocorrelation value (SI Appendix, Eq. S1). Confidence intervals for τ were estimated through bootstrap. Thin, darker traces show the autocorrelation values averaged across each population of neurons. Wide, lighter traces display the exponential fit for each population. (A) TPDT autocorrelation function for areas 3b (green; n = 161, τ = 35 ± 11 ms), 1 (blue; n = 336, τ = 84 ± 13 ms), and 2 (pink; n = 68, τ = 113 ± 19 ms). (B) Autocorrelation function for S1 (area 3b/1, gray; n = 497, τ = 67 ± 7 ms) compared with area 5 (violet; n = 74, τ = 132 ± 21 ms) and area 7b (cyan; n = 63, τ = 134 ± 18 ms). Neurons from areas 5 and 7b exhibit comparable autocorrelation functions but a much longer decay than S1. (C) TPDT autocorrelation function for the entire S1 (areas 3b and 1; gray) plotted against the S2 (red; n = 1,646, τ = 178 ± 10 ms) and DPC (orange; n = 1,574, τ = 182 ± 5 ms) populations. Note that a change of ±20% in the time bin width for the firing rate calculation across areas (area 3b, area 1, S1 [3b and 1], area 2, area 5, area 7b, S2, and DPC) produced no significant differences in the time constants; however, much smaller bin widths (20 ms, with steps of 10 ms) produced a rescaling of the time constants to smaller values (29, 68, 51, 93, 112, 118, 161, and 173 ms, respectively) but, importantly, maintained the core result of the temporal hierarchy of the somatosensory network.
Fig. 3.
Fig. 3.
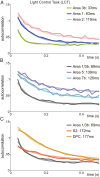
Hierarchical ordering of intrinsic timescales during the LCT. The autocorrelation function was computed for neuronal activity during the LCT basal period with 40-ms time bins. An exponential decay function was fit to the autocorrelation values (SI Appendix). Confidence intervals for τ were estimated with bootstrap. Thin, darker traces show the autocorrelation values averaged across each population of neurons. Wide, lighter traces display the exponential fit for each population. (A) LCT autocorrelation function for areas 3b (green; n = 92, τ = 33 ± 12 ms), 1 (blue; n = 227, τ = 83 ± 16 ms), and 2 (pink; n = 23, τ = 119 ± 23 ms). (B) Autocorrelation function for S1 (areas 3b and 1, gray; n = 319, τ = 69 ± 10 ms) compared with area 5 (violet, n = 19; τ = 139 ± 27 ms) and area 7b (cyan, n = 32; τ = 126 ± 25 ms). (C) LCT autocorrelation function for entire S1 (areas 3b and 1; gray) plotted against S2 (red; n = 313, τ = 172 ± 15 ms) and DPC (orange; n = 462, τ = 177 ± 9 ms) populations. Comparing Figs. 2 and 3 shows that for all areas, autocorrelation functions are analogous in TPDT and LCT.
Fig. 4.
Fig. 4.
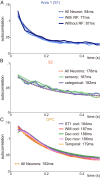
Invariant intrinsic timescales across neural subgroups from the same area. The autocorrelation function was computed for neuronal activity of different subgroups of neurons during the TPDT basal period with 40-ms time bins. An exponential decay function was fit to the autocorrelation values (SI Appendix). Thin, darker traces show the autocorrelation values averaged across each group of neurons. Wide, lighter traces display the exponential fit for each subgroup. Dotted lines show the exponential decay fitted for all neurons from each area (same as Fig. 2). (A) TPDT autocorrelation function for two different subgroups of area 1 neurons with receptive field (light blue; n = 211, τ = 77 ± 14 ms) and without receptive field (dark blue; n = 125, τ = 87 ± 15 ms) compared with all area 1 neurons (blue dotted; n = 336, τ = 84 ± 13 ms). Autocorrelation is invariant for specific subgroups of area 1 neurons. (B) Autocorrelation function for the entire S2 population (red dotted; n = 1,646, τ = 178 ± 10 ms), the S2 sensory population (green; n = 105, τ = 187 ± 16 ms), and the S2 categorical population (blue; n = 150, τ = 182 ± 14 ms). Autocorrelation is invariant for S2 and its subpopulations. (C) TPDT autocorrelation function for different subgroups of DPC neurons: neurons with P1 coding during the first stimulus (violet; n = 554, τ = 184 ± 8 ms), neurons with P1 coding during the working memory period (red; n = 346, τ = 187 ± 11 ms), neurons with decision coding (green; n = 314, τ = 188 ± 10 ms), neurons with decision coding during movement (pink; n = 386, τ = 186 ± 9 ms), and neurons with pure temporal signals (orange; n = 358, τ = 179 ± 12 ms). The autocorrelation function for the entire DPC population is depicted for comparison (orange dotted; n = 1,574, τ = 182 ± 5 ms). Autocorrelation is invariant for specific subgroups of DPC neurons with different coding dynamics.
Fig. 5.
Fig. 5.
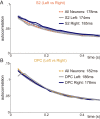
Invariant intrinsic timescales across the same area from different hemispheres. The autocorrelation function was computed for neuronal activity of neurons from different hemispheres during the TPDT basal period with 40 ms time bins. An exponential decay function was fit to the autocorrelation value (SI Appendix). Thin, darker traces show the autocorrelation values averaged across neurons from the same hemisphere. Wide, lighter traces display the exponential fit for each hemisphere. Dotted lines show the exponential decay fitted for all neurons from both hemispheres (same as Fig. 2). (A) TPDT autocorrelation function for neurons recorded in each hemisphere of S2: left hemisphere (gray; n = 1,236, τ = 174 ± 11 ms) and right hemisphere (dark blue; n = 410, τ = 185 ± 14 ms). The autocorrelation function for the entire S2 population is depicted for comparison (red dotted; n = 1,646, τ = 178 ± 10 ms). S2 autocorrelation is invariant across hemispheres. (B) Autocorrelation function for the entire DPC population (orange dotted; n = 1,574, τ = 182 ± 5 ms), the DPC left hemisphere population (gray; n = 675, τ = 186 ± 8 ms) or the DPC right hemisphere population (dark; n = 899, τ = 178 ± 7 ms). Autocorrelation is invariant between DPCs from different hemispheres.

References

    1. Wang X.-J., Macroscopic gradients of synaptic excitation and inhibition in the neocortex. Nat. Rev. Neurosci. 21, 169–178 (2020). - PMC - PubMed
    1. Wagstyl K., Ronan L., Goodyer I. M., Fletcher P. C., Cortical thickness gradients in structural hierarchies. Neuroimage 111, 241–250 (2015). - PMC - PubMed
    1. Romo R., Rossi-Pool R., Turning touch into perception. Neuron 105, 16–33 (2020). - PubMed
    1. Chaudhuri R., Knoblauch K., Gariel M.-A., Kennedy H., Wang X.-J., A large-scale circuit mechanism for hierarchical dynamical processing in the primate cortex. Neuron 88, 419–431 (2015). - PMC - PubMed
    1. Joglekar M. R., Mejias J. F., Yang G. R., Wang X.-J., Inter-areal balanced amplification enhances signal propagation in a large-scale circuit model of the primate cortex. Neuron 98, 222–234.e8 (2018). - PubMed

Publication types