. 2021 Jan 19;118(3):e2022551118.
doi: 10.1073/pnas.2022551118.

Regulation of a subset of release-ready vesicles by the presynaptic protein Mover

Affiliations

Regulation of a subset of release-ready vesicles by the presynaptic protein Mover

Ermis Pofantis et al. Proc Natl Acad Sci U S A. .

Abstract

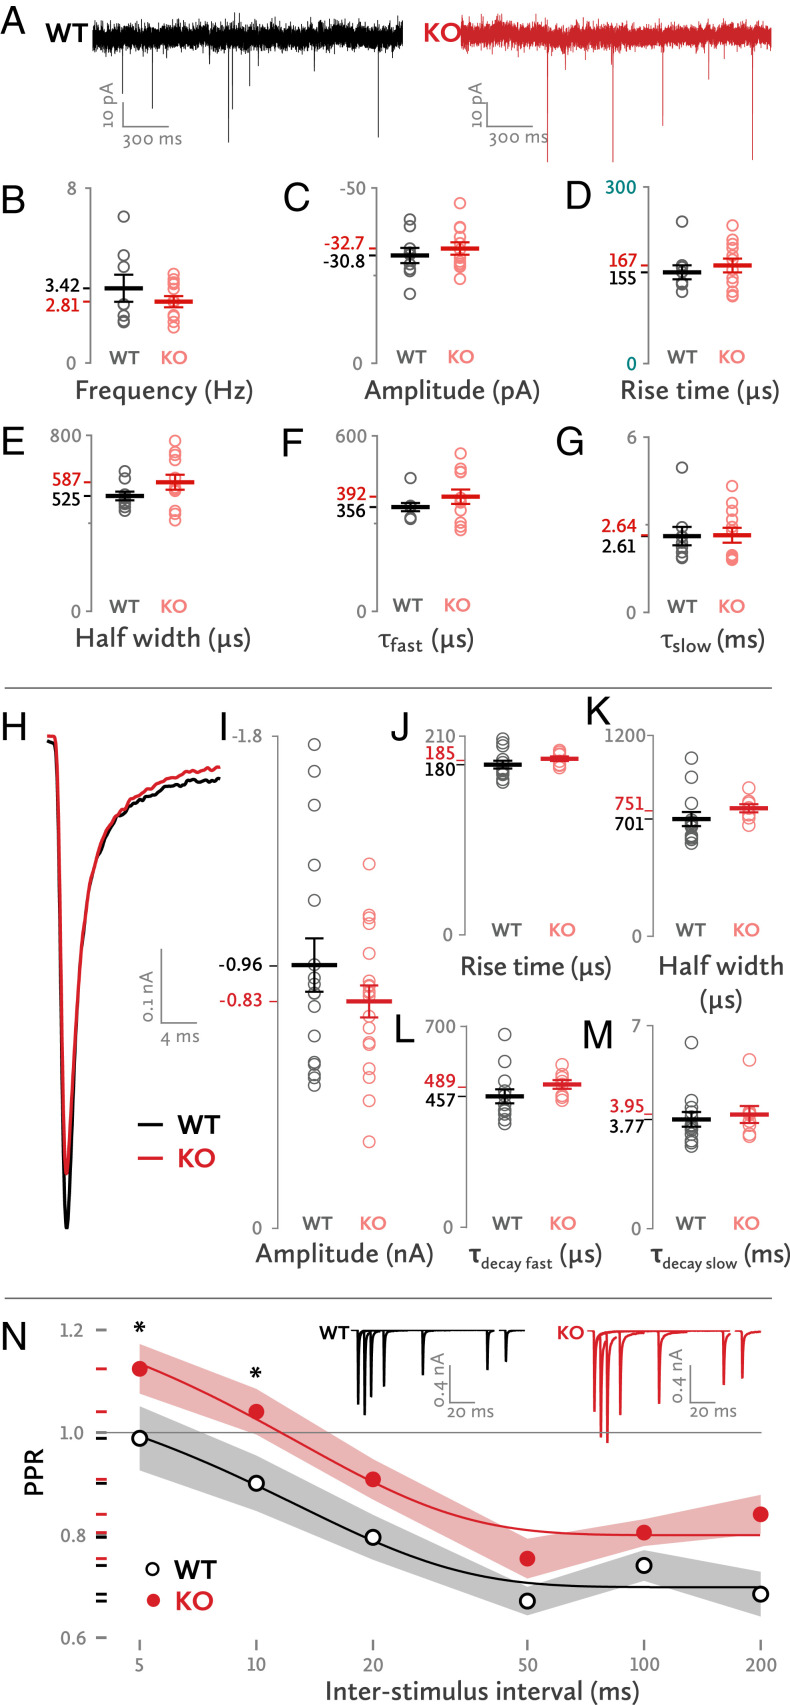
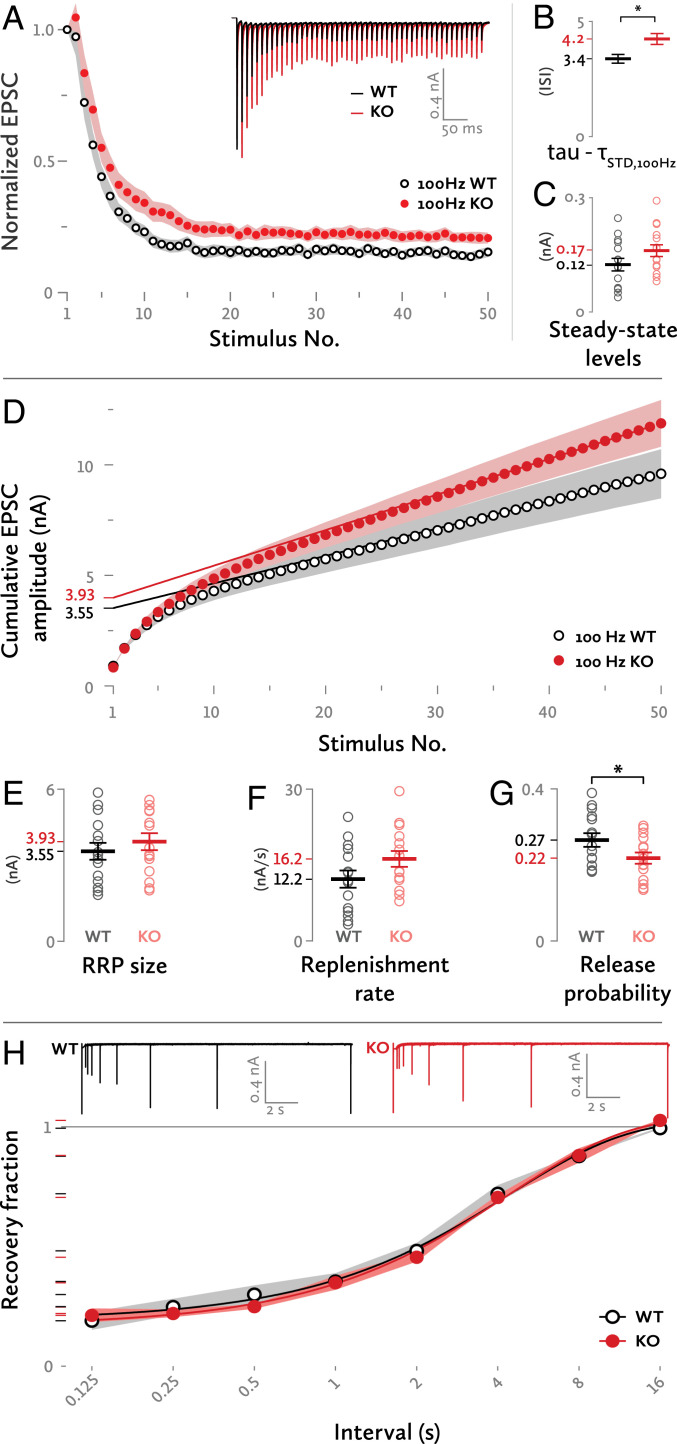
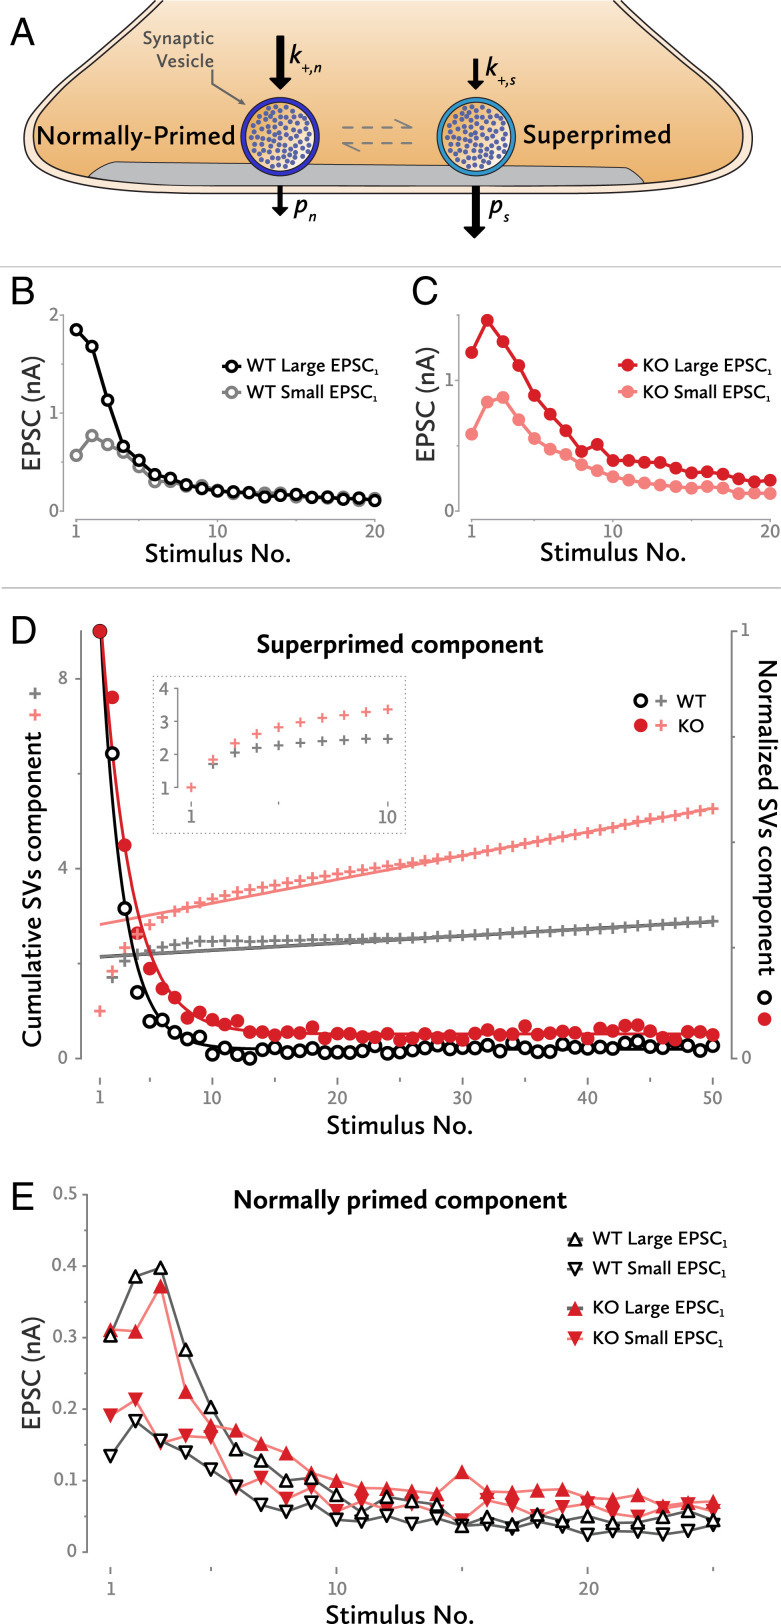
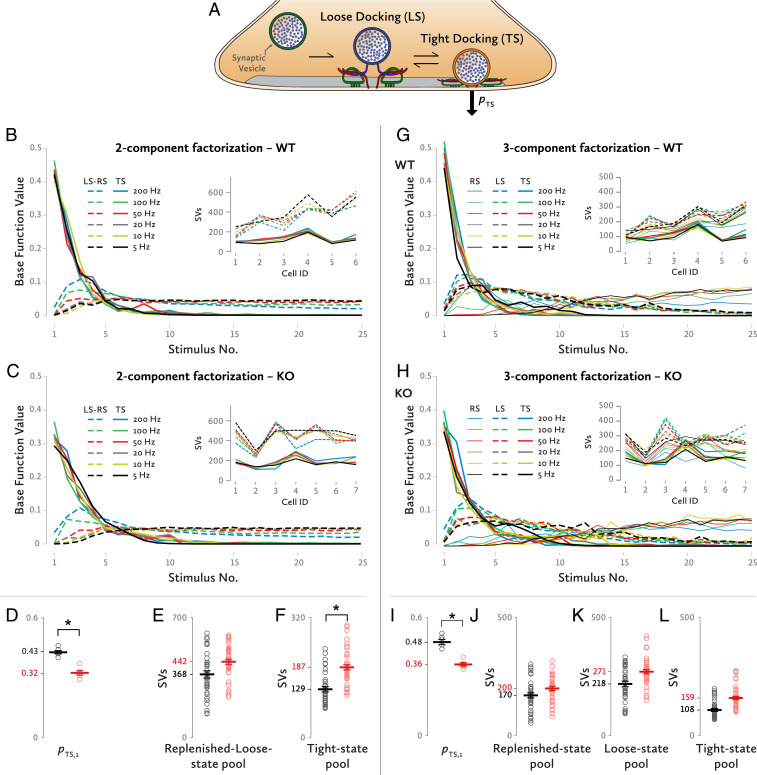
Neurotransmitter release occurs by regulated exocytosis from synaptic vesicles (SVs). Evolutionarily conserved proteins mediate the essential aspects of this process, including the membrane fusion step and priming steps that make SVs release-competent. Unlike the proteins constituting the core fusion machinery, the SV protein Mover does not occur in all species and all synapses. Its restricted expression suggests that Mover may modulate basic aspects of transmitter release and short-term plasticity. To test this hypothesis, we analyzed synaptic transmission electrophysiologically at the mouse calyx of Held synapse in slices obtained from wild-type mice and mice lacking Mover. Spontaneous transmission was unaffected, indicating that the basic release machinery works in the absence of Mover. Evoked release and vesicular release probability were slightly reduced, and the paired pulse ratio was increased in Mover knockout mice. To explore whether Mover's role is restricted to certain subpools of SVs, we analyzed our data in terms of two models of priming. A model assuming two SV pools in parallel showed a reduced release probability of so-called "superprimed vesicles" while "normally primed" ones were unaffected. For the second model, which holds that vesicles transit sequentially from a loosely docked state to a tightly docked state before exocytosis, we found that knocking out Mover selectively decreased the release probability of tight state vesicles. These results indicate that Mover regulates a subclass of primed SVs in the mouse calyx of Held.

Keywords: Mover; neurotransmission; presynaptic plasticity; synaptic vesicles; vesicle priming.


Conflict of interest statement

The authors declare no competing interest.

Figures

Fig. 1.
Fig. 1.
Basic synaptic transmission properties of the Mover KO. (A) Sample traces of spontaneous synaptic transmission. (BG) Properties of spontaneous synaptic activity. Each dot represents one synapse. (H) Sample traces of evoked EPSCs for WT and KO synapses. (IM) Properties of evoked EPSCs. (N) Paired pulse ratios in various ISIs. Asterisks denote a statistically significant difference. The gray and red shades represent the SEM. (Inset) Sample superimposed traces of evoked EPSCs at various ISIs. Each group of traces (WT or KO) belongs to a single cell. Statistics (BG): Frequency: WT: 3.42 ± 0.62 Hz, n = 8; KO: 2.81 ± 0.26 Hz, n = 12; t(9.516) = 0.92; P = 0.38; amplitude: WT: −30.75 ± 2.18 pA, n = 9; KO: −32.74 ± 1.78 pA, n = 12; t(19) = 0.714; P = 0.484; rise time: WT: 155.09 ± 11.86 μs, n = 9; KO: 166.72 ± 11.58 μs, n = 12; t(19) = −0.689; P = 0.499; half width: WT: 524.7 ± 19.91 μs, n = 9; KO: 587.15 ± 33.91 μs, n = 12; t(17.098) = −1.588; P = 0.131; τ fast: WT: 356.44 ± 14.09 μs, n = 9; KO: 392.38 ± 24.6 μs, n = 12; t(16.897) = −1.267; P = 0.222; τ slow: WT: 2.61 ± 0.32 ms, n = 9; KO: 2.64 ± 0.26 ms, n = 12; t(19) = −0.076; P = 0.94.
Fig. 2.
Fig. 2.
Short term plasticity. (A) Normalized EPSC amplitudes during a 100-Hz stimulation train. A monoexponential curve had a relatively better fit for the WT synapses [extra sum-of-squares F test; F = 1.970 (2,718), P = 0.14] whereas the KO synapses were best fit with a double exponential curve [F = 5.972 (2,715), P = 0.0027], indicating an underlying heterogeneity of the priming mechanisms. (Inset) Sample traces of responses to the same stimulation. (B) Time constant of decay (ISI) for the short-term depression (STD) curve of 100 Hz stimulation. The simplest, monoexponential model was chosen to formally compare both groups in the 100-Hz stimulation EPSC amplitude plot. *Difference in Akaike’s corrected Information Criterion = 9.5, comparison between a simpler model where tau is the same for both data sets and a complex model where tau is different for each data set. (C) Steady-state EPSC amplitude levels for a 100-Hz stimulation train. The values of the last 20 EPSCs of each train were taken into account. Each dot represents one synapse. (D) Cumulative plot of EPSC amplitudes during a 100-Hz stimulation train. The regression lines were fit to the last 10 values of each curve and then back-extrapolated to stimulus no. 1. (E) RRP size as determined from the point of intersection between the regression lines and the y axis. (F) Replenishment rate as determined from the slope of the regression lines. (G) The pr of the WT and KO synapses. *P = 0.05, independent-samples t test. (H) Recovery of the EPSC amplitude in various time intervals from a depletion stimulus. (Inset) Sample superimposed traces of evoked EPSCs at various intervals after a depletion stimulus. Each group of traces (WT or KO) was recorded from a single cell. The gray and red shades represent the SEM.
Fig. 3.
Fig. 3.
Superpriming model. (A) An SV can be either in the normally primed or in the superprimed state. Each state has its own replenishment rate and release probability. (B) Two examples of WT synapses. One has a small initial EPSC amplitude, and the other a large one. Both converge toward the same EPSC levels after a few high-frequency stimulations. (C) A similar example for two KO synapses. Even after 20 stimulations, they still retain some degree of their initial differences. (D) Isolation of the superprimed component of the EPSC high-frequency trains (circles). The time constant of an exponential fit to the data points is larger for the KO synapses, indicating a lower superprimed SV release probability for that group. Similarly, the y axis intersection of a straight line fit to the late data points of the cumulative plot indicates a lower release probability for the superprimed SVs of the KO cells (crosses). The small bump in the cumulative plot between stimulus numbers 5 and 15 is an indication of postsynaptic receptor desensitization, mostly at the high EPSC1 synapses. (Inset) The first 10 traces of the cumulative graph, expanded. (E) Four representative examples of EPSC trains predepleted by a low-frequency train. All have a similar time constant of decay, indicating a similar range of release probabilities for the normally primed SVs. Although the curves converge to very similar levels, for the given phenotypes, this level is slightly different for WT and KO synapses.
Fig. 4.
Fig. 4.
Analysis by a sequential-release model involving loose and tight docking states of SVs. (A) The conformational states an SV can have according to the model. Release occurs only or predominantly from the TS. (B) Two-component decomposition at the WT synapses. Solid lines show the component contributed by SVs, which had been in the TS at stimulus onset. Dashed lines indicate the component contributed by SVs, which had been in the loose or recruited state (LS-RS) at stimulus onset. (Inset) Pool sizes for the tight-state (solid line) and for the loose- and recruited-state component (dashed line) for each of the synapses that were analyzed. (C) Similarly, a two-component decomposition for the KO synapses. (Inset) Pool sizes for the TS and LS-RS components for each of the cells that were analyzed. (D) The initial release probability of the TS SVs for a two-component decomposition. *P < 0.0005, independent-samples t test. (E) The SV abundances of the RS/LS pools for WT and KO synapses for a two-component decomposition. Each dot represents one frequency stimulation train at one synapse. (F) Likewise, sizes of TS pools for WT and KO synapses. Each dot represents train data at a single frequency at one synapse. *P = 0.033, two-way mixed ANOVA. (G) Three-component decomposition at the WT synapses. Solid lines show the TS component. Dashed lines indicate the LS component while solid thin lines show the RS component. (Inset) Pool sizes for the TS (solid lines), for the LS (dashed lines), and RS component (solid thin lines) for each of the synapses that were analyzed. (H) Similarly, a three-component decomposition for the KO synapses. (Inset) Pool sizes for the TS, LS, and RS components for each of the cells. (I) The initial release probability of the TS SVs based on a three-component decomposition [WT: 0.48 ± 0.014, KO: 0.36 ± 0.009, independent-samples t test, t(10) = 7.075, *P < 0.0001]. (JL) The SV abundances of the RS, LS, and TS pools for WT and KO synapses, respectively, for a three-component decomposition. Each dot represents stimulation trains at a single frequency at one synapse: (J) WT: 170 ± 22 SVs, KO: 199.6 ± 20.4 SVs, f(1, 11) = 0.97, P = 0.346, partial η2 = 0.081, (K) WT: 218.4 ± 26.1 SVs, KO: 270.5 ± 24.2 SVs, f(1, 11) = 2.139, P = 0.172, partial η2 = 0.163, (L) WT: 108.2 ± 17.4 SVs, KO: 158.9 ± 16.1 SVs, f(1, 11) = 4.585, P = 0.055, partial η2 = 0.294.

References

    1. Südhof T. C., The presynaptic active zone. Neuron 75, 11–25 (2012). - PMC - PubMed
    1. Südhof T. C., Neurotransmitter release: The last millisecond in the life of a synaptic vesicle. Neuron 80, 675–690 (2013). - PMC - PubMed
    1. Wojcik S. M., Brose N., Regulation of membrane fusion in synaptic excitation-secretion coupling: Speed and accuracy matter. Neuron 55, 11–24 (2007). - PubMed
    1. Zucker R. S., Regehr W. G., Short-term synaptic plasticity. Annu. Rev. Physiol. 64, 355–405 (2002). - PubMed
    1. Xue R., et al. , Doc2-mediated superpriming supports synaptic augmentation. Proc. Natl. Acad. Sci. U.S.A. 115, E5605–E5613 (2018). - PMC - PubMed

Publication types

MeSH terms