. 2021 Jan 11;12(1):223.
doi: 10.1038/s41467-020-20400-z.

BET inhibition disrupts transcription but retains enhancer-promoter contact

Affiliations

BET inhibition disrupts transcription but retains enhancer-promoter contact

Nicholas T Crump et al. Nat Commun. .

Abstract

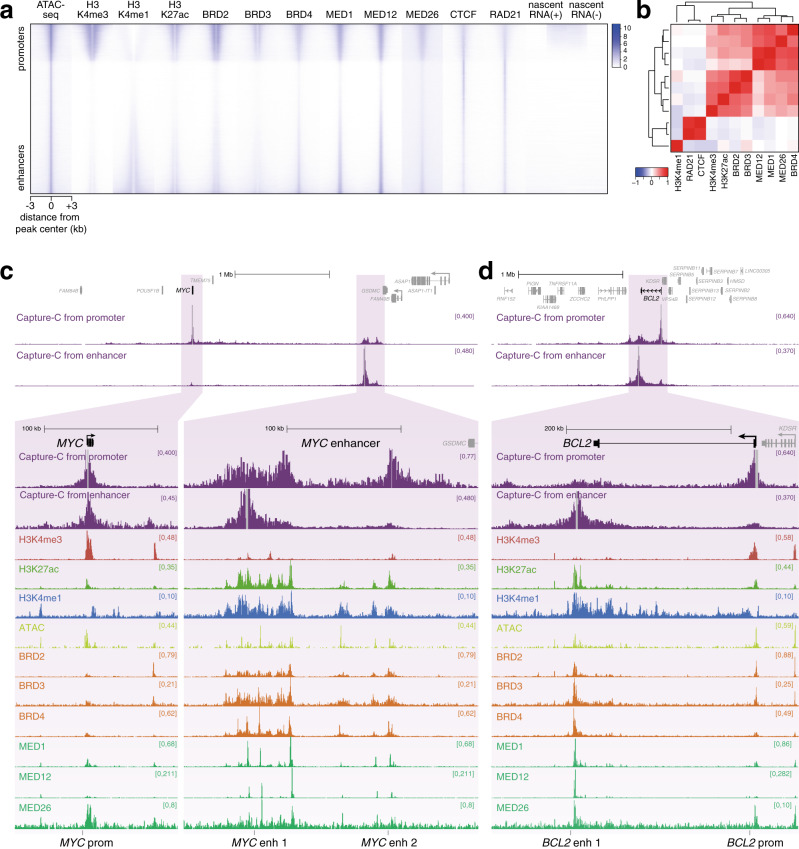
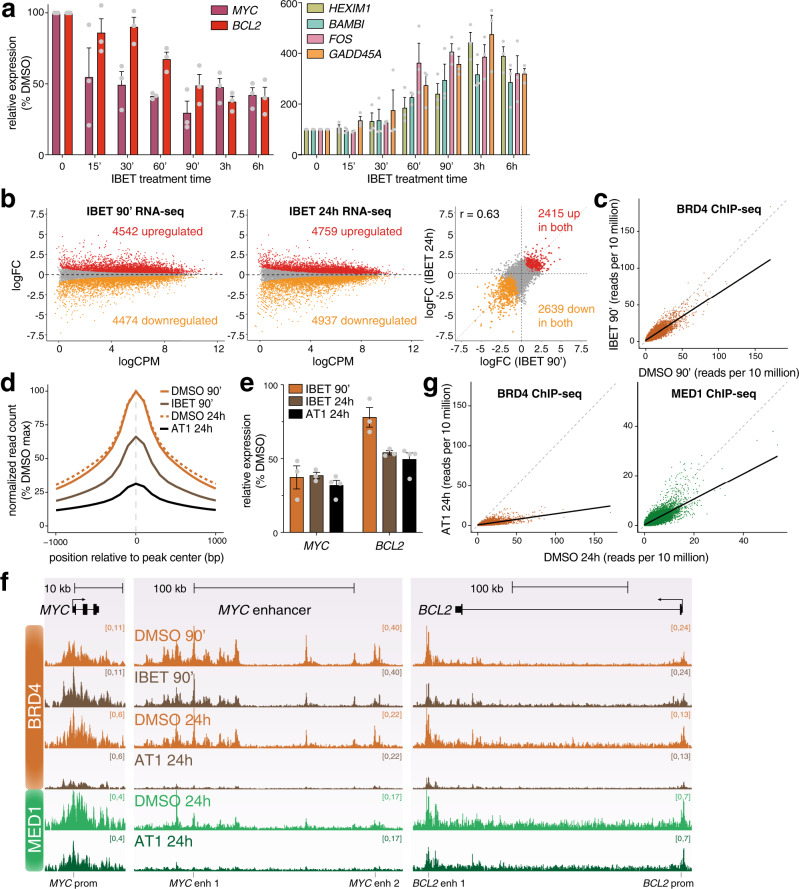
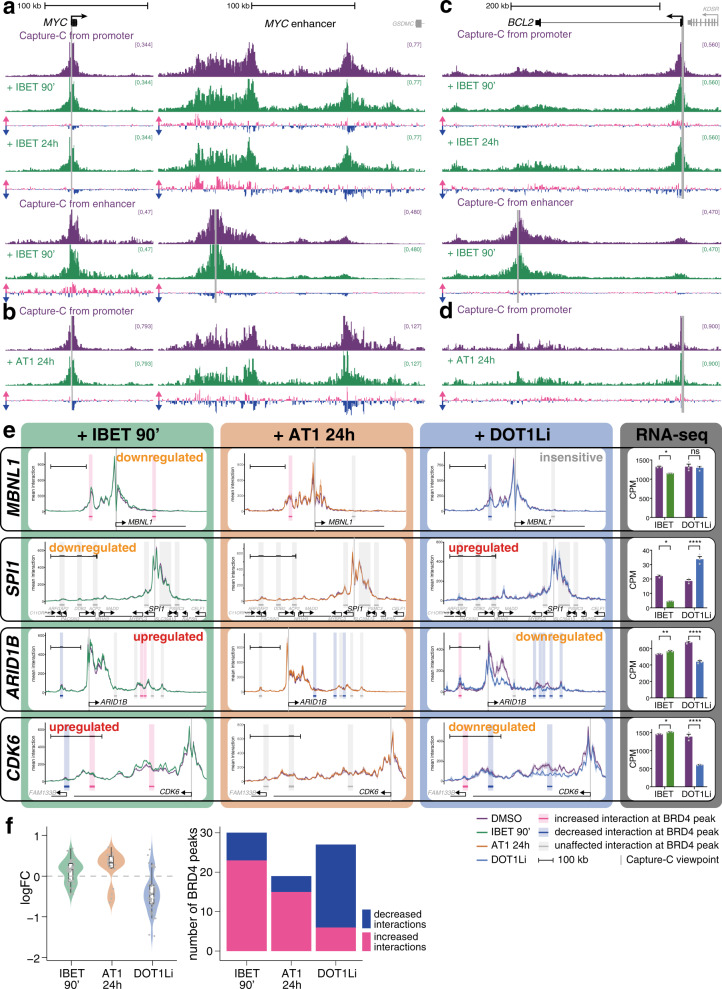
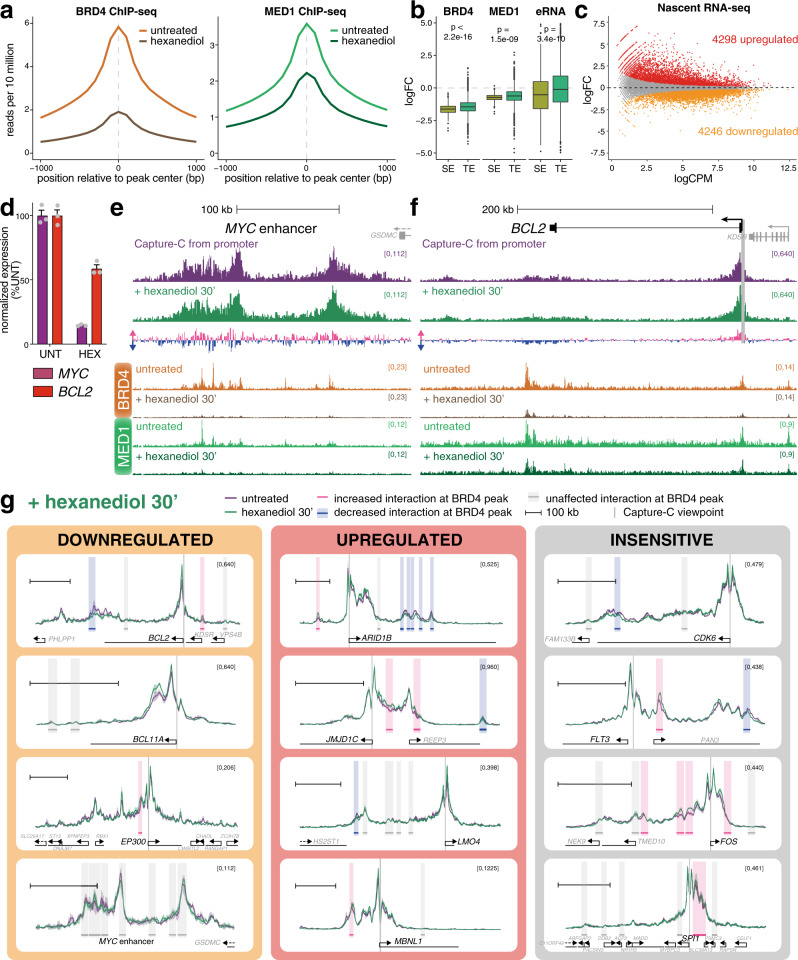
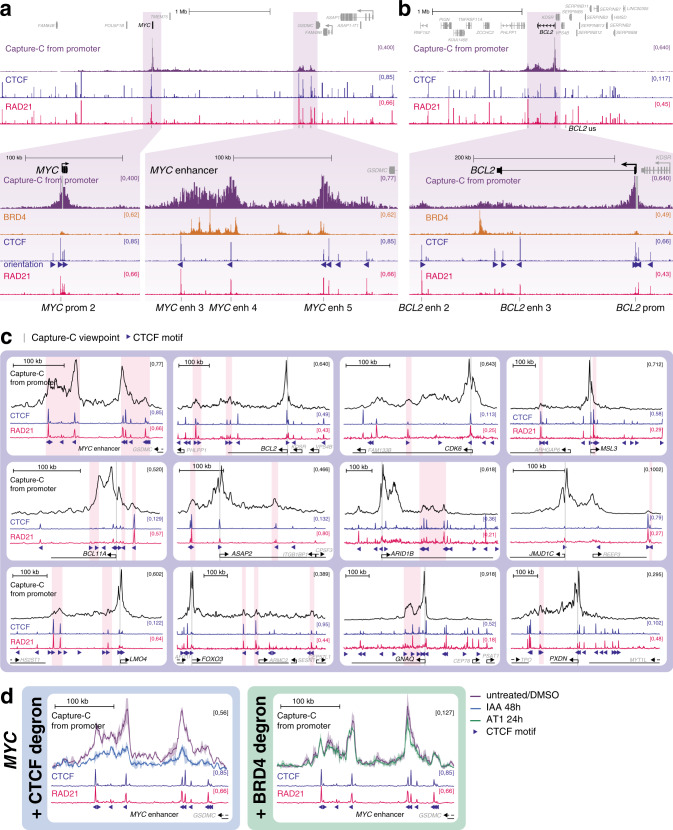
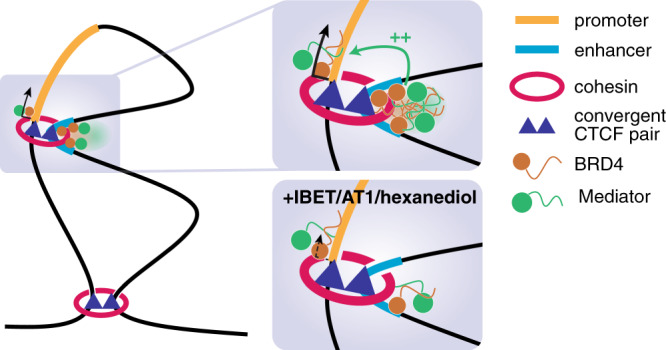
Enhancers are DNA sequences that enable complex temporal and tissue-specific regulation of genes in higher eukaryotes. Although it is not entirely clear how enhancer-promoter interactions can increase gene expression, this proximity has been observed in multiple systems at multiple loci and is thought to be essential for the maintenance of gene expression. Bromodomain and Extra-Terminal domain (BET) and Mediator proteins have been shown capable of forming phase condensates and are thought to be essential for super-enhancer function. Here, we show that targeting of cells with inhibitors of BET proteins or pharmacological degradation of BET protein Bromodomain-containing protein 4 (BRD4) has a strong impact on transcription but very little impact on enhancer-promoter interactions. Dissolving phase condensates reduces BRD4 and Mediator binding at enhancers and can also strongly affect gene transcription, without disrupting enhancer-promoter interactions. These results suggest that activation of transcription and maintenance of enhancer-promoter interactions are separable events. Our findings further indicate that enhancer-promoter interactions are not dependent on high levels of BRD4 and Mediator, and are likely maintained by a complex set of factors including additional activator complexes and, at some sites, CTCF and cohesin.


Conflict of interest statement

T.A.M. is a founding shareholder of OxStem Oncology (OSO), a subsidiary company of OxStem Ltd. J.O.J.D. is a co-founder of Nucleome Therapeutics Ltd. to which he provides consultancy. All other authors have no competing interests.

Figures

Fig. 1
Fig. 1. BET proteins and Mediator are a key feature of enhancers.
a Heatmap comparing levels of histone modifications, chromatin proteins and stranded nascent RNA-seq at ATAC-seq peaks in SEM cells. Peaks are ranked based on the relative levels of H3K4me3 and H3K4me1, placing promoter-like ATAC-seq peaks towards the top and enhancer-like ATAC-seq peaks towards the bottom. b Pearson correlation coefficients for ChIP-seq data at ATAC-seq peaks shown in a. Dendrogram shows hierarchical clustering of datasets. Source data are provided as a Source Data file. c Capture-C, ChIP-seq and ATAC-seq at the MYC gene and enhancer region in SEM cells. Capture-C was conducted using the MYC promoter or enhancer region as the viewpoint, indicated by vertical gray bars, and is displayed as the mean of three biological replicates. Locations of primers used for BRD4/Mediator ChIP-qPCR are shown at the bottom of the figure. d Capture-C, ChIP-seq, and ATAC-seq data at BCL2, as in c.
Fig. 2
Fig. 2. IBET treatment results in large-scale transcriptional changes.
a Left: qRT-PCR analysis of gene expression following 1 µM IBET-151 treatment for the indicated times, using intronic PCR primers. Right: qRT-PCR analysis of gene expression using mature mRNA PCR primers. Values are normalized to YWHAZ mature mRNA levels, relative to DMSO treatment. Mean of three biological replicates; error bars show SEM. Source data are provided as a Source Data file. b MA plots for changes in nascent RNA levels following 90 min (left) or 24 h (middle) treatment with IBET. Right: correlation of log2 fold-change (logFC) of gene expression following IBET treatment for 90 min or 24 h. Statistically significant differences (red: increased; orange: decreased; gray: unchanged) from three biological replicates, FDR < 0.05. c Reference-normalized BRD4 ChIP-seq reads at BRD4 peaks from SEM cells treated with DMSO (x-axis) or IBET (y-axis) for 90 min. Solid line shows data trend (generalized additive model). d Metaplot of reference-normalized mean BRD4 levels at BRD4 peaks in SEM cells treated with DMSO (solid orange) or IBET (brown) for 90 min, or DMSO (dashed orange) or AT1 (black) for 24 h. Data are normalized to the peak DMSO read count for each treatment time. e qRT-PCR analysis of gene expression following IBET or AT1 treatment using mature mRNA PCR primers. Values are normalized to YWHAZ mature mRNA levels, relative to DMSO treatment. Mean of three (IBET treatments) or four (AT1 treatment) biological replicates; error bars show SEM. Source data are provided as a Source Data file. f Reference-normalized BRD4 and MED1 ChIP-seq at the MYC gene and enhancer and at BCL2. SEM cells were treated with DMSO or 1 µM IBET for 90 min, followed by BRD4 ChIP-seq, or with DMSO or 1 µM AT1 for 24 h, followed by BRD4 and MED1 ChIP-seq. g Reference-normalized BRD4 (orange) and MED1 (green) ChIP-seq reads at BRD4 peaks from SEM cells treated with DMSO (x-axis) or 1 µM AT1 (y-axis) for 24 h. Solid line shows data trend (generalized additive model).
Fig. 3
Fig. 3. BET inhibition has minimal effects on enhancer–promoter interactions.
a Capture-C from the MYC promoter (above) or enhancer (below) following 90 min DMSO treatment (purple) or 90 min or 24 h 1 µM IBET treatment (green). Only the promoter and enhancer regions are shown. Differential tracks show the change in profile in IBET-treated samples compared to DMSO treatment for the same time period: pink bars show increases; blue bars show decreases. Mean of three biological replicates. b Capture-C from the MYC promoter following 24 h DMSO (purple) or 1 µM AT1 treatment (green), as in (a). c, d Capture-C from the BCL2 promoter or enhancer, as in a, b. e Capture-C traces from gene promoters following treatment with DMSO (purple line), IBET for 90 min (left, green line), AT1 for 24 h (middle left, orange line) or EPZ-5676 for 7d (DOT1Li, middle right, blue line). Ribbon shows ±1 SD for three replicates. Vertical gray bar indicates the capture point for each gene. Horizontal bars show 10 kb region around BRD4 ChIP-seq peaks. Shading highlights effect of IBET treatment on promoter interaction frequency within that window: pink bars indicate statistically significant increases; blue bars indicate decreases; gray bars indicate no significant difference (Holm–Bonferroni adjusted p-value < 0.05, paired Mann–Whitney test; adjusted P-values are given in Supplementary Data 3). Scale bars show 100 kb. Transcriptional effect of the drug treatment on the gene is indicated. Right: Nascent RNA-seq levels for each gene under control or indicated treatment conditions. ****FDR < 0.0001, **FDR < 0.01, *FDR < 0.05, ns no significant change; FDR values are given in Supplementary Data 2. Mean of three biological replicates; error bars show SEM. DOT1Li Capture-C and RNA-seq data are taken from. f Left: change in interaction frequency (mean logFC of three replicates) between promoters and BRD4 peaks (10 kb windows) of significantly affected (Holm–Bonferroni adjusted p-value < 0.05, paired Mann–Whitney test; adjusted P-values are given in Supplementary Data 3) interactions following 90 min IBET, 24 h AT1, or 7d DOT1Li treatment. Nonsignificantly affected interactions are not plotted. Violin plot shows frequency distribution. Boxplot midline shows median, with upper and lower hinges showing 25th and 75th percentile, respectively. Upper and lower hinges extend to the largest and smallest datapoints within 1.5 times the interquartile range of either hinge. Dots represent individual BRD4 peaks. Source data are provided as a Source Data file. Right: number of BRD4 peaks (10 kb windows) that show statistically significant increased (pink) or decreased (blue) interactions following 90 min IBET, 24 h AT1, or 7d DOT1Li treatment.
Fig. 4
Fig. 4. Dissolution of phase condensate structures with 1,6-hexanediol does not perturb enhancer–promoter interactions.
a Metaplot of reference-normalized mean BRD4 and MED1 levels at BRD4 peaks in untreated SEM cells (light color) or cells treated with 1.5% 1,6-hexanediol for 30 min (dark color). b Boxplot showing the log2 fold-change (logFC) in reference-normalized levels of BRD4 and MED1 and nascent RNA at super-enhancers (SE; olive), or typical enhancers (TE; green) following treatment with 1.5% 1,6-hexanediol for 30 min. Nascent RNA (eRNA) was measured over 1 kb windows centered on intergenic ATAC-seq peaks overlapping with SEs and TEs. p values indicate the statistical significance of the difference in logFC between SEs and TEs (Wilcoxon rank sum test; for BRD4, p < 2.2 × 10−16; MED1, p = 1.5 × 10−9; eRNA, p = 3.4 × 10−10). Midline shows median, with upper and lower hinges showing 25th and 75th percentile, respectively. Upper and lower hinges extend to the largest and smallest datapoints within 1.5 times the interquartile range of either hinge; outliers are plotted as dots. Analysis of one experiment (BRD4 and MED1 ChIP-seq) or three independent experiments (eRNA). c MA plot of changes in nascent RNA levels following 30 min treatment with 1.5% 1,6-hexanediol. Mean of three biological replicates. Statistically significant differences (red: increased; orange: decreased; gray: unchanged) from three biological replicates, FDR < 0.05. d Quantification of MYC and BCL2 nascent RNA-seq levels in untreated SEM cells or cells treated with 1.5% 1,6-hexanediol for 30 min. Mean of three biological replicates, normalized to expression in untreated cells; error bars show SEM. Source data are provided as a Source Data file. e Capture-C from the MYC promoter from untreated SEM cells (purple) or following 30 min treatment with 1.5% 1,6-hexanediol (green), mean of three biological replicates. Differential tracks show the change in profile in hexanediol-treated samples: pink bars show increases; blue bars show decreases. Reference-normalized BRD4 and MED1 ChIP-seq from untreated SEM cells and cells treated with 1,6-hexanediol for 30 min. Only the enhancer region is shown. f Capture-C from the BCL2 promoter and reference-normalized ChIP-seq, as in e. g Capture-C traces at genes that are transcriptionally downregulated (orange), upregulated (red) or unaffected (gray) by 30 min 1,6-hexanediol treatment. Purple line shows the profile in untreated cells; green line is from hexanediol-treated cells; ribbon shows ±1 SD for three replicates. Vertical gray bar indicates the capture point for each gene. Horizontal bars show 10 kb region around BRD4 ChIP-seq peaks. Shading highlights effect of hexanediol treatment on promoter interaction frequency within that window: pink bars indicate statistically significant increases; blue bars indicate decreases; gray bars indicate no significant difference (Holm–Bonferroni adjusted p-value < 0.05, paired Mann–Whitney test; adjusted P-values are given in Supplementary Data 3). Scale bar shows 100 kb.
Fig. 5
Fig. 5. CTCF and RAD21 may be responsible for mediating enhancer–promoter interactions at MYC and BCL2.
a Capture-C and ChIP-seq for BRD4, CTCF and RAD21 at the MYC gene and enhancer region. Capture-C was conducted using the MYC promoter as the viewpoint, indicated by a vertical gray bar, mean of three biological replicates. Orientation of CTCF motifs at peaks is indicated by triangles. Locations of primers used for CTCF/RAD21 ChIP-qPCR (see Supplementary Fig. 5) are shown at the bottom of the figure. b Capture-C and ChIP-seq data at BCL2, as in a. c Capture-C traces from untreated cells (black line; mean of three replicates) and ChIP-seq for CTCF (blue) and RAD21 (pink). Vertical gray bar indicates the capture point for each gene. Orientation of CTCF motifs at peaks is indicated by triangles. Scale bars show 100 kb. Pink shading highlights promoter-interacting regions that overlap with CTCF/RAD21 peaks (visually determined). d Left: Capture-C profile from the MYC promoter showing the MYC enhancer in SEM cells with AID-tagged CTCF, either untreated (purple line) or treated with indole-3-acetic acid (IAA) for 48 h (blue line), which targets CTCF for degradation. Data are replotted from, mean of two independent clones. Right: Capture-C profile from the MYC promoter showing the MYC enhancer in SEM cells treated with DMSO (purple line) or AT1 (green line) for 24 h, mean of three biological replicates. CTCF (blue) and RAD21 (pink) ChIP-seq tracks and CTCF motif orientations (triangles) are shown.
Fig. 6
Fig. 6. Model for enhancer–promoter interaction.
Higher-order chromatin boundaries are maintained by cohesin loops associated with convergent CTCF dimers. Within a domain, many enhancer–promoter contacts are associated with RAD21/CTCF peaks, and we suggest that similar cohesin loops are required for a subset of these interactions. At some enhancers (for example super-enhancers) a high concentration of factors such as BRD4 and Mediator drive the formation of phase condensates, and these may increase interactions with factors at the promoter, held nearby by cohesin loops. These interactions may be required to activate or increase transcription from the promoter. Upon addition of IBET, AT1, or 1,6-hexanediol, BRD4 and Mediator binding is reduced at the enhancer and phase condensates are dissolved, disrupting interaction with factors at the promoter. This disrupts gene expression, but does not affect enhancer–promoter proximity as the two loci remain held together by other factors, for example cohesin.

References

    1. Furlong EEM, Levine M. Developmental enhancers and chromosome topology. Science. 2018;361:1341–1345. doi: 10.1126/science.aau0320. - DOI - PMC - PubMed
    1. Long HK, Prescott SL, Wysocka J. Ever-changing landscapes: transcriptional enhancers in development and evolution. Cell. 2016;167:1170–1187. doi: 10.1016/j.cell.2016.09.018. - DOI - PMC - PubMed
    1. Hnisz D, Shrinivas K, Young RA, Chakraborty AK, Sharp PA. A phase separation model for transcriptional control. Cell. 2017;169:13–23. doi: 10.1016/j.cell.2017.02.007. - DOI - PMC - PubMed
    1. Vermunt MW, Zhang D, Blobel GA. The interdependence of gene-regulatory elements and the 3D genome. J. Cell Biol. 2019;218:12–26. doi: 10.1083/jcb.201809040. - DOI - PMC - PubMed
    1. Alexander JM, et al. Live-cell imaging reveals enhancer-dependent Sox2 transcription in the absence of enhancer proximity. elife. 2019;8:e41769. doi: 10.7554/eLife.41769. - DOI - PMC - PubMed

Publication types

MeSH terms