. 2021 Jan 11;12(1):272.
doi: 10.1038/s41467-020-20589-z.

Statistically defined visual chunks engage object-based attention

Affiliations

Statistically defined visual chunks engage object-based attention

Gábor Lengyel et al. Nat Commun. .

Abstract

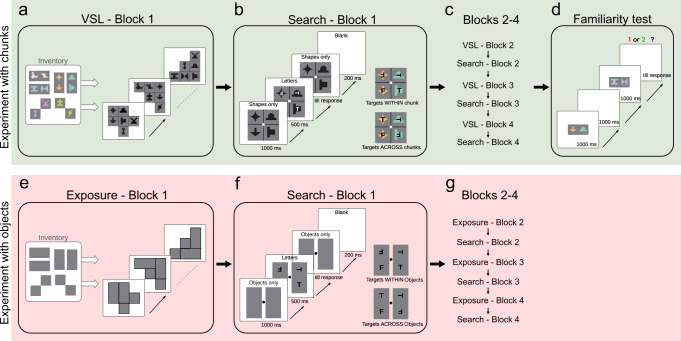
Although objects are the fundamental units of our representation interpreting the environment around us, it is still not clear how we handle and organize the incoming sensory information to form object representations. By utilizing previously well-documented advantages of within-object over across-object information processing, here we test whether learning involuntarily consistent visual statistical properties of stimuli that are free of any traditional segmentation cues might be sufficient to create object-like behavioral effects. Using a visual statistical learning paradigm and measuring efficiency of 3-AFC search and object-based attention, we find that statistically defined and implicitly learned visual chunks bias observers' behavior in subsequent search tasks the same way as objects defined by visual boundaries do. These results suggest that learning consistent statistical contingencies based on the sensory input contributes to the emergence of object representations.


Conflict of interest statement

The authors declare no competing interests.

Figures

Fig. 1
Fig. 1. The stimuli, the tasks, and the design of Experiment 1.
ad The design of Experiments 1a and 1b using statistical chunks defined by co-associated abstract shapes. In the Exposure blocks (a VSL - Block 1), true-pairs (Inventory) were used to generate 144 complex scenes for passive viewing. In the Search blocks (b Search - Block 1), observers performed a letter search task with white letters superimposed on the shapes, where the two target letters could be within or across pairs (b inset, using black letters for visibility). Exposure and Search blocks were presented in an alternating manner (c Blocks 2–4). After the last Search block, a standard VSL Familiarity test was administered to measure the observer’s bias to true chunks over random combinations of elements (c Familiarity test). Coloring of the shapes in this figure is only for demonstration purposes, all shapes in the displays were shown in black with no indication of chunk identity. eg The design of Experiment 1c using objects defined by visual boundary cues. In the Exposure blocks (e Exposure - Block 1), rectangles and squares were used that corresponded to the silhouettes of the pairs in Experiments 1a and 1b. In the Search blocks (f Search - Block 1), observers performed a letter search task with letters appearing in separated rectangles and squares. f (insets) Trials within (top) and across (bottom) object setups of targets. The block design of Exp 1c followed that of Experiments 1a and b (g Blocks 2–4). The shapes and the letters are magnified in the figure compared to the actual experimental displays.
Fig. 2
Fig. 2. Chunk- and object-based error rate effects in Experiment 1.
af Chunk/object-based error rate (ac) and reaction time (df) effects across Exps 1a, 1b, and 1c. Mean error rate and median reaction time differences between the across-chunk and within-chunk trials (y axis) in each Search block (x axis) in the main (a) and in the replication (b), and in the control (c) experiments. Positive values mean fewer errors or faster responses in within-chunk compared to across-chunk trials and error bars show the 95% confidence intervals of the mean. Colored dots represent the mean error rates or median reaction time differences of the observers in a given block. g, h The relationship between performance in the Familiarity test (x axis) and error rate differences of the across-chunk vs. within-chunk trials in the first block (y axis) in the main (g) and in the replication (h) experiments. Green error ellipses show one standard deviation and green lines represent best-fitting linear regression lines. The error bars show the 95% confidence intervals of the mean performance in the Familiarity test (orange), and of the average chunk-based error rate effect (blue). n = 30 in Exp. 1a (a, d, g), n = 30 in Exp. 1b (b, e, h), and n = 20 in Exp. 1c (c, f). Significant differences from zero in af are indicated with ns.p > 0.05, *p < 0.05, **p < 0.01, ***p < 0.001, two-tailed paired (the difference between across and within-chunk trials) t-tests. R-values in g and f indicate Pearson correlation coefficients. Source data are provided in the Source Data file (Fig. 2 worksheet tab in Source Data.xlsx).
Fig. 3
Fig. 3. The stimuli, the tasks, and the trial structures in Experiment 2.
a Chunk-based attention paradigm. b Object-based attention paradigm. a, b Top-left insets display the expected results in the two paradigms (longer RTs when the target appears on the uncued chunk/object vs. cued chunk/object). Bottom-right insets in a, b present two examples of trials, in which the target (T) appeared on the cued (green label) and on the uncued (red label) chunks/objects. The design, the visual statistical learning, and the Familiarity test were identical to Exp. 1 (Fig. 1). The shapes and the letters are magnified in the figure compared to the actual experimental displays.
Fig. 4
Fig. 4. Chunk- and object-based attentional effects in Experiment 2.
a The cue-validity effect for chunks (blue) and objects (red). Dots represent the individual observers’ validity effect defined as the difference between the median reaction times (right) and mean error rates (left) in the invalid- (uncued) and valid-cue (cued) trials. b Correlation between object-based (x axis) and chunk-based (y axis) cue validity with dots representing the corresponding validity effect for each observer. c The chunk-based (CBA, blue) and object-based attention (OBA, red) effects. Dots represent the individual observers’ OBA/CBA effect defined as the difference between the median reaction times (right) and mean error rates (left) in trials with the target being in an uncued vs. cued chunk/object. d Correlation between object-based (x axis) and chunk-based (y axis) attention effects on reaction times with dots representing the corresponding attention effect for each observer. e Correlation between the learned statistical structure and the CBA effect with dots in the scatter plot representing each observer’s percent correct values in the Familiarity test (x axis, mean in orange) and the extent of their CBA effect (y axis, mean in blue). f Within-subject consistency between learning chunks and the evoked CBA effect. Green dots represent the observer’s Pearson correlation coefficient between their fraction correct scores and the extent of the CBA effect for each individual chunk. In all plots, error bars denote the 95% confidence intervals of the mean, error ellipses cover one standard deviation, and solid lines represent best-fitting linear regression lines. In the axis labels, RT stands for reaction time and ER stands for error rate. n = 90 in the blocks with statistical chunks (a, c, e, f in blue and green), and n = 44 in the blocks with geometric objects (ad in red and green). Significant differences from zero in a, c, and f are indicated with ns.p > 0.05, *p < 0.05, **p < 0.01, ***p < 0.001, two-tailed paired (difference between uncued and cued or invalid and valid chunk/object trials) t-tests. R-values in b, d, and e indicate Pearson correlation coefficients. Source data are provided in the Source Data file (Fig. 4 worksheet tab in Source Data.xlsx).

References

    1. Spelke ES. Principles of object perception. Cogn. Sci. 1990;14:29–56. doi: 10.1207/s15516709cog1401_3. - DOI
    1. Kellman PJ, Spelke ES. Perception of partly occluded objects in infancy. Cogn. Psychol. 1983;15:483–524. doi: 10.1016/0010-0285(83)90017-8. - DOI - PubMed
    1. Palmer SE, Rock I. Rethinking perceptual organization: the role of uniform connectedness. Psychon. Bull. Rev. 1994;1:29–55. doi: 10.3758/BF03200760. - DOI - PubMed
    1. Marr, D. Vision: A Computational Investigation Into the Human Representation and Processing of Visual Information (W. H. Freeman and Company, San Francisco, 1982).
    1. Peterson MA. Object recognition processes can and do operate before figure–ground organization. Curr. Direct. Psychol. Sci. 1994;3:105–111. doi: 10.1111/1467-8721.ep10770552. - DOI

Publication types