. 2021 Jan 11;12(1):210.
doi: 10.1038/s41467-020-20543-z.

Transcription shapes genome-wide histone acetylation patterns

Affiliations

Transcription shapes genome-wide histone acetylation patterns

Benjamin J E Martin et al. Nat Commun. .

Abstract

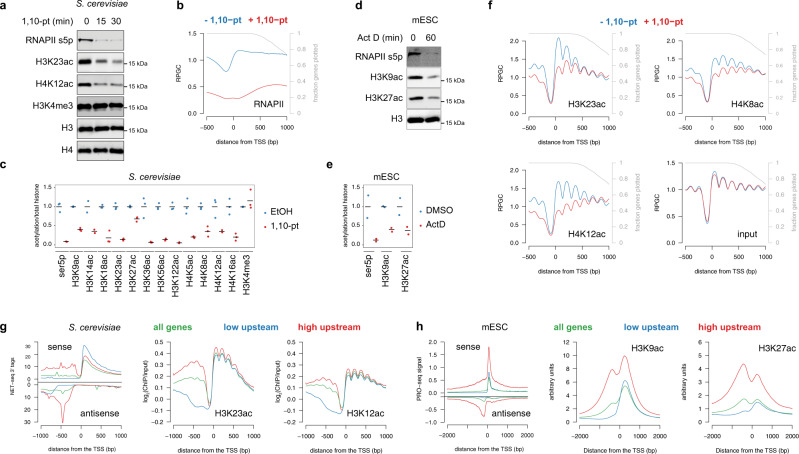
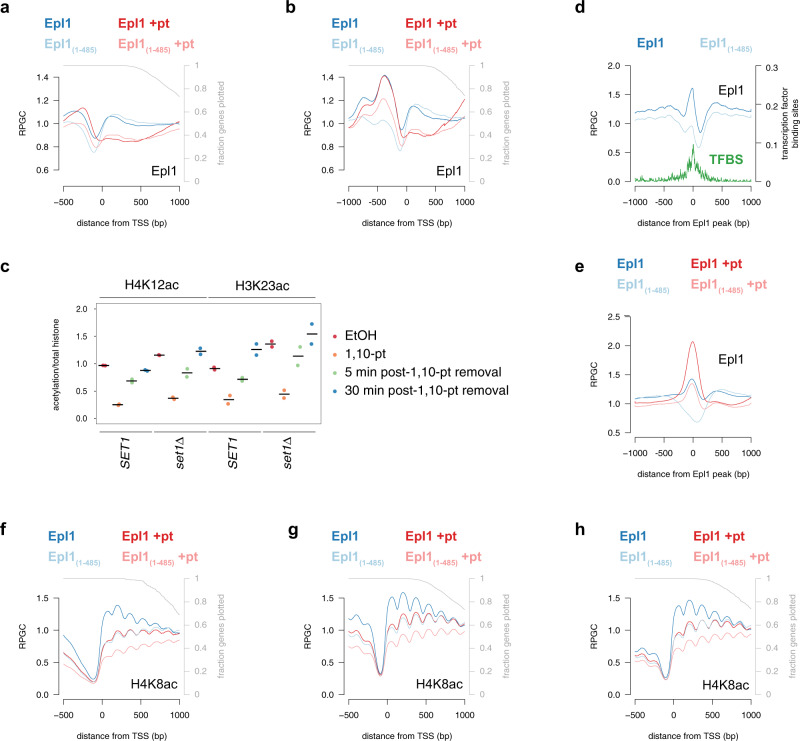
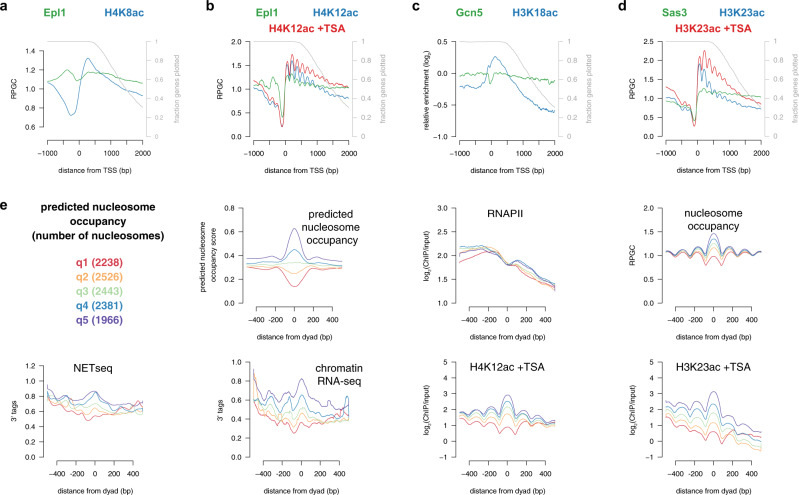
Histone acetylation is a ubiquitous hallmark of transcription, but whether the link between histone acetylation and transcription is causal or consequential has not been addressed. Using immunoblot and chromatin immunoprecipitation-sequencing in S. cerevisiae, here we show that the majority of histone acetylation is dependent on transcription. This dependency is partially explained by the requirement of RNA polymerase II (RNAPII) for the interaction of H4 histone acetyltransferases (HATs) with gene bodies. Our data also confirms the targeting of HATs by transcription activators, but interestingly, promoter-bound HATs are unable to acetylate histones in the absence of transcription. Indeed, HAT occupancy alone poorly predicts histone acetylation genome-wide, suggesting that HAT activity is regulated post-recruitment. Consistent with this, we show that histone acetylation increases at nucleosomes predicted to stall RNAPII, supporting the hypothesis that this modification is dependent on nucleosome disruption during transcription. Collectively, these data show that histone acetylation is a consequence of RNAPII promoting both the recruitment and activity of histone acetyltransferases.


Conflict of interest statement

The authors declare no competing interests.

Figures

Fig. 1
Fig. 1. The majority of histone acetylation is dependent on transcription.
a Whole-cell extracts from S. cerevisiae cells before and after treatment with 1,10-pt were subjected to immunoblot analysis with the indicated antibodies. Experiments were performed in triplicate with quantified results shown in (c). Raw immunoblot data is provided in the Source Data file. b Average profile of RNAPII (Rpb3 ChIP-seq) at 5206 transcribed genes aligned by the TSS before (blue) and after a 15 m treatment with 1,10-pt (red). Only data until the polyadenylation site (PAS) was included, and the gray line represents the fraction of genes still being plotted. RPGC reads per genomic coverage, TSS transcription start site. c Strip plots of histone PTM immunoblot signals normalized to histone H4 levels from three independent yeast whole-cell extracts from cultures without (blue) and with (red) a 15-min treatment with 1,10-pt. Horizontal lines indicate the mean, with the vehicle control set to 1. d Nuclear extracts from mouse ESCs before and after treatment with actinomycin D were subjected to immunoblot analysis with the indicated antibodies. Experiments were performed in duplicate with quantified results shown in (e). Raw immunoblot data is provided in the Source Data file. e Strip plots of histone acetylation immunoblot signals normalized to histone H3 from two mESC nuclear extracts from independent cultures without (blue) and with (red) actinomycin D. Horizontal lines indicate the mean, with the vehicle control set to 1. f Average profile of H3K23ac, H4K8ac, and H4K12ac (MNase ChIP-seq) and input at 5206 genes aligned by the TSS before (blue) and after (red) a 15-min treatment with 1,10-pt. Data from 1,10-pt-treated cells was normalized to untreated (see “Methods”). g The average signal relative to the TSS for S. cerevisiae NET-seq, H3K23ac, and H4K12ac ChIP-seq data relative to all genes (green) or 832 transcribed genes that have low (blue) or high (red) upstream NET-seq signal. The ChIP data is presented as log2(ChIP/input) as nucleosome density is not consistent between the different gene bins. h The average signal relative to the TSS for PRO-seq, and H3K9ac and H3K27ac ChIP-seq data relative to all genes (green) or 3035 transcribed genes that have low (blue) or high (red) upstream PRO-seq signal.
Fig. 2
Fig. 2. Transcription promotes the interaction of H4-specific HATs with chromatin.
a, b Average profile of Epl1 (dark lines) or Epl11–485 (light lines) ChIP-seq from sonicated extracts at all genes (5206) (a) or 832 unidirectional promoter genes (b) aligned by the TSS before (blue) and after (red) a 15-min treatment with 1,10-pt. Only data until the PAS was included, and the gray line represents the fraction of genes plotted for each position. Data from drug-treated and mutant cells were normalized to untreated wild-type (see “Methods”). RPGC reads per genomic coverage, TSS transcription start site. c Strip plots of histone acetylation immunoblot signals normalized to histone H4 levels from two independent yeast whole-cell extracts. Wild type and set1Δ cells were either untreated (red) or treated with 1,10-pt for 30 m, followed by TSA treatment for an additional 30 m (orange), before being washed into fresh media containing TSA. Samples were collected 5 (green) and 30 (blue) minutes post wash. Horizontal lines indicate the mean. d Average profile of Epl1 (dark blue) and Epl11–485 (light blue) ChIP-seq from MNase-treated chromatin relative to the center of 562 regions showing strong Epl1 peaks (peak coordinates are provided in the Source Data file). The abundance of transcription factor binding sites (TFBS) across the region is shown in green. e Average profile of Epl1 (dark lines) and Epl11–485 (light lines) ChIP-seq from sonicated extracts from cells before (blue) and after (red) a 15-min treatment with 1,10-pt, relative to the center of 562 regions showing strong Epl1 peaks. fh Average profiles of H4K8ac ChIP-seq from MNase-digested extracts from Epl1 (dark lines) and Epl11–485 (light lines)-expressing strains, before (blue) and after (red) a 15-min treatment with 1,10-pt, at genes with strong Epl1 peaks (f), all genes (g), or 832 genes with promoters lacking divergent transcription (h).
Fig. 3
Fig. 3. The activity of histone acetyltransferases are regulated post-recruitment.
a, b Average profiles of Epl1 (green) and H4 acetylation (blue) ChIP from sonicated (a) or MNase-digested chromatin (b) at 832 unidirectional promoter genes aligned by the TSS. Only data until the PAS was included, and the gray line represents the fraction of genes plotted for each position. Data from TSA-treated cells (red) was normalized to untreated wild-type (see “Methods”). RPGC reads per genomic coverage, TSS transcription start site. c, d Average profiles of Gcn5 (green) and H3K18ac (blue) ChIP from sonicated chromatin (c) and Sas3 (green) and H3K23ac (blue) ChIP from MNase-digested chromatin (d) at 832 unidirectional promoter genes aligned by the TSS. e Genic nucleosomes in the middle quintile for RNAPII occupancy [log2(Rpb3/input) 50 bp upstream and downstream of the nucleosome dyad] were divided into quintiles based on predicted nucleosome occupancy over the same region. Shown are profiles upstream and downstream of the nucleosome dyad for predicted nucleosome occupancy, RNAPII (Rpb3 ChIP-seq), nucleosome occupancy (MNase-seq), NET-seq, chromatin RNA-seq, and nucleosome-normalized H4K12ac and H3K23ac ChIP-seq from TSA-treated cells for the first (red), second (orange), third (green), fourth (blue), fifth (purple) quintiles for predicted nucleosome occupancy.

Comment in

References

    1. Van Holde, K. E. Chromatin. (Springer-Verlag, 1989).
    1. Rando OJ. Global patterns of histone modifications. Curr. Opin. Genet. Dev. 2007;17:94–99. - PubMed
    1. Friis RM, Schultz MC. Untargeted tail acetylation of histones in chromatin: lessons from yeast. Biochem. Cell Biol. 2009;87:107–116. - PubMed
    1. Lee KK, Workman JL. Histone acetyltransferase complexes: one size doesn’t fit all. Nat. Rev. Mol. Cell Biol. 2007;8:284–295. - PubMed
    1. Dion MF, Altschuler SJ, Wu LF, Rando OJ. Genomic characterization reveals a simple histone H4 acetylation code. Proc. Natl Acad. Sci. USA. 2005;102:5501–5506. - PMC - PubMed

Publication types

Grants and funding