. 2021 Jan 11;12(1):254.
doi: 10.1038/s41467-020-20509-1.

Data-independent acquisition method for ubiquitinome analysis reveals regulation of circadian biology

Affiliations

Data-independent acquisition method for ubiquitinome analysis reveals regulation of circadian biology

Fynn M Hansen et al. Nat Commun. .

Abstract

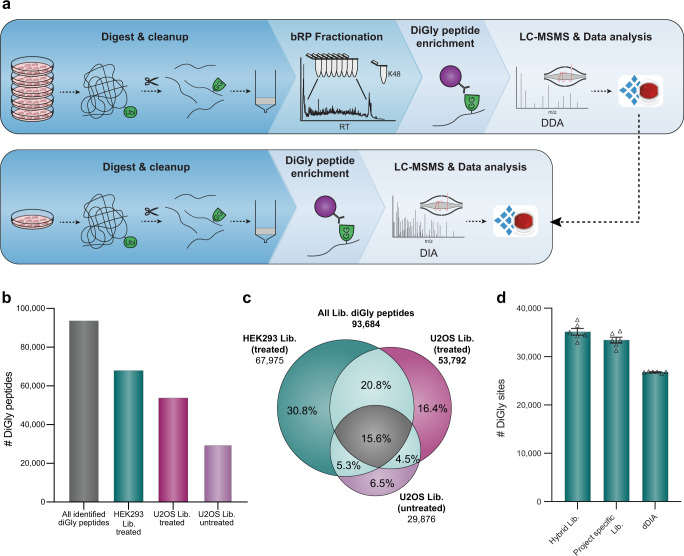
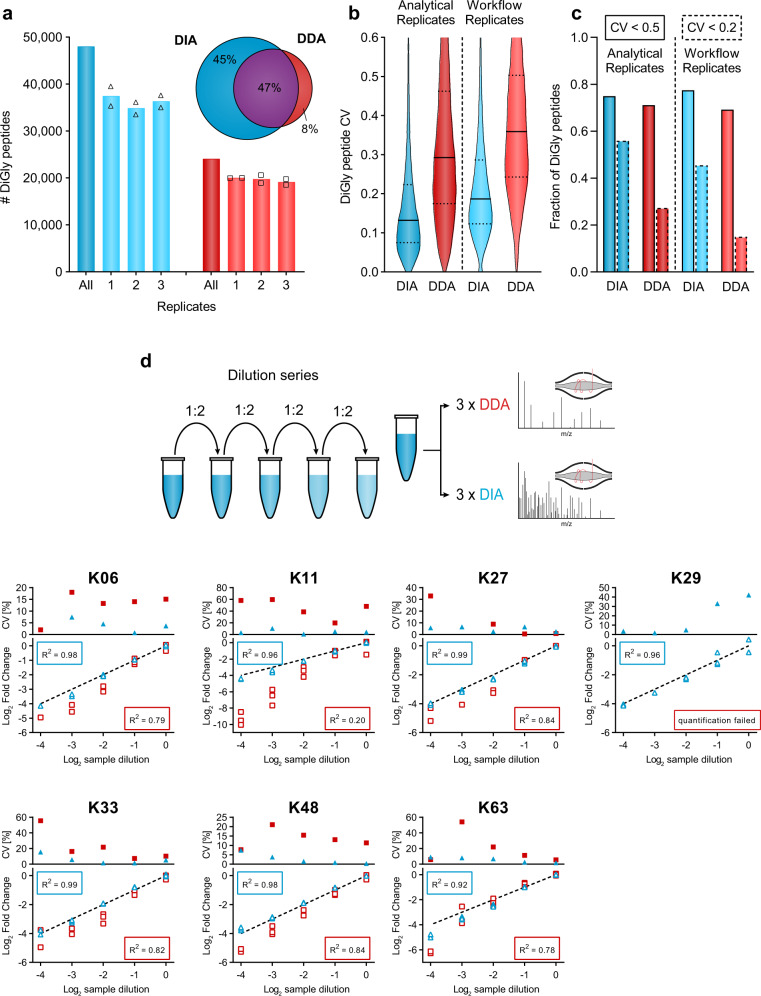
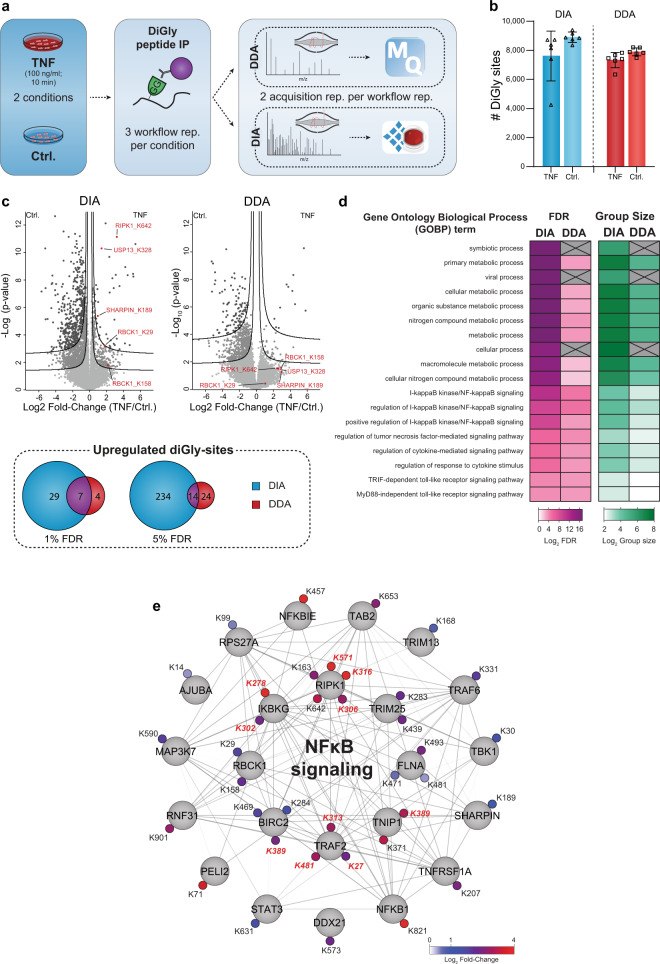
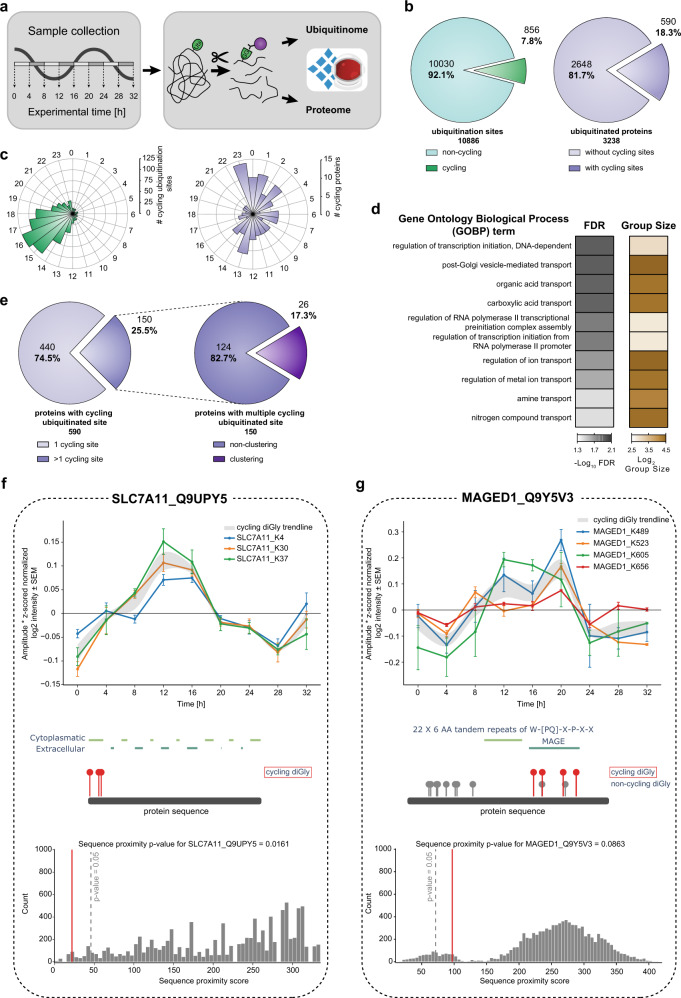
Protein ubiquitination is involved in virtually all cellular processes. Enrichment strategies employing antibodies targeting ubiquitin-derived diGly remnants combined with mass spectrometry (MS) have enabled investigations of ubiquitin signaling at a large scale. However, so far the power of data independent acquisition (DIA) with regards to sensitivity in single run analysis and data completeness have not yet been explored. Here, we develop a sensitive workflow combining diGly antibody-based enrichment and optimized Orbitrap-based DIA with comprehensive spectral libraries together containing more than 90,000 diGly peptides. This approach identifies 35,000 diGly peptides in single measurements of proteasome inhibitor-treated cells - double the number and quantitative accuracy of data dependent acquisition. Applied to TNF signaling, the workflow comprehensively captures known sites while adding many novel ones. An in-depth, systems-wide investigation of ubiquitination across the circadian cycle uncovers hundreds of cycling ubiquitination sites and dozens of cycling ubiquitin clusters within individual membrane protein receptors and transporters, highlighting new connections between metabolism and circadian regulation.


Conflict of interest statement

The authors declare no competing interests.

Figures

Fig. 1
Fig. 1. In-depth diGly proteomics for DIA identification.
a Experimental workflow for in-depth diGly peptide library construction (upper panel) and our single-run data-independent acquisition (DIA)-based workflow (lower panel). Protein digestion and peptide extraction are followed by basic reversed-phase (bRP) fractionation and diGly peptide enrichment. For library construction, samples were measured by data-dependent acquisition (DDA) and computationally processed (Spectronaut Pulsar). Individual samples are measured by our DIA workflow, including matching against a library for identification (Spectronaut software). b Number of identified diGly peptides in three different spectral libraries (MG132 treated HEK293 library—green, MG132 treated U2OS library—violet, U2OS library—light violet, all diGly peptides—gray). c Commonly and exclusively identified diGly peptides for different libraries (MG132 treated HEK293 library—green, MG132 treated U2OS library—violet, U2OS library—light violet). d Identified diGly sites (mean ± SEM) of MG132 treated HEK293 cells using different DIA library search strategies (n = 6, three workflow replicates measured in analytical duplicates). Source data are provided as a Source data file.
Fig. 2
Fig. 2. Accurate and reproducible diGly proteomics for DIA quantification.
a Number of identified diGly peptides (mean, n = 2) for data-independent acquisition (DIA, blue, HEK293 hybrid library) and data-dependent acquisition (DDA, red) strategies (n = 6, three workflow replicates measured in analytical duplicates). Venn diagram depicts the proportion of shared and exclusively identified diGly sites between DIA and DDA approaches. b Coefficient of variation (CV) value distribution for DIA and DDA approaches. Solid and dotted lines denote median and 1st or 3rd quantile, respectively. c Fractions of CV values below 50% and 20% are shown with solid and dotted lines, respectively. d Dilution series of diGly enriched sample. Plots show individual ubiquitin-chain linkage type peptides measured via DIA (blue) or DDA (red) (n = 3). Top panels depict CV values of replicate measurements. Bottom panels show individual measurements compared to the expected dilution depicted as dotted line. R2 values describe the goodness-of-fit of measured values to the expected dilution series (dotted line). Source data are provided as a Source data file.
Fig. 3
Fig. 3. DIA enables a detailed view of the TNF-regulated ubiquitinome.
a Workflow for ubiquitinome analysis in tumor necrosis factor (TNF) signaling. b Identified diGly sites (±SD) for TNF treated (100 ng/ml for 10 min) and control U2OS cells in data-independent acquisition (DIA, blue) and data-dependent acquisition (DDA, red) experiments (n = 6, three workflow replicates measured in analytical duplicates). c Volcano plot of significantly regulated diGly sites at 5% false discovery rate (FDR) (FDR controlled, two-sided t-test, randomizations = 250, s0 = 0.1) (lower line) and 1% (upper line) for DIA (blue) and DDA (red) and overlaps of significantly upregulated diGly sites for 1 and 5% FDR cutoffs (t-test, s0 = 0.1). d Overrepresentation analysis of gene ontology biological process (GOBP) terms filtered for 5% corrected FDR (Fisher’s Exact test). e Cytoscape network of proteins with significantly upregulated diGly sites in DIA that are associated with NFκB signaling (GO 0043122; GO 0051092; 5% FDR). Upregulated diGly sites also captured by DDA are marked in red (5% FDR). Source data are provided as a Source data file.
Fig. 4
Fig. 4. Quantification of the rhythmic ubiquitinome.
a Experimental workflow for rhythmic ubiquitinome analysis. b Proportion of oscillating ubiquitination sites (q-value < 0.1) quantified in >50% of all samples (left panel, green) and proteins with cycling ubiquitin sites (q-value < 0.1) (right panel, violet) c Rose plots indicate phase peaks for cycling ubiquitination sites (left panel, green) and proteins (right panel, violet). d Overrepresentation analysis of gene ontology biological processes (GOBP) filtered for top 10 significant terms. Significance is determined by 5% false discovery rate (FDR) (Fisher’s Exact test). e Proportions of proteins with a single and multiple cycling ubiquitination sites (left panel) and those displaying cycling diGly site clusters (right panel). f, g Examples of proximity analysis of cycling ubiquitin clusters (http://cyclingubi.biochem.mpg.de). Cycling sites (q-value <0.1, ±SEM, n = 4 biologically independent experiments for each time point) (top) and their location in the protein sequence along with the domain annotation (middle) and proximity score (average distance, p-value < 0.1) (bottom) for f SLC7A11 (p-value = 0.0161) and g MAGED1 (p-value = 0.0863). Source data are provided as a Source data file.

References

    1. Swatek KN, Komander D. Ubiquitin modifications. Cell Res. 2016;26:399–422. doi: 10.1038/cr.2016.39. - DOI - PMC - PubMed
    1. Yau R, Rape M. The increasing complexity of the ubiquitin code. Nat. Cell Biol. 2016;18:579–586. doi: 10.1038/ncb3358. - DOI - PubMed
    1. Karbowski M, Youle RJ. Regulating mitochondrial outer membrane proteins by ubiquitination and proteasomal degradation. Curr. Opin. Cell Biol. 2011;23:476–482. doi: 10.1016/j.ceb.2011.05.007. - DOI - PMC - PubMed
    1. Spratt DE, et al. A molecular explanation for the recessive nature of parkin-linked Parkinson’s disease. Nat. Commun. 2013;4:1983. doi: 10.1038/ncomms2983. - DOI - PMC - PubMed
    1. Seymour RE, et al. Spontaneous mutations in the mouse Sharpin gene result in multiorgan inflammation, immune system dysregulation and dermatitis. Genes Immun. 2007;8:416–421. doi: 10.1038/sj.gene.6364403. - DOI - PubMed

Publication types

LinkOut - more resources