. 2021 Jan 11;11(1):327.
doi: 10.1038/s41598-020-79373-0.

Spatiotemporal variation in cell proliferation patterns during arthropod axial elongation

Affiliations

Spatiotemporal variation in cell proliferation patterns during arthropod axial elongation

Rodrigo E Cepeda et al. Sci Rep. .

Abstract

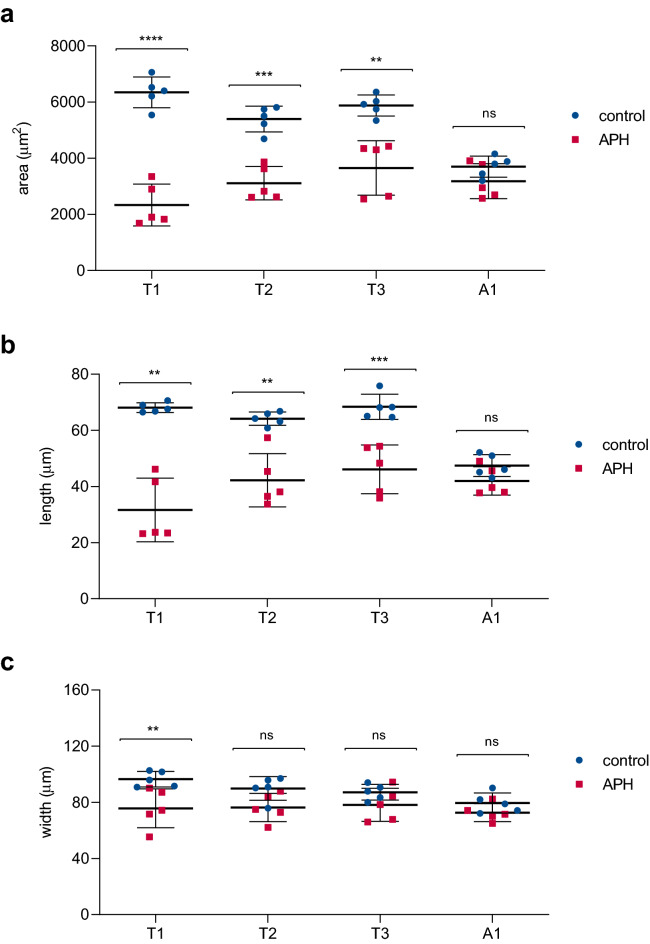
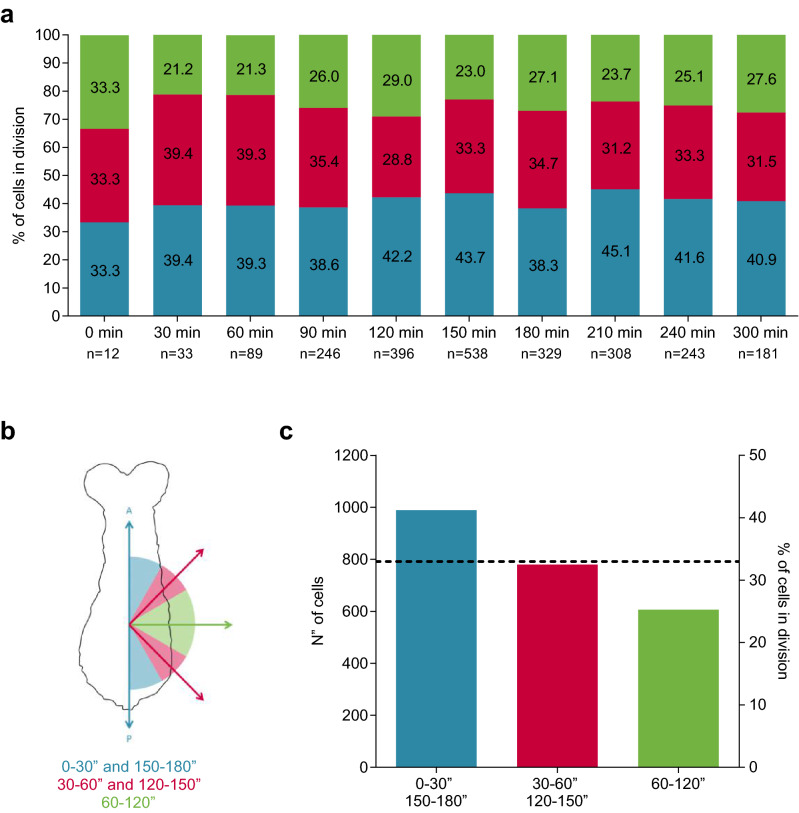
An elongated and segmented body plan is a common morphological characteristic of all arthropods and is probably responsible for their high adaptation ability to diverse environments. Most arthropods form their bodies by progressively adding segments, resembling vertebrate somitogenesis. This sequential segmentation relies on a molecular clock that operates in the posterior region of the elongating embryo that combines dynamically with cellular behaviors and tissue rearrangements, allowing the extension of the developing body along its main embryonic axis. Even though the molecular mechanisms involved in elongation and segment formation have been found to be conserved in a considerable degree, cellular processes such as cell division are quite variable between different arthropods. In this study, we show that cell proliferation in the beetle Tribolium castaneum has a nonuniform spatiotemporal patterning during axial elongation. We found that dividing cells are preferentially oriented along the anterior-posterior axis, more abundant and posteriorly localized during thoracic segments formation and that this cell proliferation peak was triggered at the onset of axis elongation. This raise in cell divisions, in turn, was correlated with an increase in the elongation rate, but not with changes in cell density. When DNA synthesis was inhibited over this period, both the area and length of thoracic segments were significantly reduced but not of the first abdominal segment. We discuss the variable participation that different cell division patterns and cell movements may have on arthropod posterior growth and their evolutionary contribution.


Conflict of interest statement

The authors declare no competing interests.

Figures

Figure 1
Figure 1
Nonuniform spatiotemporal patterning of cell division during elongation. (a) Three temporal phases of different levels of proliferation were found after PH3+ cells quantification (normalized by area × 103) every 30 min from 0 to 300 mph (n = 10 at each stage; 270 mph was not counted). Minimum levels (turquoise) precede a peak of dividing cells (blue) that is followed by intermediate amounts of PH3+ cells (green). (b) Representative pictures of PH3 stained embryos at each stage analyzed, ordered from 0 to 300 mph (red fluorescent images were converted to black and white and color-inverted to improve visualization). (c) The spatial patterning of cell proliferation at each stage was obtained after PH3+ cells quantification at three consecutive regions along the elongating embryo (R1–R2–R3 from posterior to anterior; see the schematic diagram). All embryos showed are dorsally oriented. Anterior is to the top. Error bars indicate standard deviation (SD) of the mean (n = 10). Different letters in (a) represent groups with statistically significant differences according to a Brown-Forsythe and Welch ANOVA test (p < 0.05). Statistical analysis in (c) was performed between each region at every stage. Asterisks indicate statistically significant differences according to a two-way ANOVA with post hoc Tukey's multiple comparisons test; *p < 0.05, **p < 0.01 and ***p < 0.001. Corresponding p-values are showed in Supplementary Table S2.
Figure 2
Figure 2
Cell proliferation peak is triggered at the beginning of axial elongation. (a) Experimental schematic for time window Aphidicolin treatments. Aphidicolin incubation windows and washouts are highlighted in orange and blue, respectively. All treatments lasted 2 h and were followed by embryo fixation and anti-PH3 antibody staining. (b) Number of PH3+ cells (normalized by area × 103) measured at 120 mph after each treatment. Error bars indicate SD of the mean (n = 11–12). Different letters represent groups with statistically significant differences according to a Kruskal–Wallis test and Dunn’s multiple comparisons test (p < 0.05). Corresponding p-values are showed in Supplementary Table S2.
Figure 3
Figure 3
Cell proliferation peak correlates with an increasing in the elongation rate. (a) Germband’s length throughout elongation measured every 30 min from 0 to 300 mph (n = 10 at each stage; 270 mph was not counted) after linear regression showed an average rate of elongation of 1.198 ± 0.059 µm/min. The slope represents the rate of elongation at each period. (b) Linear regression applied to separated periods of elongation showed 2 different slopes. The period between 120–180 mph showed to be statistically different to 0–90 mph (p = 0.0001) and 210–300 mph (p = 0.0029). All data were fitted with a linear regression. Error bars indicate SEM (n = 10).
Figure 4
Figure 4
Cell proliferation peak is necessary for proper thoracic segments formation. Comparison of different parameters, area (a), length (b) and width (c), from the three thoracic (T1, T2 and T3) and the first abdominal (A1) segments between APH treated germbands (red squares) and controls (blue dots). Dissected germbands were exposed to the APH treatment or DMSO (controls) during 1-h followed by washout, another 4 h of incubation and finally fixation to subsequent Tc-engrailed in situ hybridization and analysis. Error bars represent SD of the mean (n = 5). Asterisks indicate statistically significant difference according to unpaired test t (a,b) and one-way ANOVA (c); *p < 0.05; **p < 0.01; ***p < 0.001 and ****p < 0.0001. Corresponding p-values are showed in Supplementary Table S2.
Figure 5
Figure 5
Cell division orientation has an anterior–posterior contribution to germband extension. (a) Percentage distribution of mitotic angles relative to the anterior–posterior axis (elongation axis) by stage and total distribution. Number of cells analyzed (n) is also shown. (b) Schematic diagram of a Tribolium germband showing the angle selection criteria and the color code. Blue: Mitotic angles between 0°–30° and 150°–180°; Red: 30°–60° and 120°–150°; Green: 60°–120°. (c) Total distribution analysis of cell division angles. The broken line represents the expected percentage if random cell divisions are present during elongation (~ 33%). The bars represent the amount of dividing cells that showed the corresponding angle range. Each group was analyzed by the Chi-square test of homogeneity, showing that the orientations were not distributed equally (p < 2.2 × 10–16).

References

    1. Nüsslein-Volhard C, Wieschaus E. Mutations affecting segment number and polarity in Drosophila. Nature. 1980;287:795–801. doi: 10.1038/287795a0. - DOI - PubMed
    1. Peel AD, Chipman AD, Akam M. Arthropod segmentation: Beyond the Drosophila paradigm. Nat. Rev. Genet. 2005;6:905–916. doi: 10.1038/nrg1724. - DOI - PubMed
    1. Davis GK, Patel NH. Short, long, and beyond: Molecular and embryological approaches to insect segmentation. Annu. Rev. Entomol. 2002;47:669–699. doi: 10.1146/annurev.ento.47.091201.145251. - DOI - PubMed
    1. Liu PZ, Kaufman TC. Short and long germ segmentation: Unanswered questions in the evolution of a developmental mode. Evol. Dev. 2005;7:629–646. doi: 10.1111/j.1525-142X.2005.05066.x. - DOI - PubMed
    1. Foe VE. Mitotic domains reveal early commitment of cells in Drosophila embryos. Development. 1989;107:1–22. - PubMed

Publication types

LinkOut - more resources