. 2021 Jan 11;11(1):326.
doi: 10.1038/s41598-020-79432-6.

Oxylipins are implicated as communication signals in tomato-root-knot nematode (Meloidogyne javanica) interaction

Affiliations

Oxylipins are implicated as communication signals in tomato-root-knot nematode (Meloidogyne javanica) interaction

Nathalia Fitoussi et al. Sci Rep. .

Abstract

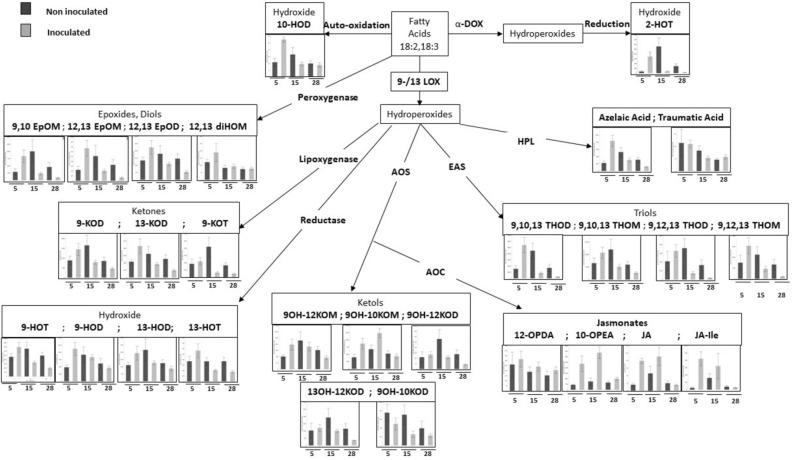
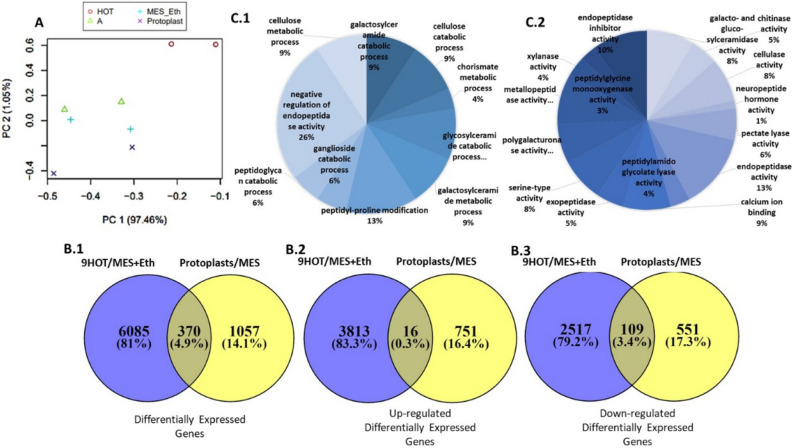
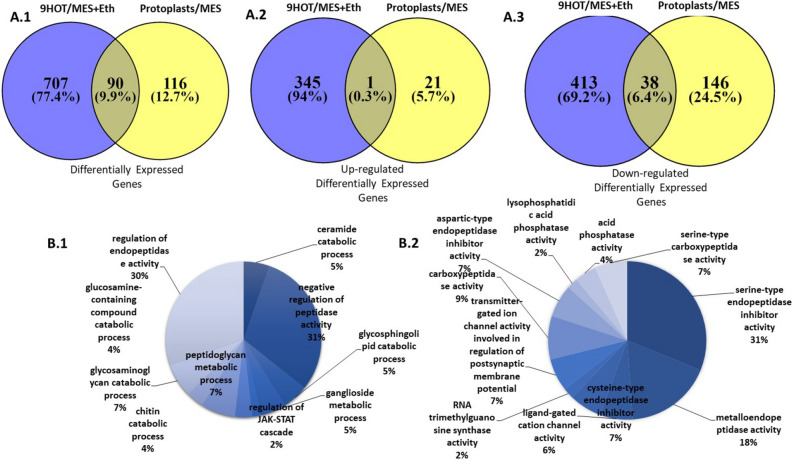
Throughout infection, plant-parasitic nematodes activate a complex host defense response that will regulate their development and aggressiveness. Oxylipins-lipophilic signaling molecules-are part of this complex, performing a fundamental role in regulating plant development and immunity. At the same time, the sedentary root-knot nematode Meloidogyne spp. secretes numerous effectors that play key roles during invasion and migration, supporting construction and maintenance of nematodes' feeding sites. Herein, comprehensive oxylipin profiling of tomato roots, performed using LC-MS/MS, indicated strong and early responses of many oxylipins following root-knot nematode infection. To identify genes that might respond to the lipidomic defense pathway mediated through oxylipins, RNA-Seq was performed by exposing Meloidogyne javanica second-stage juveniles to tomato protoplasts and the oxylipin 9-HOT, one of the early-induced oxylipins in tomato roots upon nematode infection. A total of 7512 differentially expressed genes were identified. To target putative effectors, we sought differentially expressed genes carrying a predicted secretion signal peptide. Among these, several were homologous with known effectors in other nematode species; other unknown, potentially secreted proteins may have a role as root-knot nematode effectors that are induced by plant lipid signals. These include effectors associated with distortion of the plant immune response or manipulating signal transduction mediated by lipid signals. Other effectors are implicated in cell wall degradation or ROS detoxification at the plant-nematode interface. Being an integral part of the plant's defense response, oxylipins might be placed as important signaling molecules underlying nematode parasitism.


Conflict of interest statement

The authors declare no competing interests.

Figures

Figure 1
Figure 1
Integrated analysis of the oxylipin profile of tomato roots that were not inoculated (dark gray) or inoculated with M. javanica juveniles (light gray) and collected at different time points (5, 15 and 28 DAI). Abbreviations of oxylipins used in this scheme: 18:2, linoleic acid; 18:3, linolenic acid; 2-HOT, 2(R)-hydroxy-9(Z),12(Z),15(Z)-octadecatrienoic acid; 9,10,13-THOD, 9(S),12(S),13(S)-trihydroxy-10(E),15(Z)-octadecadienoic acid; 9,10,13-THOM, 9(S),12(S),13(S)-trihydroxy-10(E),15(Z)-octadecatrienoic acid; 9,12,13-THOD, 9(S),12(S),13(S)-trihydroxy-10(E)-octadecenoic acid; 9,12,13-THOM, 9(S),12(S),13(S)-trihydroxy-10(E),15(Z)-octadecadienoic acid; 12-OPDA, 12-oxo-10,15(Z)-phytodienoic acid; 10-OPEA, 10-oxo-11-phytoenoic acid; JA, jasmonic acid; JA-Ile, jasmonic acid-isoleucine; 9OH-12KOM, 9-hydroxy-12-oxo-octadecaenoic acid; 9OH-10KOM, 9-hydroxy-10-oxo-octadecaenoic acid; 9OH-12KOD, 9-hydroxy-12-oxo-octadecadienoic acid; 13OH-12KOD, 13-hydroxy12-oxo-octadecadienoic acid; 9OH-10KOD, 9-hydroxy-10-oxo-octadecadienoic acid; 9-HOT, 9(S)-hydroxy-10(E),12(Z),15(Z)-octadecatrienoic acid; 9-HOD, 9(S)-hydroxy-10(E),12(Z)-octadecadienoic acid; 13-HOD, 13(S)-hydroxy-9(Z),11(E)-octadecadienoic acid; 13-HOT, 13(S)-hydroxy-9(Z),11(E),15(Z)-octadecatrienoic acid; 9-KOD, 9-keto-10(E),12(Z)-octadecadienoic acid; 13-KOD, 13-keto-9(Z),11(E),15(Z)-octadecatrienoic acid; 9-KOT, 9-keto-10(E),12(Z),15(Z)-octadecatrienoic acid; 9,10 EpOM, 9(R),10(S)-epoxy-12(Z)-octadecenoic acid; 12,13 EpOM, 12(R),13(S)-epoxy-9(Z)-octadecenoic acid; 12,13 EpOD, 11(S),12(S)-epoxy-13(S)-hydroxy-9(Z),15(Z)-octadecadienoate; 12,13 diHOM, (±)-threo-12,13-dihydroxy-9(Z)-octadecenoic acid; 10 HOD, (8E,12Z)-10-hydroxy-8,12 octadecadienoic acid.
Figure 2
Figure 2
Microscopic analysis of GUS expression patterns in root-knot nematode-inoculated tomato roots harboring LOX1.2, AOS1, OPR2 and, α-DOX1 promoter: GUS fusion constructs. (A1–E1) Micrographs of LOX1.2–GUS reporter line. (A1) Noninoculated root harboring the LOX1.2:GUS fusion construct exhibits no GUS signal related to root tip or elongation zone. (B1) Roots 2 days after inoculation (DAI). (C1) Inoculated roots 5 DAI. (D1) Developing galls 15 DAI. (E1) Mature galls 28 DAI. (A2–E2) Micrographs of AOS1–GUS reporter line. (A2) Noninoculated root harboring the AOS1:GUS fusion construct exhibits no GUS signal related to root tip or elongation zone. (B2) Roots 2 DAI. (C2) Inoculated roots 5 DAI. (D2) Developing galls 15 DAI. (E2) Mature galls 28 DAI. (A3–E3) Micrographs of OPR2–GUS reporter line. (A3) Noninoculated root harboring the OPR2:GUS fusion construct exhibits no GUS signal related to root tip or elongation zone. (B3) Roots 2 DAI. (C3) Inoculated roots 5 DAI. (D3) Developing galls 15 DAI. (E3) Mature galls 28 DAI. A5–E5, Micrographs of αDOX1–GUS reporter line. (A4) Noninoculated root harboring the αDOX1:GUS fusion construct exhibits no GUS signal related to root growth. (B4) Roots 2 DAI. (C4) Inoculated roots 5 DAI. (D4) Developing galls 15 DAI. (E4) Mature galls 28 DAI. (A5–E5) Micrographs of pCAMBIA2300–GUS reporter line; empty pCAMBIA2300 vector fused to GUS reporter served as a control. (A5) Noninoculated root harboring the pCAMBIA2300:GUS fusion construct exhibits no GUS signal related to root tip or elongation zone. (B5) Roots 2 DAI. C5 Inoculated roots 5 DAI. (D5) Developing galls 15 DAI. (E5) Mature galls 28 DAI. Arrows indicate GUS staining (C1, D2, E2, E3, D4 and E4): Micrographs viewed under a light microscope. Bright-field image of roots and galls photographed through a stereomicroscope. Bars: A1–A5, B1, B4, B5, C1, C4–C5, D3–D5 = 50 μm; B2–B3, C2–C3, D1–D2, E1–E5 = 500 μm.
Figure 3
Figure 3
(A) Principal components analysis (PCA). Distribution of differentially expressed genes. Three-dimensional representation according to PCA of the differentially expressed genes among the four treatments used in the RNA-Seq analysis: J2 of M. javanica exposed to protoplasts, 9-HOT, or MES + ethanol (MES + Eth), or freshly hatched J2. Samples with similar expression profiles lie closer to each other than those with dissimilar profiles. Axes 1 and 2 show robust class separation into two major groups: (1) 9-HOT, (2) J2 and MES + ethanol and protoplasts. (B) Venn diagram showing number of overlapping and non-overlapping differentially expressed M. javanica genes following exposure to: protoplasts/control (Cont.) and 9-HOT/control. (B.1) distribution of all differentially expressed genes. (B.2) Distribution of up-regulated genes found in each treatment as well as genes overlapping between both treatments. (B.3) Distribution of down-regulated genes found in each treatment as well as genes overlapping between both treatments. Fold change with an absolute value > 2 and < − 2 and p value ≤ 0.001 was used for the analyses. (C) Gene ontology (GO) annotations of differentially expressed genes of M. javanica J2 exposed to 9-HOT vs. control unigenes at multilevel using BLAST2go software. The GO terms were categorized into (C.1) biological process and (C.2) molecular function. Pie chart slices represent the percentages of genes identified in a particular category among the differentially expressed genes.
Figure 4
Figure 4
(A) Venn diagram depicting the distribution of DEG including Signal Peptide according to SignalP5.0. (A.1) Venn diagram showing the number of overlapping and nonoverlapping total differentially expressed genes of M. javanica transcripts following exposure to: protoplasts/control (Cont.) and 9-HOT/control. (A.2) Distribution of up-regulated genes found in each treatment as well as genes overlapping between both treatments. (A.3) Distribution of down-regulated genes found in each treatment as well as genes overlapping between both treatments. Fold change with an absolute value > 2 and < − 2 and p value ≤ 0.001 was used for the analyses. (B) Gene ontology (GO) annotations of differentially expressed genes including Signal Peptide according to SignalP5.0, of M. javanica J2 exposed to 9-HOT vs. control unigenes at multilevel using BLAST2go software. The GO terms were categorized into (B.1) biological process and (B.2) molecular function. Pie chart slices represent the percentages of unigenes identified in a particular category among the differentially expressed genes encoding effectors.
Figure 5
Figure 5
FISH of dissected freshly hatched M. javanica J2. M. javanica J2 were stained with DAPI (blue) together with (A) Triacylglycerol lipase Cy5-specific probe (red). (A1–4) M. javanica J2 exposed to 9-HOT. Esophageal gland area: D, dorsal gland; SV, subventral glands (combined Z sections). (A5–8) M. javanica exposed to 0.01 M MES buffer + ethanol; EG, esophageal gland region. 1 and 5 DAPI-stained nuclei (blue) of the dissected nematode as seen from combined sections under fluorescence. 2 and 6 FISH signal of triacylglycerol lipase Cy5-specific probe (red) as seen from combined sections under fluorescence. 3 and 7 Combined DAPI-stained nuclei (blue) and FISH signal (red) under bright field. 4 and 8 M. javanica as seen from combined sections under bright field and fluorescence. (B) MLT-10 like Cy5-specific probe (red). (B1–4) M. javanica J2 exposed to 9-HOT. SV, subventral glands (combined Z sections). (B5–8) M. javanica exposed to 0.01 M MES buffer + ethanol; EG, esophageal gland region. 1 and 5 DAPI-stained nuclei (blue) of the dissected nematode as seen from combined sections under fluorescence. 2 and 6 FISH signal of MLT-10 Cy5-specific probe (red) as seen from combined sections under fluorescence. 3 and 7 Combined DAPI-stained nuclei (blue) and FISH signal (red) under bright field. 4 and 8 M. javanica as seen from combined sections under bright field and fluorescence.

References

    1. Bird DM. Signaling between nematodes and plants. Curr. Opin. Plant Biol. 2004;7:372–376. doi: 10.1016/j.pbi.2004.05.005. - DOI - PubMed
    1. Trudgill DL, Blok VC. Apomitic, polyphagous root knot nematodes: exceptionally successful and damaging biotrophic root pathogens. Annu. Rev. Phytopathol. 2001;39:53–77. doi: 10.1146/annurev.phyto.39.1.53. - DOI - PubMed
    1. Blok VC, Jones JT, Phillips MS, Trudgill DL. Parasitism genes and host range disparities in biotrophic nematodes: the conundrum of polyphagy versus specialisation. BioEssays. 2008;30:249–259. doi: 10.1002/bies.20717. - DOI - PubMed
    1. Nicol JM, et al. Genomics and Molecular Genetics of Plant–Nematode Interactions. Dordrecht: Springer; 2011. Current nematode threats to world agriculture; pp. 21–43.
    1. Singh S, Singh B, Singh AP. Nematodes: a threat to sustainability of agriculture. Procedia Environ. Sci. 2015;29:215–216. doi: 10.1016/j.proenv.2015.07.270. - DOI

Publication types

LinkOut - more resources