. 2021 Jan 11;11(1):352.
doi: 10.1038/s41598-020-79911-w.

Vision is protected against blue defocus

Affiliations

Vision is protected against blue defocus

Clara Benedi-Garcia et al. Sci Rep. .

Abstract

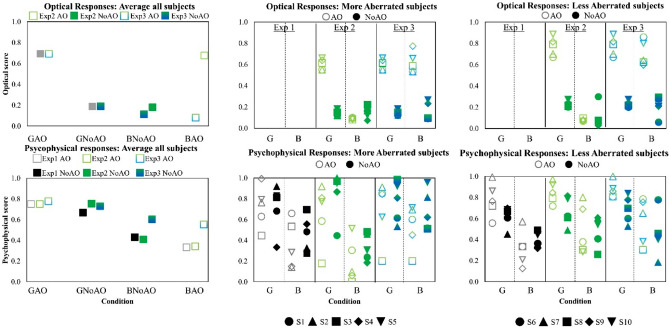
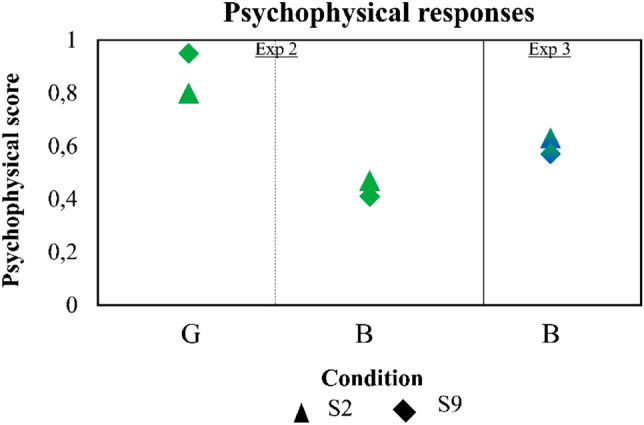
Due to chromatic aberration, blue images are defocused when the eye is focused to the middle of the visible spectrum, yet we normally are not aware of chromatic blur. The eye suffers from monochromatic aberrations which degrade the optical quality of all images projected on the retina. The combination of monochromatic and chromatic aberrations is not additive and these aberrations may interact to improve image quality. Using Adaptive Optics, we investigated the optical and visual effects of correcting monochromatic aberrations when viewing polychromatic grayscale, green, and blue images. Correcting the eye's monochromatic aberrations improved optical quality of the focused green images and degraded the optical quality of defocused blue images, particularly in eyes with higher amounts of monochromatic aberrations. Perceptual judgments of image quality tracked the optical findings, but the perceptual impact of the monochromatic aberrations correction was smaller than the optical predictions. The visual system appears to be adapted to the blur produced by the native monochromatic aberrations, and possibly to defocus in blue.


Conflict of interest statement

The authors declare no competing interests.

Figures

Figure 1
Figure 1
Methods overview. Example of Optical predictions (left) and Psychophysical scores (right) for one subject (S#5) from experimental measurements in the Adaptive Optics system (with natural and AO-corrected aberrations, depicted in (a)). The optical modulation transfer functions (MTFs) were obtained from the measured wave aberrations at best focus for Green (NoAO, dotted line and AO, solid line) and for a defocus corresponding to the chromatic difference of focus for Blue (b). Optical quality predictions are estimated computing the normalized area under the MTF (0–40 c/deg range) (c,d). The patients then scores the perceived quality of natural images (city scene, fruit platter and binary noise) of gray-scale images (in focus, and defocus by − 0.87 D), green images (in focus, and defocus by − 0.87 D), and green and blue images (in the best focus of green), both with natural aberrations (NoAO) and aberration correction (AO), illustrated in (e). Psychophysical scores are obtained from the perceptual judgment of natural images (0–5) as seen through the Adaptive Optics system in 4 conditions (G_AO, G_NoAO, B_NoAO) and normalized to 1 (f). Note that G_AO and G_NoAO means best focus of gray-scale images in Exp 1 and best focus for green in Experiment 2 and 3, for AO and NoAO conditions, respectively, and B_AO and B_NoAO means − 0.87 D from the best focus of gray-scale images and green images, for Experiment 1 and 2, respectively, and best focus of green (with blue stimuli) in Experiment 3.
Figure 2
Figure 2
MTFs in all eyes, computed from the individually measured monochromatic aberrations. With natural aberrations (NoAO, dashed lines) and AO-corrected monochromatic aberrations (solid lines). MTFs are for best focus in green (G. 550 nm) and for the corresponding chromatic difference of focus (− 0.87 D, 450 nm) in blue. The maps above each graph represent monochromatic wave aberrations with no defocus and natural aberrations (left) and with AO-corrected aberration (right). Subjects are ordered according to increasing Visual Strehl (VS) value for 5-mm pupil diameters for the G_NoAO condition. Root Mean Square (RMS), Spherical Aberration (SA), and Coma values for NoAO correction (for the natural aberration condition) are shown in each panel under the subject’s label, unitless and μm units, respectively).
Figure 3
Figure 3
Results summary. Optical image quality (top panels) and Psychophysical scores (bottom panels). Left panels represent average data across all subjects. Middle panels represent data of individuals with more aberrations (S#1–S#5; VS < 0.2), and right panels data of individual less aberrations (S#6–S#10; VS > 0.2). Open bars represent results under corrected monochromatic aberrations (AO) and filled bars under natural aberrations (NoAO). Gray bars represent results for grayscale images (Exp 1), Green bars for green images (Exp 2) and graded green–blue bars for green and blue images (Exp 3). In the middle and right panels, open symbols stand for results under corrected monochromatic aberrations (AO) and closed symbols for results under natural aberrations (NoAO). Black symbols correspond to Exp 1, green symbols to Exp 2 and green and blue symbols to Exp 3.
Figure 4
Figure 4
Results from the control experiment using narrow spectral bandwidth stimuli. Normalized psychophysical score of the perceived quality of natural images (555 nm for G, 480 nm for B, 5-nm spectral bandwidth), for experiments equivalent to Exp 2 and Exp 3. Exp 2 Green stands for green stimuli at best focus, Exp 2_B stands for green stimulus defocused by − 0.87 D with respect to the best focus in G, and Exp 3 Blue stands for blue stimulus at the best focus in G. Data are for two subjects (S2, S9).

References

    1. Thibos LN, Bradley A, Still DL, Zhang X, Howarth PA. Theory and measurement of ocular chromatic aberration. Vision Res. 1990;30:33–49. doi: 10.1016/0042-6989(90)90126-6. - DOI - PubMed
    1. Sawides L, de Gracia P, Dorronsoro C, Webster MA, Marcos S. Vision is adapted to the natural level of blur present in the retinal image. PLoS ONE. 2011;6:1–6. doi: 10.1371/journal.pone.0027031. - DOI - PMC - PubMed
    1. Webster MA. Visual adaptation. Annu. Rev. Vis. Sci. 2015;1:547–567. doi: 10.1146/annurev-vision-082114-035509. - DOI - PMC - PubMed
    1. Sprague WW, Cooper EA, Reissier S, Yellapragada B, Banks MS. The natural statistics of blur. J. Vis. 2016;16:1–27. - PMC - PubMed
    1. Watson AB, Ahumada AJ. Blur clarified: A review and synthesis of blur discrimination. J. Vis. 2011;11:1–23. - PubMed

Publication types