. 2021 Feb;5(2):204-218.
doi: 10.1038/s41559-020-01356-1. Epub 2021 Jan 11.

Seasonal variation in UVA light drives hormonal and behavioural changes in a marine annelid via a ciliary opsin

Affiliations

Seasonal variation in UVA light drives hormonal and behavioural changes in a marine annelid via a ciliary opsin

Vinoth Babu Veedin Rajan et al. Nat Ecol Evol. 2021 Feb.

Abstract

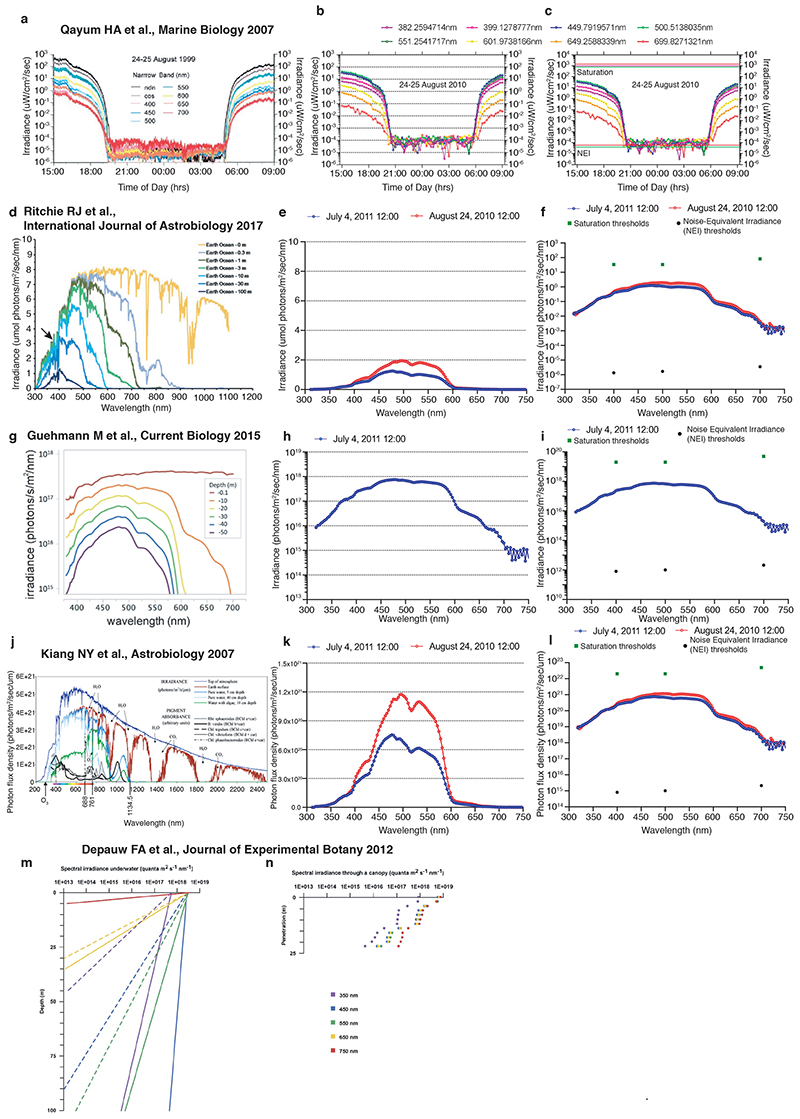
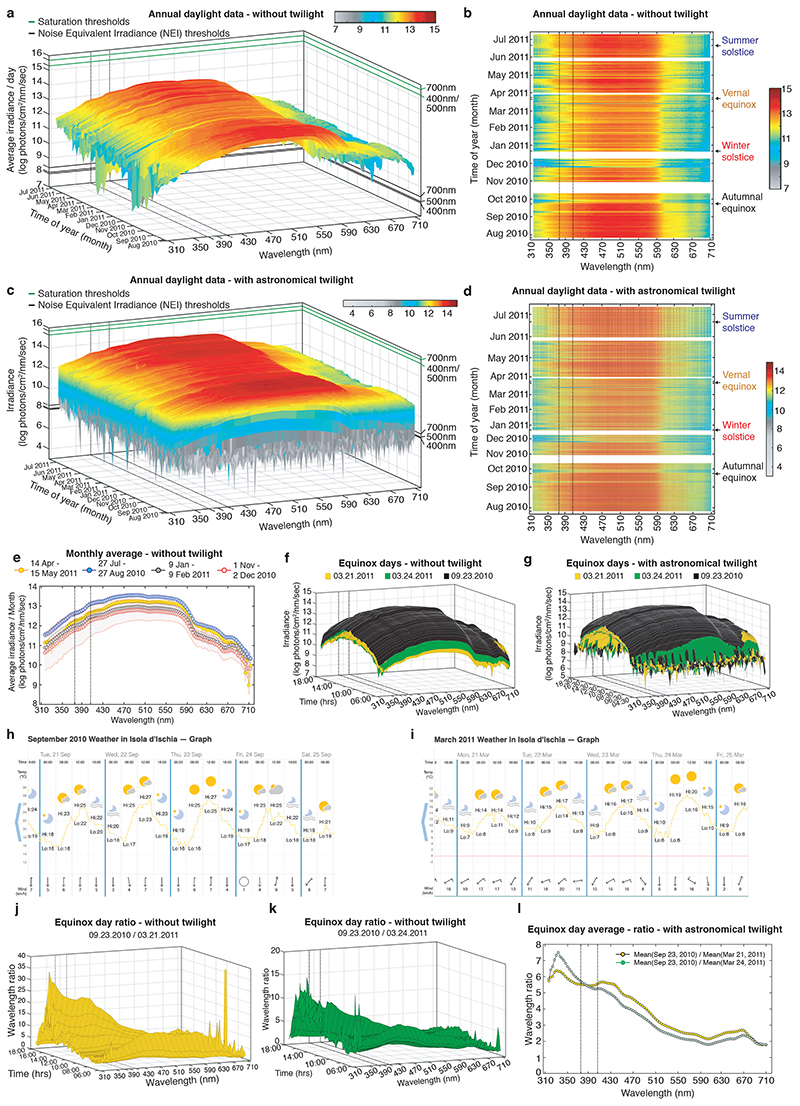
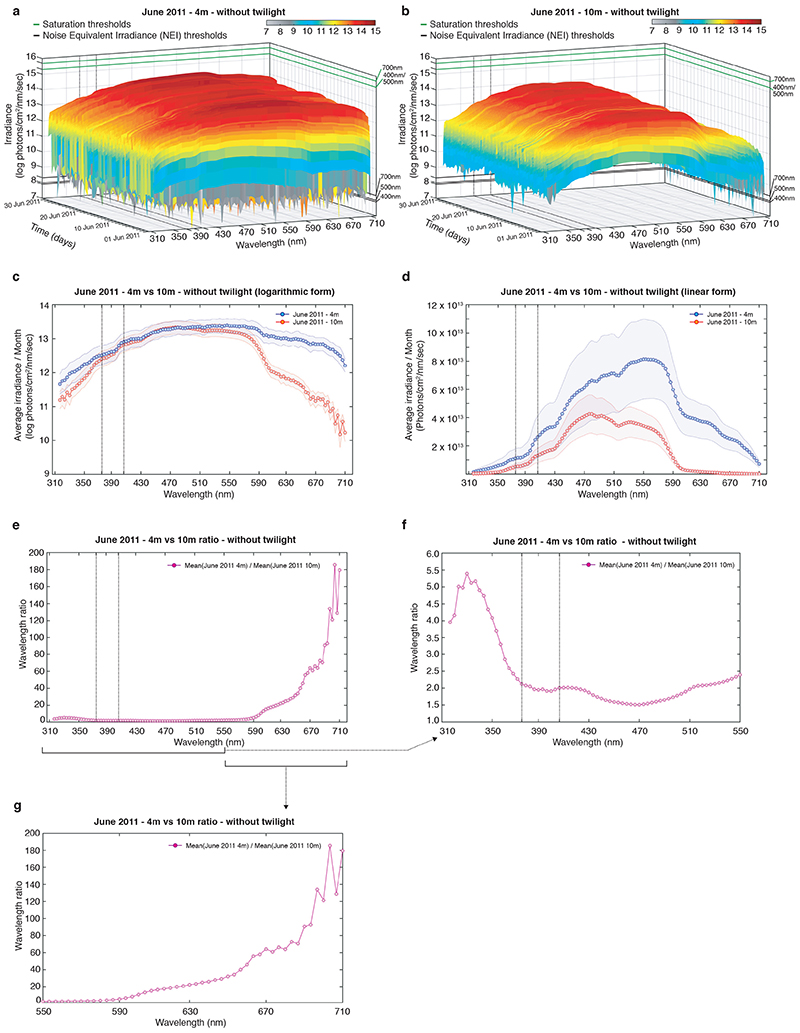
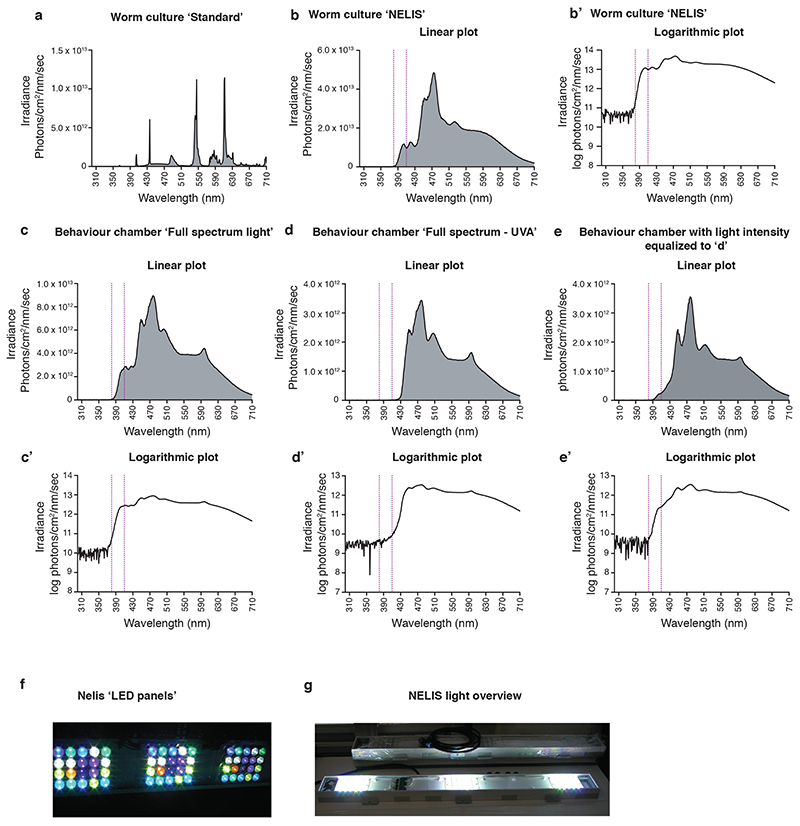
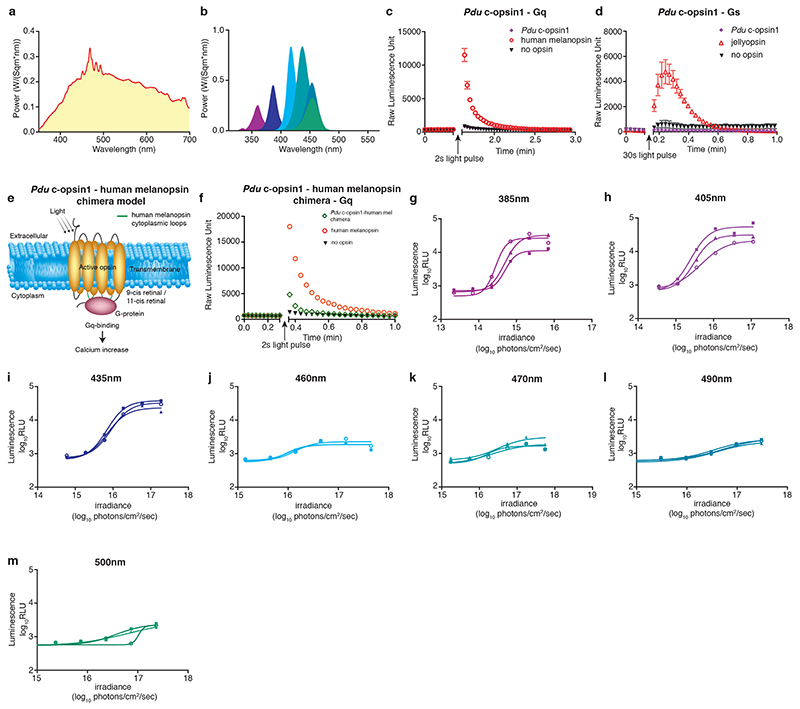
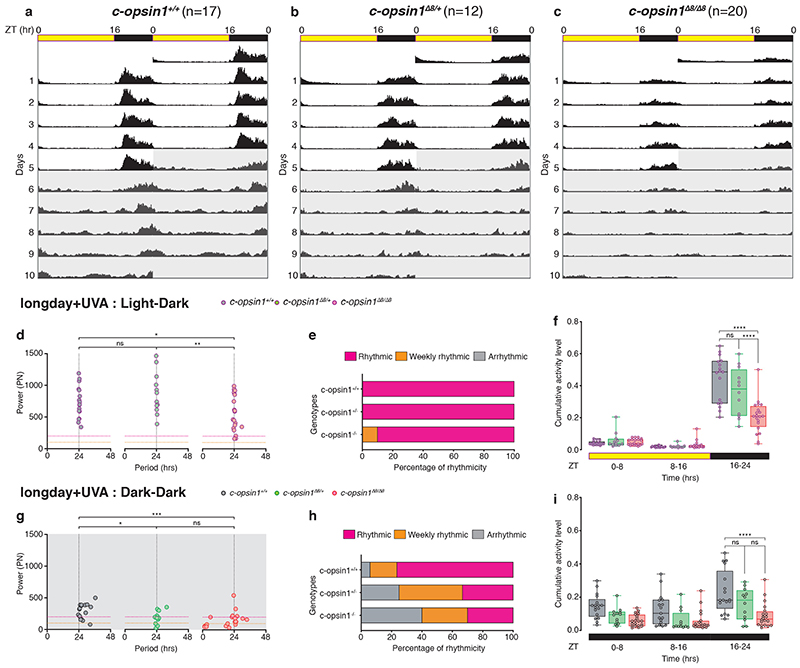
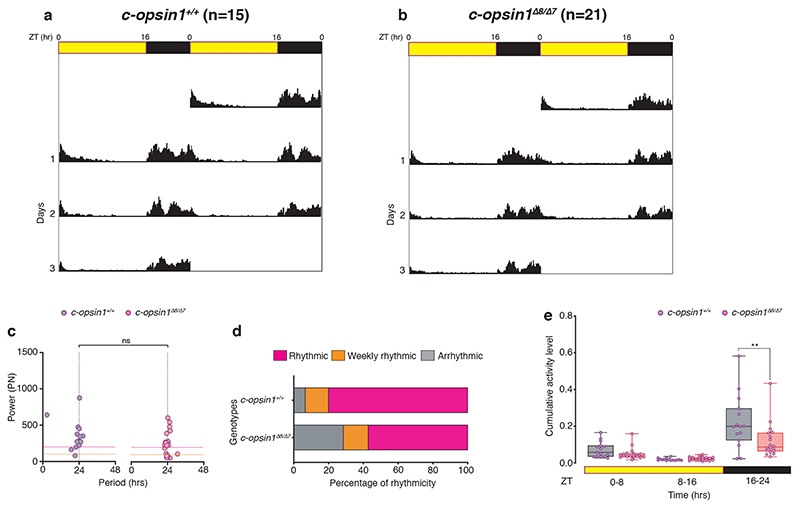
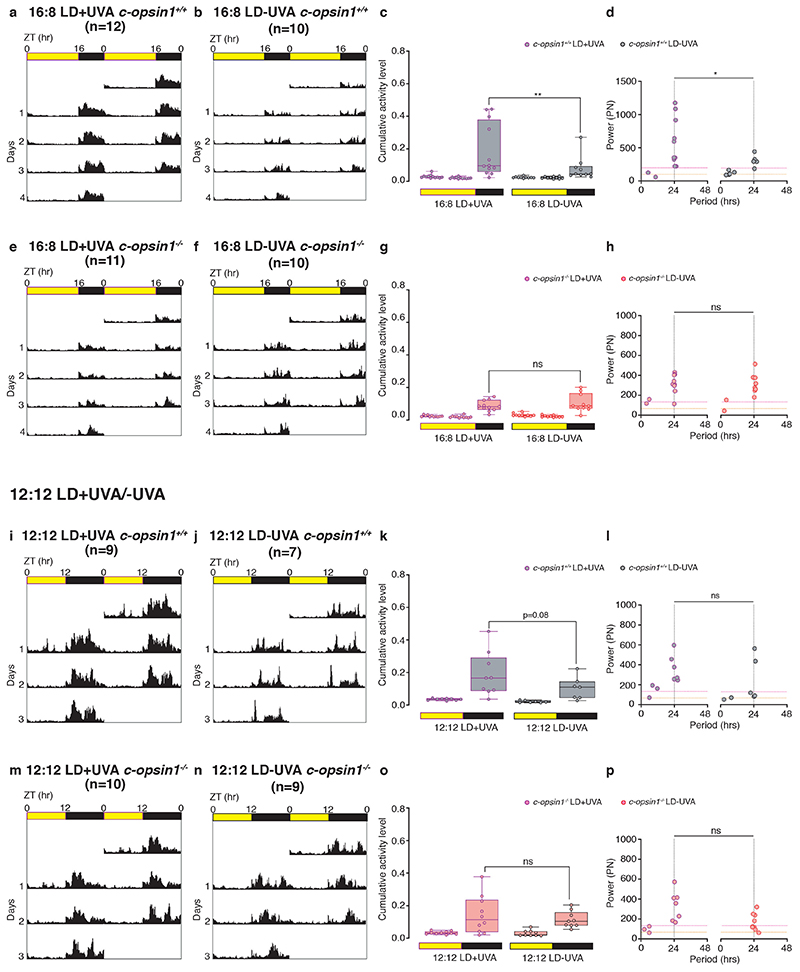
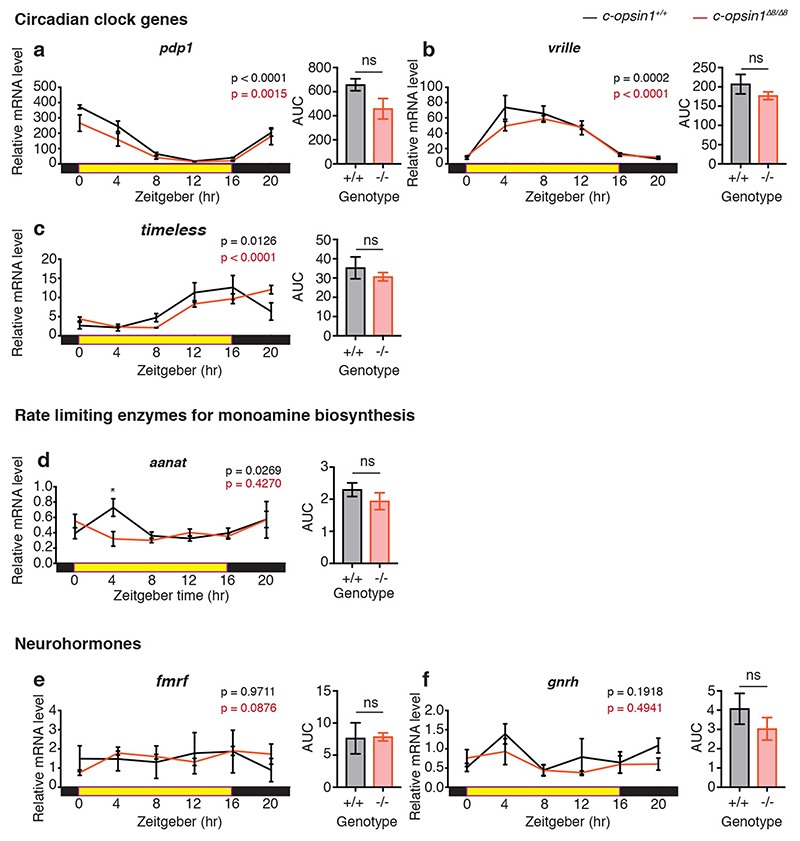
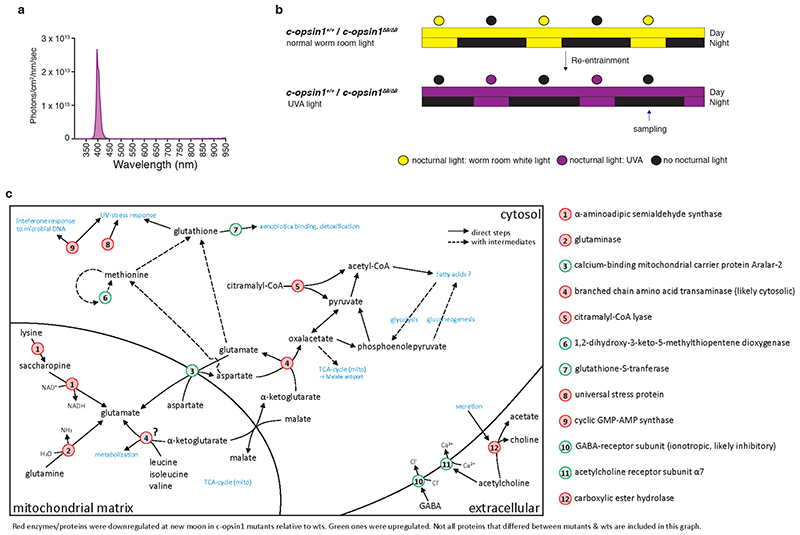
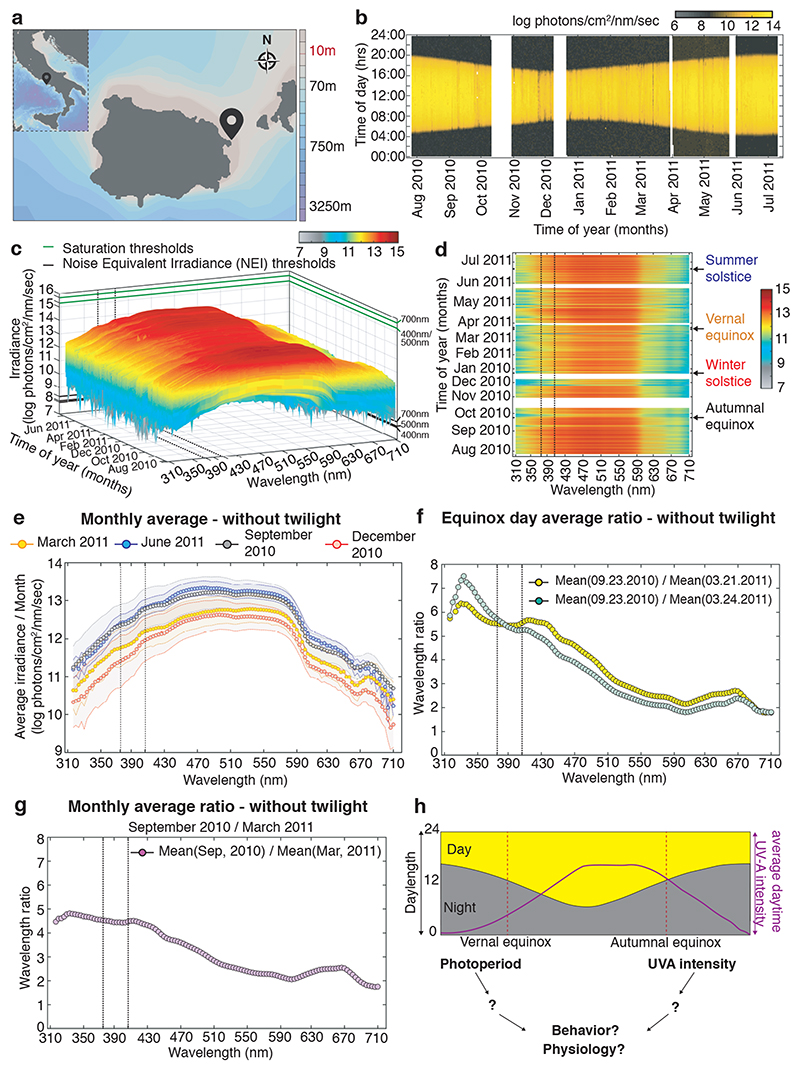
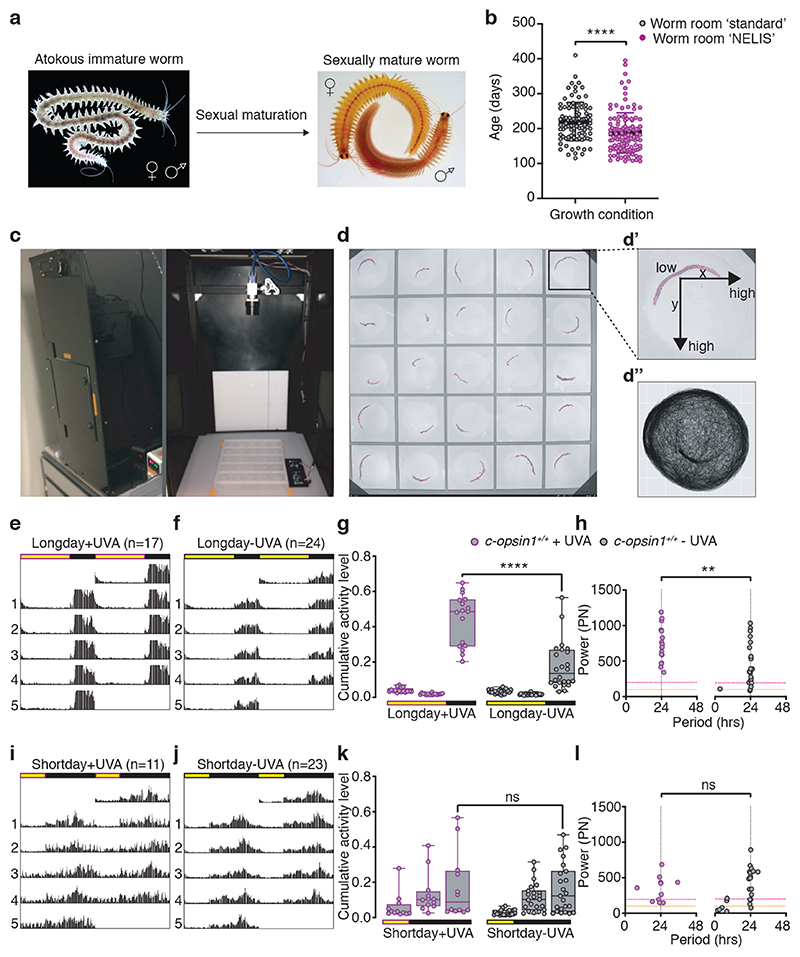
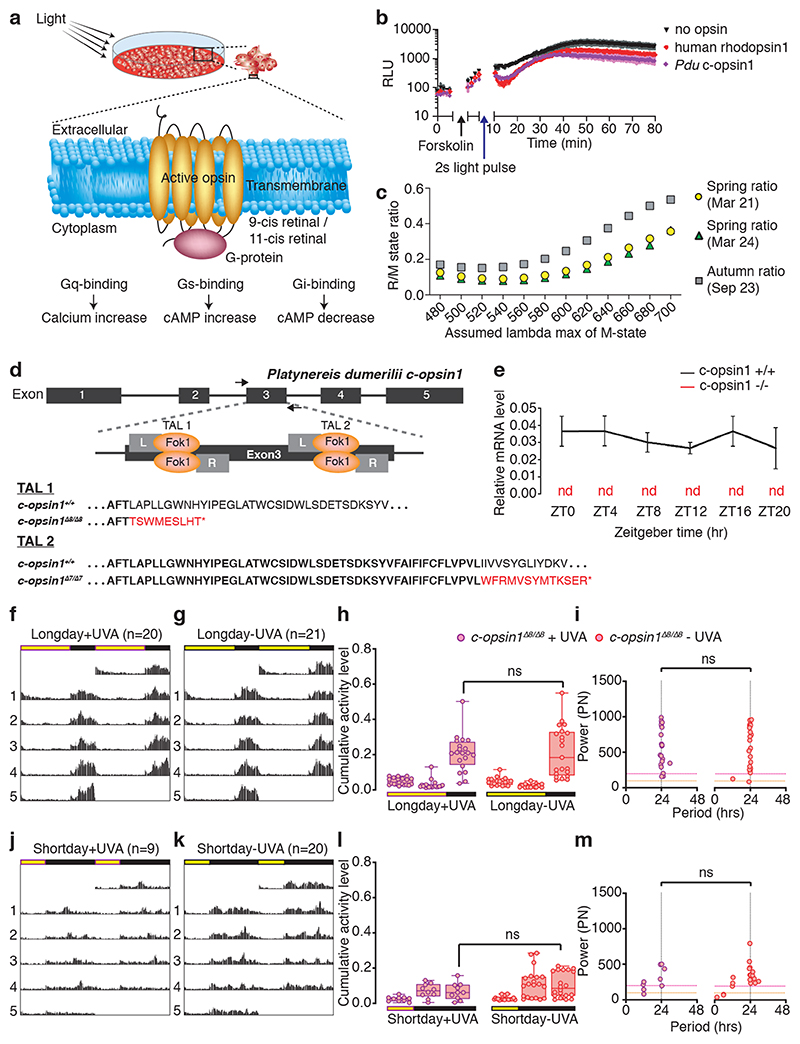
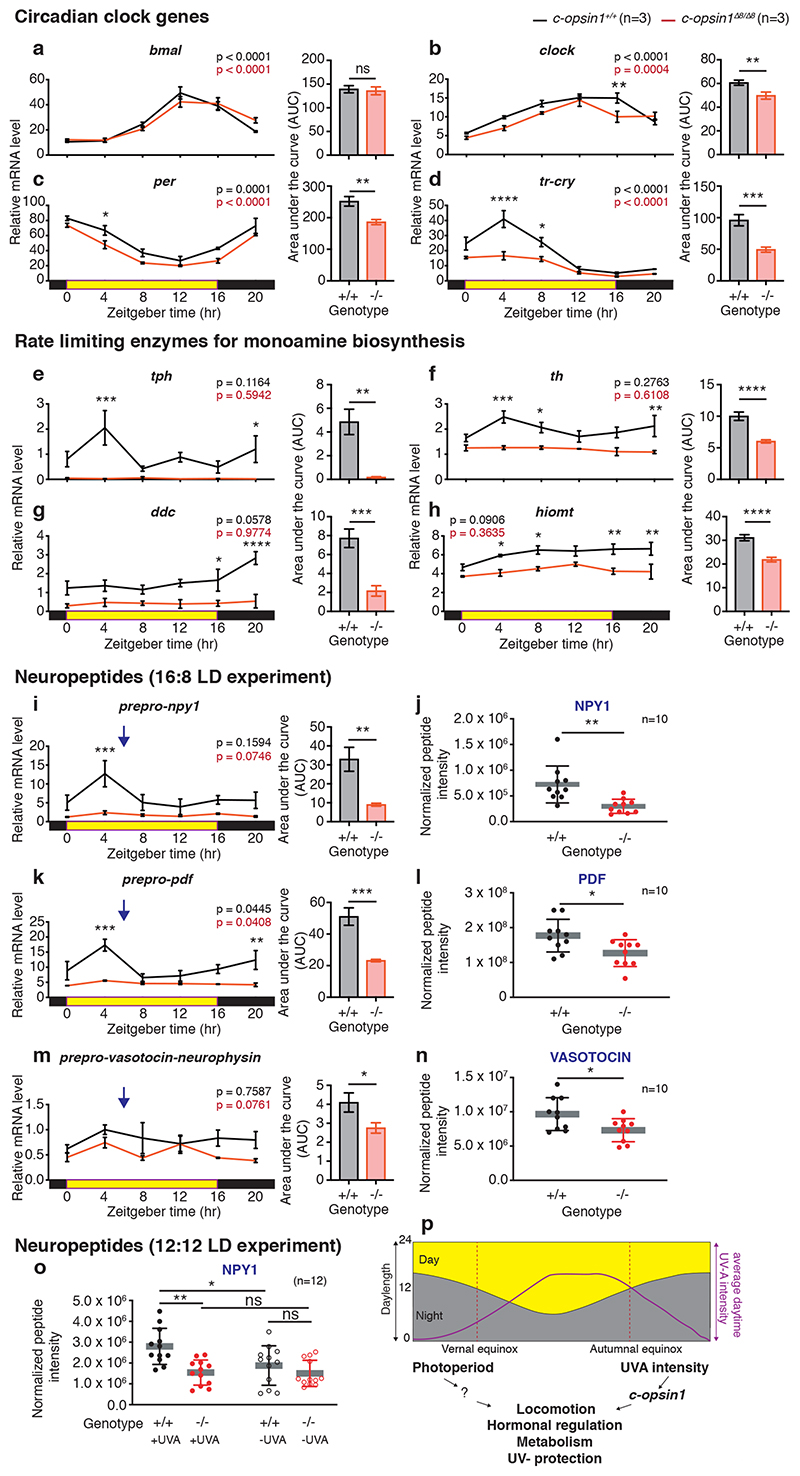
The right timing of animal physiology and behaviour ensures the stability of populations and ecosystems. To predict anthropogenic impacts on these timings, more insight is needed into the interplay between environment and molecular timing mechanisms. This is particularly true in marine environments. Using high-resolution, long-term daylight measurements from a habitat of the marine annelid Platynereis dumerilii, we found that temporal changes in ultraviolet A (UVA)/deep violet intensities, more than longer wavelengths, can provide annual time information, which differs from annual changes in the photoperiod. We developed experimental set-ups that resemble natural daylight illumination conditions, and automated, quantifiable behavioural tracking. Experimental reduction of UVA/deep violet light (approximately 370-430 nm) under a long photoperiod (16 h light and 8 h dark) significantly decreased locomotor activities, comparable to the decrease caused by a short photoperiod (8 h light and 16 h dark). In contrast, altering UVA/deep violet light intensities did not cause differences in locomotor levels under a short photoperiod. This modulation of locomotion by UVA/deep violet light under a long photoperiod requires c-opsin1, a UVA/deep violet sensor employing Gi signalling. C-opsin1 also regulates the levels of rate-limiting enzymes for monogenic amine synthesis and of several neurohormones, including pigment-dispersing factor, vasotocin (vasopressin/oxytocin) and neuropeptide Y. Our analyses indicate a complex inteplay between UVA/deep violet light intensities and photoperiod as indicators of annual time.


Conflict of interest statement

Competing interest statement: Max Hofbauer is the CEO of loopbio GmbH, a company developing commercial animal behavioral tracking solutions. C.M. is the CEO of Marine Breeding Systems GmbH, a company developing commercial illumination systems for aquaculture.

All other authors declare no conflict of interest.

Figures

Extended Data Fig. 1
Extended Data Fig. 1. Benchmarking of daylight intensity measurements at 10m with published measurements and calculations
The units from our data are in each case converted and plotted corresponding to the units and type of plot used in the respective compared publication. (a) Nightlight data measured for individual wavelengths between August 24-25, 1999 . (b,c) Analysis from (a) performed on natural light data measurement for August 24-25 2010. (c): saturation and noise-equivalent irradiance thresholds are indicated 400nm (pink line), 500nm (green line) and 700nm (red line). (d) Calculations of light irradiance at different ocean depths . Black arrow points at UVA spectral range clearly present at 10m water depth and below. (e,f) Our measurements from July 4, 2011 and August 24, 2010 at 12:00 noon for comparison. (g) Irradiance data calculated for different water depths based on in situ measurements of the attenuation coefficients in coastal waters in Corsica using a PhotoreSearch PR-670 spectrophotometer in a custom UW housing on July 4th, 2010, under bright sun at noon . (h,i) Our measurements from July 4, 2011 at 12:00 noon timepoint. (j) Irradiance in atmosphere and in water at different depths . (k,l) Representative daylight measurements from July 4, 2011 and August 24, 2010 at 12:00 noon timepoint from our 10m measurement set for comparsion. (m,n) Average spectral irradiance and individual wavelength penetration under different ocean depths . (f,i,l) Examplary saturation and noise equivalent irradiance (NEI) levels of the RAMSES hyperspectral radiometer indicated as dots.
Extended Data Fig. 2
Extended Data Fig. 2. Daytime spectral irradiance and ratios with and without twilight (10m depth).
(a) Daylight average per day across the year between sunrise to sunset without twilight times for each wavelength. For 3D-rotational graph: Supplementary Data 2. (b) 2-D pcolor plot of (a). (c) Daylight spectrum across the year for each wavelength between astronomical dawn to astronomical dusk (raw data). For 3D-rotational graph: Supplementary Data 3. (d) 2-D pcolor plot of (c). (e) Daytime monthly irradiance averages comparing periods of equal photoperiods. Long day photoperiod example: 14 April – 15 May 2011 (yellow) and 27 July – 27 August 2010 (blue), short day photoperiod example: 9 January – 9 February 2011 (black) and 1 November – 2 December 2010 (red). (f, g) Equinox day spectra without twilight (f) and between astronomical twilight (g). For 3D-plot: Supp.Data 6 and 9. (h,i) Screenshot of weather data for spring and autumnal equinox days: https://www.timeanddate.com/weather. (j, k) 3D-surface plot of equinox day ratio - September 23, 2010/March 21, 2011 (j) and September 23, 2010/March 24, 2011 (k). For 3D-rotational graph: Supplementary Data 7 and 8. (l) Ratios of wavelengths averaged across the day for fall and spring equinox days including twilight times. Black dotted lines: range of strong c-opsin1 activation. Data were corrected for daylight saving time.
Extended Data Fig. 3
Extended Data Fig. 3. Irradiance differences between 4m and 10m water depth.
(a,b) Daylight spectra without twilight of 4m (a) and 10m (b) water depth during June 2011. For 3D-rotational graph: Supplementary data 4 and 5. (c,d) Monthly average 2D plot of (a,b) in logarithmic (c) and in linear scale (d). Blue: 4m, Red: 10m. (e) Wavelength ratios between monthly average of June 2011-4m/June 2011-10m. (f,g) Zoom-in for specific wavelengths ranges from plot (d) for better visualization. Black dotted lines: range of strong c-opsin1 activation. Data were corrected for daylight saving time shifts.
Extended Data Fig. 4
Extended Data Fig. 4. Light spectra and intensity data for experimental light sources.
(a-e) Light intensity and spectra measured using an ILT950 spectrometer (International Light Technologies Inc, Peabody, USA) for (a) standard worm culture illumination, (b,b’) worm culture using ‘NELIS’ in linear plot (b) and logarithmic plot (b’), (c,c’) Behavioural chamber with ‘Nelis’ white light with UVA as linear plot (c) and logarithmic plot (c’). (d,d’) Behavioural chamber with ‘Nelis’ white light and a filter reducing light below 430nm (UVAR filter, Pixelteq, Salvo Technologies, USA) as linear plot (d) and logarithmic plot (d’), (e,e’) Behavioural chamber with ‘Nelis’ white light matching the intensities of the spectrum >430nm from (d,d’) as linear (e) and logarithmic plot (e’). Purple dotted line in b-e indicates the c-opsin1 high activation range. (f,g) Picture details of ‘Nelis’ light source.
Extended Data Fig. 5
Extended Data Fig. 5. G-protein signaling analyses, irradiance dose response curves and spectral sensitivity analyses of Platynereis c-opsin1.
(a) Broad spectrum white light from Arc lamp used for G-protein selectivity assay. (b) Wavelength spectra from CoolLED light source used for spectral characterization of Platynereis c-opsin1. (c) Cells transfected with Platynereis c-opsin1 showed no increase in calcium concentration after 2s white light pulse in calcium bioluminescence assay testing for Gαq binding (purple diamonds: Pdu-c-opsin1, red open circles: human melanopsin, black inverted triangles: no opsin, black arrow: 2s white light pulse). (d) No luminescence increase after 30s white light pulse indicates that Platynereis c-opsin1 does not signal via Gαs (Pdu c-opsin1, Purple diamond; Jellyopsin, red open triangle; no opsin, black inverted triangle; 30s white light pulse, black arrow). (e) Schematic diagram of Platynereis c-opsin1 chimera with second and third intracellular loop regions replaced by corresponding human melanopsin loop region and downstream signaling. (f) Platynereis c-opsin1-human melanopsin chimera depicted in (e) shows a clear response in the calcium luminescence assay, indicative of Gαq-signaling. (g-m) Irradiance dose response curve of Platynereis c-opsin1-melanopsin chimera at 7 different wavelengths.
Extended Data Fig. 6
Extended Data Fig. 6. Platynereis c-opsin1Δ8/Δ8 allele exhibit lowered locomotor activity under longday, including UVA during LD and DD.
(a-c) Double plotted average actogram plot of c-opsin1+/+ (a: n=17), c-opsin1Δ8/+ (b: n=12) and c-opsin1Δ8/Δ8 worms (c: n=20) under longday, including strong UVA under Light-Dark (LD, days 1-5) and Dark-Dark condition (DD, days 6-10, grey shaded). (d) Significant difference in rhythmicity power (PN) exist for c-opsin1Δ8/+ vs c-opsin1Δ8/Δ8 and c-opsin1+/+ vs c-opsin1Δ8/Δ8, but not for c-opsin1+/+ vs c-opsin1Δ8/+ (Mann-Whitney-Wilcoxon test). (e) Percentage of rhythmicity calculated for all genotypes under LD condition (c-opsin1+/+: 100%R, c-opsin1Δ8/+: 100%R and c-opsin1Δ8/ Δ8: 90%R + 10%WR). (f) c-opsin1Δ8/Δ8 worms showed significant decrease in nocturnal locomotor activity compared to c-opsin1+/+ and c-opsin1Δ8/+ (One-way ANOVA with Sidak’s multiple comparison test). (g) Under DD free-running conditions, significant differences in rhythmicity power (PN) exist for c-opsin1+/+ vs c-opsin1Δ8/Δ8 and c-opsin1+/+ vs c-opsin1Δ8/+, but no difference for c-opsin1Δ8/+ vs c-opsin1Δ8/Δ8 (Mann-Whitney-Wilcoxon test). (h) Percentage of rhythmicity calculated for all genotypes under DD condition (c-opsin1+/+: 76.48%R+17.64%WR+5.88%AR, c-opsin1Δ8/+: 33.33%R+41.67%WR+25%AR and c-opsin1Δ8/Δ8: 30%R+30%WR+40%AR). (i) c-opsin1Δ8/Δ8 worms recorded under DD condition showed significant decrease in nocturnal locomotor activity compared to c-opsin1+/+ and c-opsin1Δ8/+ (One-way ANOVA with Sidak’s multiple comparison test). *p<0.05, ** p<0.01, *** p<0.001. For individual actograms see SuppFig.2.
Extended Data Fig. 7
Extended Data Fig. 7. Platynereis c-opsin1Δ8/Δ7 transheterozygous worms exhibit lowered locomotor activity under longday, including UVA conditions.
(a-b) Average, double-plotted actogram of c-opsin1+/+ (a: n=15), c-opsin1Δ8/Δ7 (b: n=21). 3 days of LD. (c) No difference in power (PN) was observed between c-opsin1+/+ and c-opsin1Δ8/Δ7 (Mann-Whitney-Wilcoxon test). (d) Percentage of rhythmicity calculated for all genotypes under LD condition (c-opsin1+/+: 80%R+13.33WR+6.67AR; c-opsin1Δ8/Δ7: 57.14%R+14.29%WR+28.57AR). (e) c-opsin1Δ8/Δ7 worms showed a significant decrease in nocturnal locomotor activity compared to c-opsin1+/+ (One-way ANOVA with sidak’s multiple comparison test). *p<0.05, ** p<0.01, *** p<0.001. For individual actograms see SupplFig.3.
Extended Data Fig. 8
Extended Data Fig. 8. Locomotion under long day (LD 16:8) and intermediate photoperiod (LD 12:12) with full and filter-reduced UVA.
Locomotor behaviour of Platynereis c-opsin1Δ8/Δ8 mutant and its corresponding wt siblings. (a,b) Double plotted average actograms of c-opsin1+/+ worms under long day Nelis white light with intense UVA (+UVA) (a: n=12) and with filter-reduced UVA (-UVA) (b: n=10). (c) c-opsin1+/+ worms under – UVA conditions showed a significantly decrease locomotor activity compared to worms under +UVA conditions and (d) significant decrease in power (PN) and rhythmicity. (e,f) Double plotted average actograms of c-opsin1Δ8/Δ8 worms under LD16:8 +UVA (e, n=11) and -UVA (f, n=10). (g,h) c-opsin1Δ8/ Δ8 worms recorded in (e,f) showed no difference in locomotor activity level (g) and rhythmicity (h). (i,j) Double plotted average actograms of c-opsin1+/+ worms under LD 12:12 +UVA (i: n=9) and -UVA (j: n=7). (k,l) c-opsin1+/+ worms recorded in (i,j) with a difference in locomotor activity close to statistical significance (k), and no difference in rhythmicity (l). (m,n) Double plotted average actograms of c-opsin1Δ8/Δ8 worms under LD 12:12 +UVA (m: n=10) and -UVA (n: n=9). (o,p) c-opsin1Δ8/Δ8 worms recorded in (m,n) showed no difference trend in locomotor activity level (o) and rhythmicity (p). For all statistical comparisons and p values: Suppl.Fig7 Statistics: locomotor activity: One-way ANOVA, Sidak’s multiple comparison test, period, power and rhythmicity: Individual worm rhythmicity and power were determined via Lomb-Scargle periodograms using ActogramJ. The averages of multiple worms were tested by Mann-Whitney-Wilcoxon test. *p<0.05, ** p<0.01, *** p<0.001. Locomotor data of individual worms: Supp.Figs 8, 9.
Extended Data Fig. 9
Extended Data Fig. 9. Head transcript level analyses for additional candidate genes in c-opsin1Δ/8Δ8 and corresponding wildtypes.
Genes as indicated in each panel. The p-value for differences across time was determined by one-way ANOVA. One-way ANOVA with Sidak’s multiple comparison test was used for differences at specific timepoints. Differences between overall transcript levels (measured as AUC) were tested for by Unpaired student’s t-test with Welch’s correction. n.s.- non significant Data displayed as mean+/- S.E.M., n=3BR (5 heads/BR).
Extended Data Fig. 10
Extended Data Fig. 10. Overview of untargeted proteomics experiment under UVA condition.
(a) UVA light used for untargeted proteomics experiment on c-opsin1+/+ and c-opsin1Δ8/Δ8 worms. (b) Sampling scheme. (c) Cellular and pathway model representing differentially regulated protein candidates. For primary data see: Supplementary Tables S13-S15. N=3BRs (20heads/BR), The significance was calculated by two-sided students t-test with adjusted p-value 0.05 (Permutation based FDR correction). Only proteins with least 2 peptides (at least one of it unique) were included in analyses.
Figure 1
Figure 1. Light intensity ratios provide seasonal information different to photoperiod.
(a) Location of RAMSES hyperspectral radiometers installed at the Platynereis natural habitat at 10m (40°43’50.6”N 13°58’02.9”E) and 4m (40°43’56”N 13°57’44”E) depths for light data collection: GPS symbol. (b) Photoperiod (at 10m) as determined by averaging all wavelengths per timepoint. White bars: times when sensor was out of the water for cleaning. (c) Daylight spectrum (10m, raw data) across the year, sunrise to sunset, without twilight times. For data plotted as average across day or including twilight: see Extended Data Fig.2a,c; for 3D-rotational graphs: Supp.Data 1-3. Green lines: saturation thresholds, black lines: noise equivalent intensity (NEI) thresholds for exemplary wavelengths. (d) 2-D pcolor plot of (c). For data plotted as average across day or including twilight: see Extended Data Fig.2b,d. (e) Daytime monthly irradiance averages from dataset without twilight for March 2011 (yellow), June 2011 (blue), September 2010 (black) and December 2010 (red). (f) Wavelength ratios of equinox days averaged across day. (g) Monthly wavelength average ratio of September/ March. For additional ratios (days, including twilight, different calculation of averages) see Extended Data Fig.2e-g,j-l, 3D-plots: Supp.Data 7-8. (h) Hypothesis of an integrative light detection model further tested in the following experiments. Black dotted lines: range of strong c-opsin1 activation. Original measurements were corrected for daylight saving timeshifts. Maps created with Ocean Data View (v. 5.1.7).
Figure 2
Figure 2. UVA/deep violet light affects locomotor behavior in Platynereis dumerilii.
(a) sexual maturation in Platynereis dumerilii. (b) Platynereis wildtype worms grown under spectral conditions mimicking sunlight (“NELIS” culture, Extended Data Fig.4b,b’) mature significantly faster than sibling worms reared under wormroom ‘standard’-white light (Extended Data Fig.4a), Mann-Whitney U test. Worm density and feeding was as similar as possible for both conditions. Worms were scored mature when exhibiting the mature appearance and exhibited the characteristic “nuptial dance” behavior. (c) Platynereis behavioral recording chamber (51cm x 51cm x 101cm) with broad spectrum lighting system, IR-camera and IR-light. Real time light intensity and temperature were recorded during experiment by light/temperature detector positioned next to the behavioral grid. (d) Behavioral grid with worms tracked by ‘Motif’, an automated worm tracking software developed to detect individual experimental worms (magenta contour outline). (d’) The individual distance moved is calculated from the mid-point of the detected shape in relation to the xy-pixel coordinates in subsequent frames. (d”) Exemplary movement plot of an immature worm recorded and tracked for 10 days. (e,f) Double plotted average actograms of c-opsin1+/+ worms under long day including UVA (e: n=17) and long day filter-reduced UVA (f: n=24). (g) c-opsin1+/+ worms recorded in (f) show significantly decrease locomotor activity compared to (e) (One-way ANOVA, Sidak’s multiple comparison test) and (h) a significant decrease in power (PN) and rhythmicity (Lomb-Scargle periodogram test, Mann-Whitney-Wilcoxon test). Rhythmic strength thresholds were manually annotated: PN≥200 – rhythmic (above magenta dotted line), PN≤100 – arrhythmic (below orange dotted line) and PN>100<200 – weakly rhythmic. (i,j) Double plotted average actograms of c-opsin1+/+ worms under short day including UVA (i, n=11) and short day filter-reduced UVA (j, n=23). (k,l) c-opsin1+/+ worms recorded in (i,j) showed no difference in locomotor activity level (k) and rhythmicity (l). *p<0.05, ** p<0.01, *** p<0.001. Full statistical analyses: Supp.Fig. 7. Locomotor data of individual worms: Supp.Figs 2a,4a,5a,6a. Individual worm rhythm period and power were determined via Lomb-Scargle periodograms using ActogramJ.
Figure 3
Figure 3. Pdu-c-opsin1 mediates UVA/deep violet light input via Gi-signaling and regulates locomotor activity.
(a) Simplified model of phototransduction machinery with different downstream second-messenger signaling systems and relevant readouts used in the HEK293-based second messenger assays , shown in 3b and Extended Data Fig.5c,d). (b) Luminescent assay identified Gi-protein as signaling partner for Pdu c-opsin1. black arrow: forskolin addition (to increase cAMP levels), blue arrow: light pulse, purple diamond: Pdu-c-opsin1, red circle: human rhodopsin1 (positive control), black triangle: reporter construct. See Extended Data Fig.5c,d for Gs and Gq-signaling tests. (c) Ratios between Pdu-c-opsin1 rhodopsin state (R-state) total power value (λmax ≅ 380nm) and metarhodopsin state (M-state) total power value (testing M-state λmax ≅ for 480-700nm; in 20nm intervals) for autumn vs. spring equinox days. The total power value of each state is calculated as the absorbance efficiency of the photoreceptor across the measured averaged equinox day spectra assuming the indicated λmax of R- and M-states. (d) Pdu-c-opsin1 genomic locus with the two independent TALEN target sites in exon 3, resulting in two independent mutations: Δ8bp and Δ7bp, both resulting in early frameshifts and stop codons (red). (e) c-opsin1 mRNA was absent in qPCRs of Pdu c-opsin1Δ8/Δ8 worms, compared to sibling controls. (f,g) Double plotted average actogram of c-opsin1Δ8/Δ8 worms under long day including UVA (f: n=20) and long day filter-reduced UVA (g: n=21). (h) Statistical analysis of (f,g) shows lack of locomotor activity level difference observed for wildtype siblings under different UVA conditions (One-way ANOVA, Sidak’s multiple comparison test). (i) Rhythmicity and power analyses of f,g (Lomb-Scargle, Mann-Whitney-Wilcoxon test). (j,k) Double average actogram plot of c-opsin1Δ8/Δ8 worms under short day including UVA (j: n=9) and short day filter-reduced UVA (k: n=20). (l) Statistical analysis of j,k shows no activity level difference under different UVA conditions (One-way ANOVA, Sidak’s multiple comparison test), full statistical analysis: Supplementary Fig.7. (m) Rhythmicity and power analyses of j,k (Lomb-Scargle, Mann-Whitney-Wilcoxon test). *p<0.05, ** p<0.01, *** p<0.001. Locomotor data of individual worms: Supp.Figs 2c,4b,5b,6b, see Extended Data Fig.6,7, Supp.Figs 2,3 for analyses including heterozygous and transheterozygous worms. Individual worm rhythm period and power were determined via Lomb-Scargle periodograms using ActogramJ.
Figure 4
Figure 4. Loss of Pdu-c-opsin1 affects brain hormone synthesis.
(a-h, i,k,m) Diel profiles of immature head mRNA levels after 5 days of entrainment under long day including UVA n=3, 5heads/BR, data shown as mean±S.E.M. Black: c-opsin1+/+, red: c-opsin1Δ8/Δ8. Tested gene indicated above each graph. Statistics: One-way ANOVA with Sidak’s multiple comparison test. Unpaired student’s t-test with Welch’s correction was used to test for changes in overall transcript levels (AUC). (j,l,n) Targeted LC-MS/MS analyses of mature neuropeptides (j) NPY-1, (l) PDF, (n) VASOTOCIN sampled under long day+UVA condition. The sampling timepoint (blue arrows: i, k, m) was chosen 2hours after the maximally detected wildtype transcript levels to account for translational and peptide processing delays. n=10 BRs/genotype. 3heads/BR. Details: Supplementary Table S11. (o) Targeted LC-MS/MS analyses of NPY1 under LD12:12. 12BRs/ genotype. 3heads/BR; Statistics: Unpaired student’s t-test with Welch’s correction and One-way ANOVA with sidak’s multiple correction for peptide quantification. Details: Supplementary Table S12. *p<0.05, ** p<0.01, *** p<0.001, n.s.- non significant (p) Integrative light detection model in which photoperiod and UVA light provide differential information about seasonal time via c-opsin1. c-opsin1+/+ : black, c-opsin1Δ8/Δ8 : red; abbreviations: BR: biological replicate, tph: tryptophan hydroxylase, th: tyrosine hydroxylase, ddc: dopa decarboxylase, hiomt: acetylserotonin O-methyltransferase.

Comment in

Similar articles

Cited by

References

    1. Korringa P. Relations between the moon and periodicity in the breeding of marine animals. Ecological Monographs. 1947;17:347–381.
    1. Numata H, Helm B. Annual, lunar, and tidal clocks : patterns and mechanisms of nature’s enigmatic rhythms. Springer; 2014.
    1. Tessmar-Raible K, Raible F, Arboleda E. Another place, another timer: Marine species and the rhythms of life. Bioessays. 2011;33:165–172. doi: 10.1002/bies.201000096. - DOI - PMC - PubMed
    1. Shlesinger T, Loya Y. Breakdown in spawning synchrony: A silent threat to coral persistence. Science. 2019;365:1002–1007. doi: 10.1126/science.aax0110. - DOI - PubMed
    1. Humphries MM, Studd EK, Menzies AK, Boutin S. To Everything There Is a Season: Summer-to-Winter Food Webs and the Functional Traits of Keystone Species. Integr Comp Biol. 2017;57:961–976. doi: 10.1093/icb/icx119. - DOI - PubMed

Publication types