. 2021 Jan;27(1):125-135.
doi: 10.1038/s41591-020-01145-0. Epub 2021 Jan 11.

Modeling human adaptive immune responses with tonsil organoids

Affiliations

Modeling human adaptive immune responses with tonsil organoids

Lisa E Wagar et al. Nat Med. 2021 Jan.

Abstract

Most of what we know about adaptive immunity has come from inbred mouse studies, using methods that are often difficult or impossible to confirm in humans. In addition, vaccine responses in mice are often poorly predictive of responses to those same vaccines in humans. Here we use human tonsils, readily available lymphoid organs, to develop a functional organotypic system that recapitulates key germinal center features in vitro, including the production of antigen-specific antibodies, somatic hypermutation and affinity maturation, plasmablast differentiation and class-switch recombination. We use this system to define the essential cellular components necessary to produce an influenza vaccine response. We also show that it can be used to evaluate humoral immune responses to two priming antigens, rabies vaccine and an adenovirus-based severe acute respiratory syndrome coronavirus 2 vaccine, and to assess the effects of different adjuvants. This system should prove useful for studying critical mechanisms underlying adaptive immunity in much greater depth than previously possible and to rapidly test vaccine candidates and adjuvants in an entirely human system.


Conflict of interest statement

Competing interests

S.N.T., M.C. and E.G.D. are employed and have stock options with the biotechnology company Vaxart. P.L.F. and D.H.D. have shares in Nanommune, a company that uses Sino Biological’s proteins on commercially available protein microarrays. L.E.W., A.S., C.M.C., B.S.W., M.M.L., V.M., L.P.J., J.Z.A., L.K.B., N.G., K.J.L.J., F.Y., K.R., K.M.R., K.M.B., K.D.M., I.N.A., A.I.S., A.J., G.B.H., P.S.K., W.H.R., S.D.B., C.J.K. and M.M.D. declare no competing interests.

Figures

Extended Data Fig. 1 |
Extended Data Fig. 1 |. Characteristics of B cells from tonsil organoid cultures.
a, Flow cytometry gating scheme on representative unstimulated and LAIV-stimulated cultures. b, Representative ELISpot wells for detection of Ab-secreting cells with influenza vaccine specificity. The number of spots detected are shown in the corner of each well. c, Comparison of organoid cultures grown in standard flat-bottom wells vs. transwells. Data shown are from day 7 LAIV-stimulated cultures (n = 6 donors). p values shown were determined with paired Wilcoxon signed-rank two-sided tests. Boxplots show median values with hinges representing first and third quartiles and whiskers representing the highest and lowest value that is within 1.5X the interquartile range of the hinges. d, Correlation between specific Ab secretion and plasmablast frequency in influenza-stimulated and unstimulated cultures on day 7. Detection of influenza-specific IgG antibodies by semi-quantitative indirect ELISA. Optical density was corrected for background using unspent culture medium as a control. Each donor (n = 15) was tested under four conditions: no stimulation, IIV-stimulated, LAIV-stimulated, or H1N1 WT virus-stimulated. Plasmablast (CD19+ CD38+++ CD27+) frequencies were determined by flow cytometry.
Extended Data Fig. 2 |
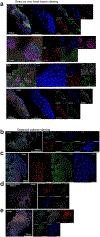
Extended Data Fig. 2 |. Confocal imaging showing distribution of different cell types and their interactions in tonsil tissue and organoid cultures.
Merge does not include DAPI staining for clarity. a, One fresh tonsil tissue was stained with panels of markers to define T and B cell areas and GC structure. b, Day 4 unstimulated organoid stained for T and B cell markers. c, Day 4 LAIV organoid stained for germinal center markers. d, Day 4 unstimulated organoid stained for B and T cell distribution. e, Day 4 LAIV organoid stained for markers of T follicular helper cells. For organoid cultures (b-e), representative examples are shown from organoid cultures derived from three different donors.
Extended Data Fig. 3 |
Extended Data Fig. 3 |. Quantification of organoid organization and function.
a, Quantification of CXCR4 and CD83 expression levels (mean intensity, left panel) and percent positive (percentage of CD20+B cells, right panel) in day 4 tonsil organoids from one donor. Two areas of an LAIV-stimulated organoid (top GC and bottom GC as also shown in Fig. 3a) and a representative GC-organized area from an unstimulated organoid were used for the calculation. b, Representative intracellular AID flow cytometry staining profiles. Data shown are from a day 4, LAIV-stimulated organoid culture. Total B cells were subsetted based on CD38 and CD27 expression and are shown as individual profiles in red compared to a ‘no AID primary antibody’ FMO control in grey.
Extended Data Fig. 4 |
Extended Data Fig. 4 |. B cell receptor sequencing from HA-specific B cells.
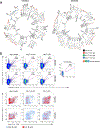
a, Phylogenetic trees from two donors are shown (top). Day 0 clones are indicated by black points. Different isotypes (IgM, IgA, IgG) are indicated by color (green, blue, and red respectively). Oligoclonal populations and clonal families from single cell data are represented by larger points (open circles). Clonal families were defined as BCR sequences that use the same V and J genes and have at least 70% amino acid identity in the CDR3 region for heavy and light chains. b, FACS staining and B cell phenotypes of HA-specific B cells compared to the total B cell pool.
Extended Data Fig. 5 |
Extended Data Fig. 5 |. Tracking individual heavy-chain BCR lineages before and after LAIV stimulation in tonsil organoids show evidence of isotype switching.
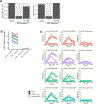
Immunoglobulin heavy-chain gene rearrangements for each isotype were sequenced from total memory B cells, germinal center B cells, and plasmablasts sorted from cultures of four donors on days 0 and 7. Heavy-chain BCR sequences from lineages that contained members as only IgM on day 0 and as only isotype-switched on day 7 were compared for their somatic hypermutation levels. For each lineage, the mean SHM was calculated for day 0 IgM members and for day 7 switched members, and the difference between these means was plotted. Lineages with increased mutation are shown in blue and those with decreased mutation in red.
Extended Data Fig. 6 |
Extended Data Fig. 6 |. Depletion of pre-existing HA-specific and non-naive B cells do not prevent production of new high-affinity HA+ B cells after organoid culture.
B cells with high affinity BCRs for A/California 2009 HA+ and all non-naive B cells were depleted by FACS and depletion was confirmed by post-sort analysis. After 10 days in organoid culture, cells were harvested, re-stained for A/California HA+ B cells, and run on a flow cytometer. n = 4 donors were tested.
Extended Data Fig. 7 |
Extended Data Fig. 7 |. Effects of cell depletion on influenza-specific antibodies and their affinities.
a, Rescue of plasmablast and Ab responses to LAIV stimulation by supplementing pDC-depleted cultures with type I IFNs. b, Frequency of CD4+ T cells (of live cells) in intact and CD4-depleted cultures on day 7. CD4+ cells were depleted by positive selection with magnetic particles. c, Biolayer interferometry data indicating Ab affinity for A/California 2009 H1N1 HA full length, head-specific, and stem domains. Colors are matched to patient samples in (b).
Extended Data Fig. 8 |
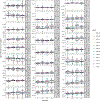
Extended Data Fig. 8 |. SARS-CoV2-specific Abs detected in organoid cultures stimulated with Ad5 vectored vaccine candidates.
Day 14 post-stimulation culture supernatants were tested for the presence of SARS-CoV2-specific IgM, IgG, and IgA in n = 12 donors. Abs were detected using a protein microarray. Individuals donors are represented by symbols. The signal intensities shown were background subtracted based on unstimulated control cultures from the same donor. Boxplots show median values with hinges representing first and third quartiles and whiskers representing the highest and lowest value that is within 1.5X the interquartile range of the hinges.
Fig. 1 |
Fig. 1 |. Adaptive immune responses in tonsil organoids.
a, Workflow for tissue disruption and culture preparation with representative stereoscope images from day-5 unstimulated or LAIV-stimulated replicate cultures. Light regions are areas of high cell density. b, Cell composition of immune cell types in freshly isolated, frozen and revived day-0 tonsil cells, day-7 unstimulated cultures and day-7 LAIV-stimulated cultures. Frequencies were determined by flow cytometry, and plotted values are the mean ± s.e.m. (n = 5 donors). PB/PCs, plasmablast/plasma cells; NK, natural killer. c, Plasmablast differentiation and specific antibody secretion from unstimulated and LAIV-stimulated organoids from day-7 cultures. Paired, two-sided Wilcoxon signed-rank tests were used to calculate P values (n = 15 donors). OD, optical density. d, Antigen-specific antibodies and total IgG from day-7 unstimulated and LAIV-stimulated organoid cultures. Colors represent individual donors (n = 6). e, ASCs specific for influenza antigens from day-7 unstimulated and LAIV-stimulated cultures (n = 5 donors). f, Plasmablast frequencies and antibody secretion on day 14 from immune organoids derived from human lung-draining lymph nodes and spleens (n = 2 for each tissue). A/Cal, A/California H1N1 virus.
Fig. 2 |
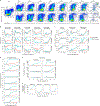
Fig. 2 |. Longitudinal tracking of immune organoids reveals cellular and functional changes consistent with an adaptive response.
a, Representative flow cytometry staining of B cell differentiation phenotypes in unstimulated and LAIV-stimulated cultures. Cells shown are pre-gated on total B cells (CD45+CD19+CD3). b,c, Quantitation of B cell (b) and T cell (c) phenotypes across time in unstimulated and LAIV-stimulated organoids. d, Influenza-specific antibodies detected in culture supernatants. e, Neutralizing capacity of antibodies in culture supernatants against two of the four vaccine strains represented in the antigen stimulation (LAIV 2015–2016). Complete cellular and humoral data from n = 3 donors (ae) and longitudinal antibody detection data from an additional n = 4 donors (d) are shown. f, Influenza M1-specific CD8+ T cell responses in unstimulated and LAIV-stimulated tonsil organoids from four HLA-A2+ donors. Donor ages (in years) are shown in parentheses after donor IDs.
Fig. 3 |
Fig. 3 |. Diversity and maturation of the influenza response.
a, Confocal microscopy images of a day-4 LAIV-stimulated organoid culture and B cell areas with light zone (LZ) and dark zone (DZ) organization. b, Single-cell RNA-seq of B cells from day-0 tonsil cells and organoid cultures from days 5 and 9 from one donor. The fold change values in genes and antibodies (Ab) highly expressed in GC compared to naive B cells (at least 1.5-fold increase) were plotted from day-0 (d0) B cells and day-5 (d5) LAIV-stimulated B cells. c, Median fluorescence intensity (MFI) for protein-level AID expression (top) and the relative proportions of B cell subsets (bottom) on days 0, 4 and 7 of organoid culture. Box plots show median values with hinges representing the first and third quartiles and whiskers representing the highest and lowest value that is within 1.5 times the interquartile range of the hinges (n = 4 donors). FMO, fluorescence minus one. d, Single-cell BCR sequencing of high-affinity A/California 2009 H1N1 HA-specific plasmablasts and GC B cells from one representative donor. High-affinity B cells specific for HA from day-0 (black points) and day-7 LAIV-stimulated organoid cultures (green, blue and red points representing IgM, IgA and IgG isotypes, respectively) are shown. Clonal families are represented by open shading. e, Organoid cultures pre-depleted of high-affinity A/California HA+ B cells and non-naive B cells produce new HA+ B cells. Effective depletion on day 0 of HA+ B cells and non-naive populations was confirmed by post-sort analysis, and new HA+ B cells were detectable on day 10. Data shown are representative plots from one of n = 4 donors. f, Influenza-specific antibodies were detected in depleted organoid cultures from three of n = 4 donors tested. Donor ages (in years) are shown in parentheses after donor IDs.
Fig. 4 |
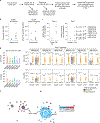
Fig. 4 |. Somatic hypermutation and antigen-directed affinity maturation are supported in tonsil organoids.
a, BCR repertoire analysis workflow on cultures prepared from tonsil cells depleted of high-affinity HA+ and total non-naive B cells (n = 6 donors). b, Influenza vaccine-specific and A/California 2009 H1N1 HA-specific antibodies after 7 d in unstimulated and LAIV-stimulated cultures. c, Somatic hypermutation as measured by the number of nucleotide mutations from the germline heavy-chain BCR sequences. Data are mean ± s.e.m. and significance was calculated with two-sided Welch t-tests. d, Clone size (as measured by the number of RNA molecules per lineage) and diversity (as measured by the number of unique RNA molecules per lineage) in A/California 2009 H1N1 HA+ B cell lineages compared to non-A/California HA+ lineages were measured in n = 6 donors. Specificity for A/California HA was inferred from the pool of known day-0 HA+ BCRs. Box plots show median values with hinges representing the first and third quartiles and whiskers representing the highest and lowest value that is within 1.5 times the interquartile range of the hinges. Each overlaid point represents an individual lineage. Significance values shown were calculated using two-sided Welch t-tests. Donor ages (in years) are shown in parentheses after donor IDs. e, Development of HA specificity in a BCR lineage from one donor. The size of the node represents the number of RNA molecules detected, the distance between nodes is proportional to the edit distance (nucleotide) between them, and the color reflects edit distance (amino acid) to the nearest known A/California HA-specific sequence, with light blue representing an exact match. The root sequence (56), major node (86) and a subset of the major node with IgG class switch (85) are highlighted.
Fig. 5 |
Fig. 5 |. Depletion studies reveal cell types required for plasmablast differentiation, specific antibody secretion and antibody affinity in organoid cultures.
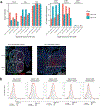
a,b, Effect of cell subset depletion on (a) plasmablast differentiation and (b) specific antibody secretion. Fold change in plasmablast frequency is relative to sorted cells reconstituted with the depleted cell type. Sort depletion experiments were performed on cells from n = 6 (naive B cells and non-naive B cells), n = 2 (total B cells and pDCs) or n = 3 (myeloid cells + pDCs, regulatory T (Treg) cells, memory B cells and plasmablasts) donors. c,d, Effect of CD4+ depletion on (c) plasmablast differentiation and (d) antibody production after 7 d in organoid culture (n = 15 donors). Antibodies against influenza were not detected in unstimulated controls. Paired, two-sided Wilcoxon signed-rank tests were used to determine the significance values. e, Dependence on CD4+ cells for influenza-specific antibody secretion was associated with age. Intact or CD4+ depleted, LAIV-stimulated cultures were stratified into ages 5 years and under (red) or older than 5 (cyan). Box plots show the median values with hinges representing the first and third quartiles and whiskers representing the highest and lowest value that is within 1.5 times the interquartile range of the hinges. Unpaired, two-sided Mann–Whitney U tests were used to calculate significance. f, Biolayer interferometry binding data from intact or CD4+-depleted cultures. Dissociation rates as measured by kd (1/s) are shown for four donors and detailed binding traces from one representative donor. Data were collected from antibodies binding full-length A/California 2009 H1N1 HA or head domain only. Stem-specific antibodies were detected in two donors but only under CD4-containing conditions. Colors are matched to donor data shown in c and d. g, Minimal cell requirements to support an influenza B cell response. Individual cell types were sorted and then recombined as shown to test for plasmablast differentiation and antibody secretion after 7 d of stimulation with LAIV (n = 7 donors). h, Contribution of naive versus memory CD4+ T cells in B cell differentiation and influenza-specific antibody secretion under minimal cellular conditions. Naive B cells, APCs and CD45 cells were sorted and combined with equal numbers of either naive (CD45RA+CD27+) or memory (all non-naive) CD4+ T cells for 10 d in the presence of LAIV (n = 5 donors).
Fig. 6 |
Fig. 6 |. Ability to respond to non-influenza antigens and immunomodulation with adjuvants.
a,b, Plasmablast differentiation in response to MMR vaccine stimulation in tonsil organoid cultures (a) and their corresponding MMR-specific IgG production (b). Organoid cultures from seven donors were harvested on day 11 for flow cytometry analysis and antibody secretion. Significance values were calculated using paired, two-sided Wilcoxon signed-rank tests. Donor ages are shown in parentheses. c, PE-specific B cells were detected at low levels in unstimulated cultures (0.05% of total B cells) and were increased with PE stimulation but not with an irrelevant antigen (n = 3 donors; day 11 after stimulation). d, PE-specific B cell frequencies were enhanced by stimulation in the presence of alum (n = 4 donors; day 10 after stimulation). Representative flow cytometry plots are shown from one donor. Individual points are shown for each donor. Treatment groups were tested with paired, two-sided t-tests to determine significance values. e, Tonsil organoid responses to rabies vaccine, as indicated by pre-GC, GC and plasmablast B cell phenotypes and antigen-specific IgM after 14 d of culture. NP, nucleoprotein. P values between treatment groups were determined with paired, two-sided t-tests (n = 10 donors). f, Lung-draining lymph nodes and spleen organoids were stimulated for 14 d with rabies vaccine. g, Tonsil organoids were stimulated with vaccine candidates for SARS-CoV-2 (n = 12 donors). Ad5 vectors containing either spike protein (S), spike and nucleocapsid protein (SN) or the S1 spike subunit with nucleocapsid (S1N) were used for stimulation, and responses were measured after 14 d in culture. Box plots show the median values with hinges representing the first and third quartiles and whiskers representing the highest and lowest value that is within 1.5 times the interquartile range of the hinges. Culture supernatants were collected and tested for antigen-specific IgM, IgG and IgA. One donor that was positive for multiple proteins is shown. An irrelevant adenoviral vector with norovirus VP1 was used as a control. Paired, two-sided Wilcoxon signed-rank tests were used to calculate P values shown (not adjusted for multiple comparisons).

Comment in

References

    1. Behring E Untersuchungen uber das Zustandekommen der Diphtherie-Immunitat bei Thieren. Dtsch. Med. Wschr 16, 1145–1147 (1890).
    1. Behring E & Kitasato S Ueber das Zustandekommen der Diphtherie-Immunitat und der Tetanus-Immunitat bei Thieren. Dtsch. Med. Wschr 16, 1113–1114 (1890).
    1. Kaufmann SHE Emil von Behring: translational medicine at the dawn of immunology. Nat. Rev. Immunol 17, 341–343 (2017). - PubMed
    1. Kaufmann SH Immunology’s foundation: the 100-year anniversary of the Nobel Prize to Paul Ehrlich and Elie Metchnikoff. Nat. Immunol 9, 705–712 (2008). - PubMed
    1. Miller JF The discovery of thymus function and of thymus-derived lymphocytes. Immunol. Rev 185, 7–14 (2002). - PubMed

Publication types

MeSH terms