. 2021 Jan;27(1):66-72.
doi: 10.1038/s41591-020-1133-8. Epub 2021 Jan 11.

Exome-wide evaluation of rare coding variants using electronic health records identifies new gene-phenotype associations

Affiliations

Exome-wide evaluation of rare coding variants using electronic health records identifies new gene-phenotype associations

Joseph Park et al. Nat Med. 2021 Jan.

Abstract

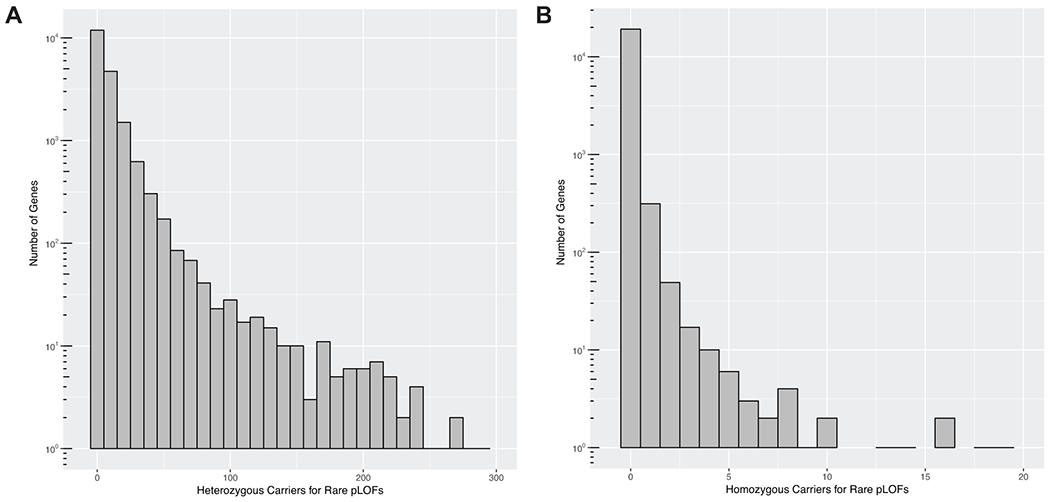
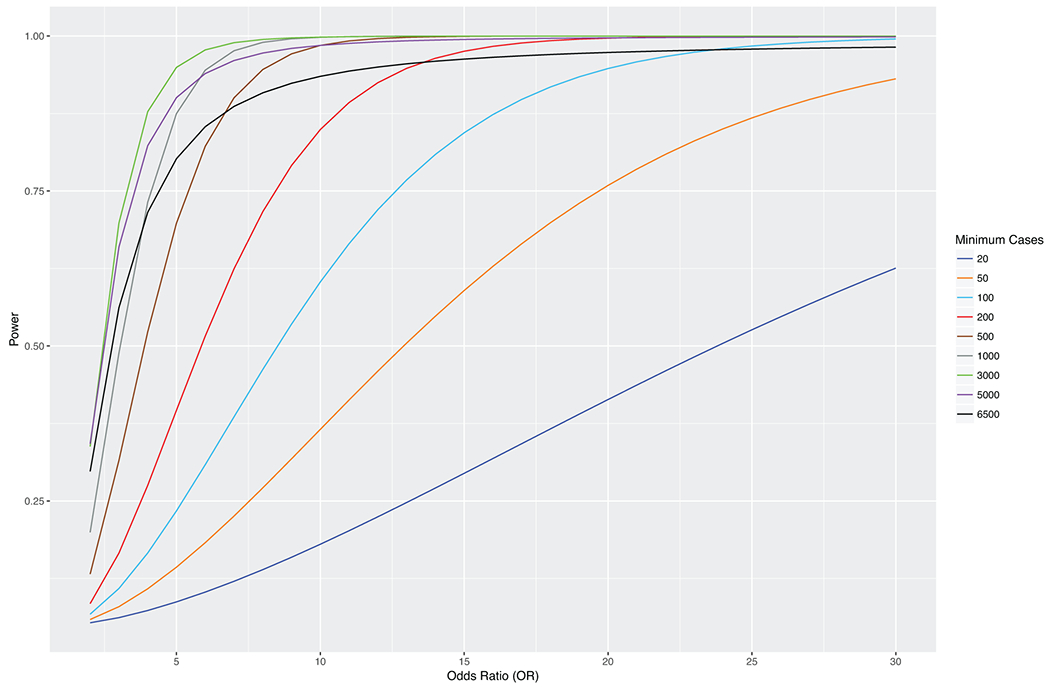
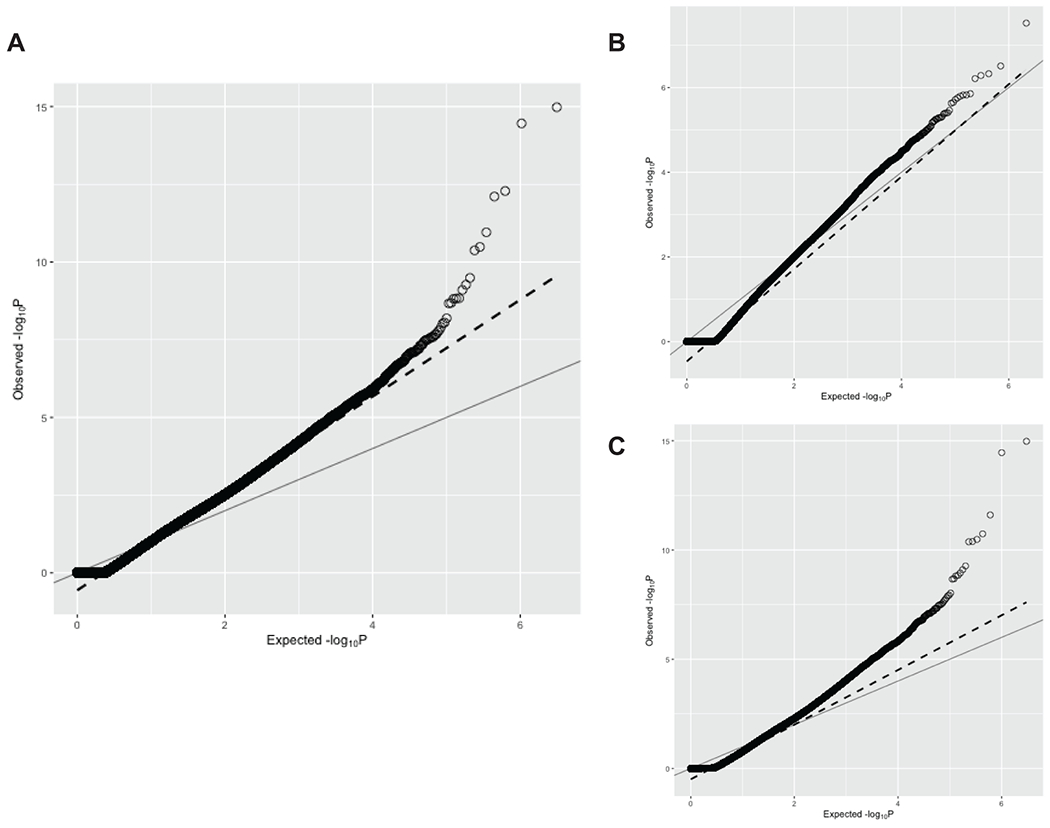
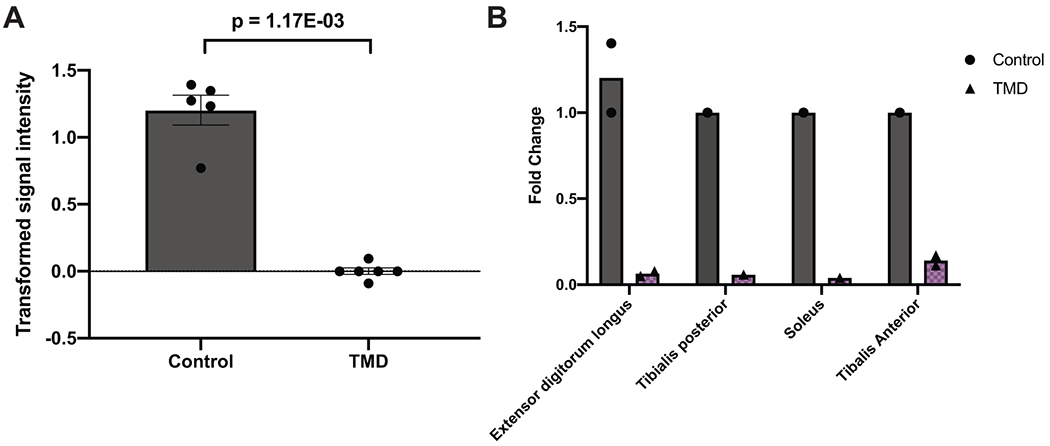
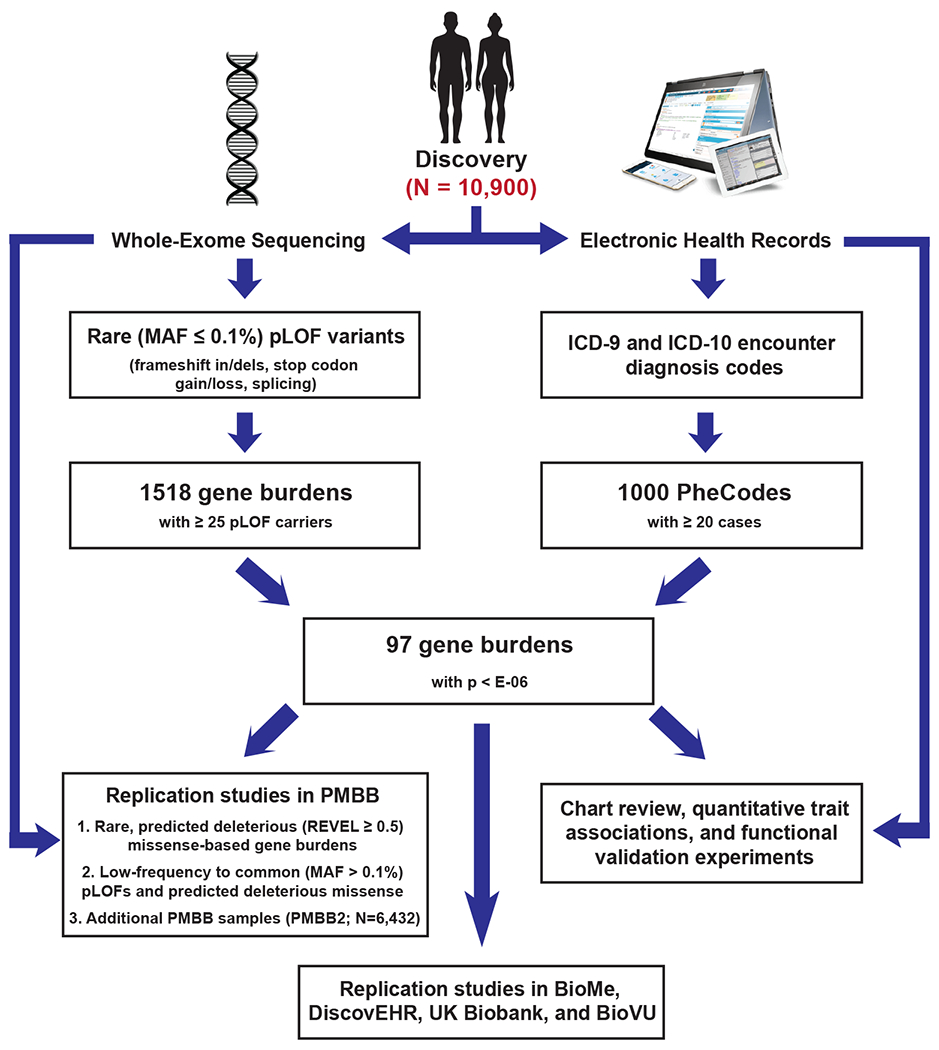
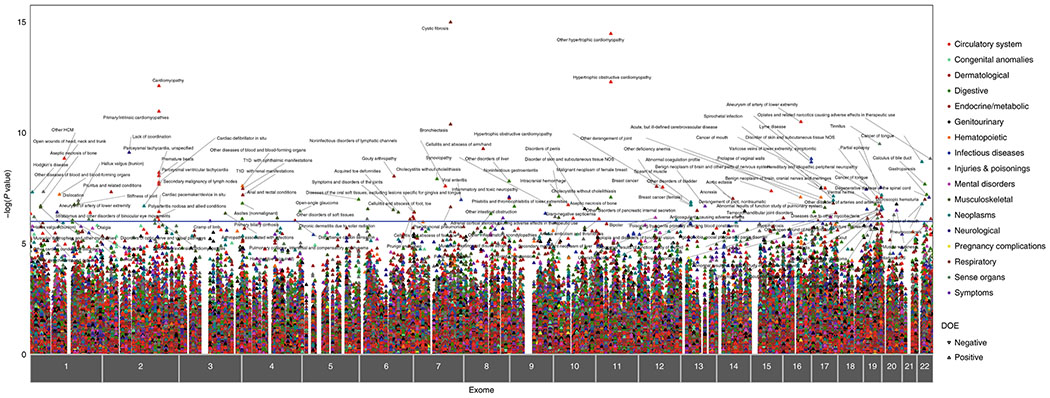
The clinical impact of rare loss-of-function variants has yet to be determined for most genes. Integration of DNA sequencing data with electronic health records (EHRs) could enhance our understanding of the contribution of rare genetic variation to human disease1. By leveraging 10,900 whole-exome sequences linked to EHR data in the Penn Medicine Biobank, we addressed the association of the cumulative effects of rare predicted loss-of-function variants for each individual gene on human disease on an exome-wide scale, as assessed using a set of diverse EHR phenotypes. After discovering 97 genes with exome-by-phenome-wide significant phenotype associations (P < 10-6), we replicated 26 of these in the Penn Medicine Biobank, as well as in three other medical biobanks and the population-based UK Biobank. Of these 26 genes, five had associations that have been previously reported and represented positive controls, whereas 21 had phenotype associations not previously reported, among which were genes implicated in glaucoma, aortic ectasia, diabetes mellitus, muscular dystrophy and hearing loss. These findings show the value of aggregating rare predicted loss-of-function variants into 'gene burdens' for identifying new gene-disease associations using EHR phenotypes in a medical biobank. We suggest that application of this approach to even larger numbers of individuals will provide the statistical power required to uncover unexplored relationships between rare genetic variation and disease phenotypes.


Conflict of interest statement

Competing interests

The authors declare no competing interests.

Figures

Extended Data Fig. 1
Extended Data Fig. 1. Distribution of number of carriers for rare predicted loss-of-function (pLOF) variants per gene in Penn Medicine Biobank.
A) Histogram plot for the distribution of number of heterozygous carriers for rare (MAF ≤ 0.1%) pLOF variants per gene in the Penn Medicine Biobank’s (PMBB) exome sequenced cohort. The x-axis represents number of heterozygous pLOF carriers per gene in bin widths of 10, and the log-scaled y-axis represents the number of genes with the x-axis-specified number of heterozygous carriers. B) Histogram plot for the distribution of number of homozygous carriers for rare pLOF variants per gene in PMBB’s exome sequenced cohort. The x-axis represents number of homozygous pLOF carriers per gene in bin widths of one, and the log-scaled y-axis represents the number of genes with the x-axis-specified number of homozygous carriers.
Extended Data Fig. 2
Extended Data Fig. 2. Power analyses for association of gene burdens with at least 25 heterozygous carriers for rare pLOF variants with phenotypes of various case counts.
Power analyses for association of gene burdens collapsing rare pLOF variants with 25 heterozygous carriers (i.e. allele frequency = 25/2N ≈ 0.001, where N = 2172 (AFR) + 8198 (EUR)) with phenotypes having various case counts. Phenotype case counts range from 20 to 6500 to reflect the range of case counts for phecodes in the Penn Medicine Biobank discovery cohort, and the power of the gene burden association with each phenotype as a function of odds ratio (OR=exp(beta)) is plotted on separate lines per the plot legend.
Extended Data Fig. 3
Extended Data Fig. 3. Quantile-quantile plot of gene burden testing results from discovery phase of exome-by-phenome-wide association studies in Penn Medicine Biobank.
A) Quantile-quantile plot of p values from all exome-by-phenome-wide associations using gene burdens collapsing rare (MAF ≤ 0.1%) predicted loss-of-function (pLOF) variants per gene in the Penn Medicine Biobank (PMBB). The x-axis represents the expected −log10(p value) under the uniform distribution of p values. The y-axis represents the observed −log10(p value) from the discovery phase of the exome-by-phenome-wide gene burden association studies collapsing rare pLOF variants in PMBB. Each point represents an association between one of 1518 gene burdens and one of 1000 phecodes via logistic regression. The solid line shows the relationship between the expected and observed p values under the uniform p value distribution. The dashed line represents the observed fit line between the 50th and 95th percentile of gene burden associations, and the slope of this line is λ∆95 = 1.558. B) AFR-specific QQ plot of p values from all exome-by-phenome-wide associations using gene burdens collapsing rare (MAF ≤ 0.1%) predicted loss-of-function (pLOF) variants per gene in PMBB. Data is presented in a similar manner to panel A. The slope of the fitted line is the AFR-specific λ∆95 = 1.09. C) EUR-specific QQ plot of p values from all exome-by-phenome-wide associations using gene burdens collapsing rare (MAF ≤ 0.1%) predicted loss-of-function (pLOF) variants per gene in PMBB. Data is presented in a similar manner to panel A. The slope of the fitted line is the EUR-specific λ∆95 = 1.251.
Extended Data Fig. 4
Extended Data Fig. 4. MYCBP2 is downregulated in tibial muscular dystrophy.
A) Comparison of MYCBP2 expression levels in human distal lower extremity muscles in tibial muscular dystrophy (TMD; N=6 independent muscle samples) versus healthy controls (N=5 muscle samples). Data is presented as mean transformed signal intensity, and error bars denote SEM. Transformed signal intensity values were obtained from GEO Series GSE42806, which are baseline-transformed and MAS5.0-normalized signal intensities, and individual values are plotted overlaying the bar plot. Statistical comparison was based on a moderated t-statistic, and p values were adjusted by Benjamini & Hochberg (FDR) correction. B) Comparison of MYCBP2 expression levels in each distal lower extremity muscle included in the comparison in Extended Data Figure 4A. Data is presented as a bar plot showing mean fold change as compared to a single control sample, and individual values are plotted overlaying the bar plot. Fold changes were calculated based on inverse log-transformed signal intensity values from each lower extremity muscle, including extensor digitorum longus (N=2 independent TMD samples, 2 independent control samples), tibialis posterior (N=1 TMD sample, 1 control sample), soleus (N=1 TMD sample, 1 control sample), and tibialis anterior (N=2 TMD samples, 1 control sample).
Extended Data Fig. 5
Extended Data Fig. 5. Functional validation for the association between PPP1R13L and primary open angle glaucoma.
A) Differential expression profile of Ppp1r13l transcript in mouse optic nerve head (ONH) with varying stages of intraocular pressure (IOP)-induced glaucoma. Data represent the fold change in Ppp1r13l expression between different stages of D2 mice (glaucoma, N=50 mice) and D2 Gpnmb+ samples (control, N=10 mice). B) Localization of PPP1R13L protein in the human retina. Shown is the distribution of PPP1R13L by immunohistochemical localization in the retina from normal 68-year-old donor eyes. Overlay of images from DAPI (blue; nuclei) and PPP1R13L (red) in adult human retinal layers are shown on the right. The left represents primary antibody control. Scale bars are shown in each image. The experiment was performed twice independently with consistent results. ONL, outer nuclear layer; OPL, outer plexiform layer; IPL, inner plexiform layer; GCL, ganglion cell layer. C) Relative expression of PPP1R13L transcript in response to oxidative stress in induced pluripotent stem cell-derived retinal ganglion cells (iPSC-RGCs). A two-tailed unpaired Student’s t test was used for statistical analysis, and significant p values are shown. Expression of PPP1R13L in iPSC-RGCs is shown under increasing concentrations of H2O2 treatment (N=3 independent experiments per condition). Plotted are the mean fold changes in comparison to no H2O2, error bars represent standard error of the mean (SEM), and individual values are plotted overlaying the bar plot.
Extended Data Fig. 6
Extended Data Fig. 6. Single-cell RNA-seq of human pancreatic cells shows that RGS12 is not differentially expressed in pancreatic exocrine and endocrine cells, but is reduced in type 1 diabetic peri-islet macrophages.
Comparison of RGS12 expression levels in type 1 diabetes (T1D) versus control in pancreatic beta (endocrine; N=2 T1D donors (410 cells), N=6 control donors (1573 cells)), endothelial (N=5 T1D donors (441 cells), N=6 control donors (166 cells)), stellate (exocrine; N=5 T1D donors (910 cells), N=6 control donors (356 cells)), and peri-islet immune (CD45+ macrophages; N=5 T1D donors (95 cells), N=4 control donors (40 cells)) cells based on single-cell RNA-seq. Differential expression of RGS12 in each cell type was determined by edgeR, which fits normalized expression data to a negative binomial model and uses an exact test with false discovery rate (FDR) control to determine differential expressed genes. Data is presented as bars representing mean normalized RGS12 expression and error bars representing standard error of the mean (SEM). Individual points are plotted overlaying their respective bar plots. Differential expression as determined by edgeR are displayed for each cell type as log2 fold change and p values adjusted by FDR correction.
Extended Data Fig. 7
Extended Data Fig. 7. CILP is expressed in aortic adventitial fibroblasts, and is downregulated in human fibroblasts in response to treatment with TGF-ß.
A) t-SNE plot of aortic single cells in mice. Colors denote 6 cell types: smooth muscle cell (SMC), fibroblast, endothelial cell (EC), macrophage, stem cell, unknown. B) Relative expression of Cilp in all cells projected onto a t-SNE plot based on single-cell RNA-seq. The red arrows indicate where Cilp is expressed. C) t-SNE plot of aortic single cells in humans, with fibroblasts highlighted. D) Relative expression of CILP in all cells projected onto a t-SNE plot based on single-cell RNA-seq. The red box indicates where CILP is expressed. E) Volcano plot displaying differential expression of genes from meta-analysis of microarray and RNA-seq data for human fibroblasts treated with TGF-ß (see Methods or Life Sciences Reporting Summary for details about the datasets used). Meta-analysis of differential expression across the datasets was achieved using the Fisher’s combined probability test. The x-axis represents meta-analyzed log2(fold change), and the y-axis represents meta-analyzed −log10(p value). The top 1% of differentially expressed genes across all datasets are labeled in red (upregulation) or blue (downregulation).
Figure 1.
Figure 1.. Flow chart for exome-by-phenome-wide association analysis using electronic health record phenotypes.
Flowchart diagram outlining the primary methodologies used for conducting the exome-by-phenome-wide association study and for evaluation of the robustness of the associations, indicating that 97 genes had associations at a significance level of p
Figure 2.
Figure 2.. ExoPheWAS plot exhibits the landscape of gene-phenotype associations across the exome and phenome in the Penn Medicine Biobank.
Plot of the results of the exome-by-phenome-wide association study (ExoPheWAS) in the Penn Medicine Biobank for 1518 gene burdens of rare (MAF ≤ 0.1%) predicted loss-of-function (pLOF) variants. The x-axis represents the exome and is organized by chromosomal location. The location of each gene along the x-axis is according to the gene’s genomic location per Genome Reference Consortium Human Build 37 (GRCh37). The association of each gene burden with a set of 1,000 phecodes is plotted vertically above each gene, with the height of each point representing the −log10(p value) of the association between the gene burden and phecode using a logistic regression model. Each phecode point is color-coded according to the phecode group, and the directionality of each triangular point represents the direction of effect (DOE). The blue line represents the significance threshold at p=E-06 to account for multiple hypothesis testing.

References

    1. Dewey FE et al. Distribution and clinical impact of functional variants in 50,726 whole-exome sequences from the DiscovEHR study. Science 354, doi:10.1126/science.aaf6814 (2016). - DOI - PubMed
    1. Stessman HA, Bernier R & Eichler EE A genotype-first approach to defining the subtypes of a complex disease. Cell 156, 872–877, doi:10.1016/j.cell.2014.02.002 (2014). - DOI - PMC - PubMed
    1. Bush WS, Oetjens MT & Crawford DC Unravelling the human genome-phenome relationship using phenome-wide association studies. Nat Rev Genet 17, 129–145, doi:10.1038/nrg.2015.36 (2016). - DOI - PubMed
    1. Verma A et al. Human-Disease Phenotype Map Derived from PheWAS across 38,682 Individuals. Am J Hum Genet 104, 55–64, doi:10.1016/j.ajhg.2018.11.006 (2019). - DOI - PMC - PubMed
    1. Zhang X, Basile AO, Pendergrass SA & Ritchie MD Real world scenarios in rare variant association analysis: the impact of imbalance and sample size on the power in silico. BMC Bioinformatics 20, 46, doi:10.1186/s12859-018-2591-6 (2019). - DOI - PMC - PubMed

Methods References

    1. Wang K, Li M & Hakonarson H ANNOVAR: functional annotation of genetic variants from high-throughput sequencing data. Nucleic Acids Res 38, e164, doi:10.1093/nar/gkq603 (2010). - DOI - PMC - PubMed
    1. Karczewski KJ et al. The mutational constraint spectrum quantified from variation in 141,456 humans. Nature 581, 434–443, doi:10.1038/s41586-020-2308-7 (2020). - DOI - PMC - PubMed
    1. Carroll RJ, Bastarache L & Denny JC R PheWAS: data analysis and plotting tools for phenome-wide association studies in the R environment. Bioinformatics 30, 2375–2376, doi:10.1093/bioinformatics/btu197 (2014). - DOI - PMC - PubMed
    1. Denny JC et al. Systematic comparison of phenome-wide association study of electronic medical record data and genome-wide association study data. Nat Biotechnol 31, 1102–1110, doi:10.1038/nbt.2749 (2013). - DOI - PMC - PubMed
    1. Price AL et al. Pooled association tests for rare variants in exon-resequencing studies. Am J Hum Genet 86, 832–838, doi:10.1016/j.ajhg.2010.04.005 (2010). - DOI - PMC - PubMed

Publication types

LinkOut - more resources