. 2021 May;5(5):625-630.
doi: 10.1038/s41562-020-01019-y. Epub 2021 Jan 11.

The genomics of childhood eating behaviours

Affiliations

The genomics of childhood eating behaviours

Moritz Herle et al. Nat Hum Behav. 2021 May.

Erratum in

Abstract

Eating behaviours may be expressions of genetic risk for obesity and are potential antecedents of later eating disorders. However, childhood eating behaviours are heterogeneous and transient. Here we show associations between polygenic scores for body mass index (BMI-PGS) and anorexia nervosa (AN-PGS) with eating behaviour trajectories during the first 10 years of life using data from the Avon Longitudinal Study of Parents and Children (ALSPAC), n = 7,825. Results indicated that 1 s.d. increase in the BMI-PGS was associated with a 30-37% increased risk for early- and mid-childhood overeating. In contrast, 1 s.d. increase in BMI-PGS was associated with a 20% decrease in risk of persistent high levels of undereating and a 15% decrease in risk of persistent fussy eating. There was no evidence for a significant association between AN-PGS and eating behaviour trajectories. Our results support the notion that child eating behaviours share common genetic variants associated with BMI.


Conflict of interest statement

Competing interests

C.M.B. is a Scientific Advisory Board Member for and grant recipient from Shire Pharmaceuticals Ltd. (Takeda Pharmaceuticals Ltd); a consultant for Idorsia Pharmaceuticals Ltd; and author and royalty recipient from Pearson Plc. All others authors declare no competing interests.

Figures

Figure 1
Figure 1. a-c Eating behavior trajectories during the first ten years of life, total N=7,825.
(A) Childhood overeating trajectories. Low stable (N=5374), Reference trajectory; Low transient (N=1091), BMI-PGS relative risk ratio (RRR) = 1.16 (95% CI: 1.08 – 1.23, p <0.001) and AN-PGS RRR = 0.92 (95% CI: 0.86 – 0.98, p = 0.011); Late increasing (N=883), BMI-PGS RRR=1.37 (95%CI: 1.27-1.47, p<0.001) and AN-PGS RRR=0.94 (95%CI:0.87-1.01, p=0.072); Increasing (N=477), BMI-PGS RRR=1.30 (95%CI: 1.19-1.43, p<0.001) and AN-PGS RRR=0.96 (95%CI: 0.87-1.05, p=0.353) (B) Childhood undereating trajectories. Low stable (N= 1913), Reference trajectory; Low transient (N=2906), BMI-PGS RRR = 0.91 (95%CI: 0.87- 0.97, p=0.002) and AN-PGS RRR = 1.01 (95%CI: 0.96- 1.07, p=0.630); Low decreasing (N=1613); BMI-PGS RRR = 0.93 (95%CI: 0.87- 0.99, p=0.027) and AN-PGS RRR = 0.96 (95%CI: 0.90-1.02, p=0.202); High transient (N=989); BMI-PGS RRR = 0.84 (95%CI: 0.78- 0.91, p<0.001) and AN-PGS RRR = 0.95 (95%CI: 0.88- 1.02, p=0.166); High stable (N=141); BMI-PGS RRR = 0.80 (95%CI: 0.68- 0.95, p=0.012) and AN-PGS RRR = 0.93 (95%CI: 0.79- 1.11, p=0.441) (C) Childhood fussy eating trajectories. Low stable (N=1969), Reference trajectory Low decreasing (N=1142); BMI-PGS RRR= 1.00 (95%CI: 0.93-1.01, p=0.993) and AN-PGS RRR = 0.99 (95%CI: 0.91- 1.06, p=0.706); Low transient (N=2136); BMI-PGS RRR = 0.99 (95%CI: 0.93-1.06, p=0.796) and AN-PGS RRR = 0.99 (95%CI: 0.93- 1.06, p=0.826); High decreasing (N=1112); BMI-PGS RRR = 0.86 (95%CI: 0.80- 0.93, p<0.001) and AN-PGS RRR = 1.05 (95%CI: 0.97- 1.13, p=0.218); Low increasing (N=1040); BMI-PGS RRR = 0.93 (95%CI: 0.86- 1.00, p=0.060) and AN-PGS RRR = 0.97 (95%CI: 0.90-1.05, p=0.486); High stable (N=699), BMI-PGS RRR = 0.85 (95%CI: 0.78- 0.93, p<0.001) and AN-PGS RRR = 1.08 (95%CI: 0.99-1.18, p=0.097)
Figure 2
Figure 2
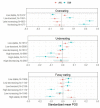
Mean of standardized BMI-PGS (in blue), AN-PGS (in red), and standard error per child eating behavior group (N= 7,825)

References

    1. Ng M, et al. Global, regional, and national prevalence of overweight and obesity in children and adults during 1980-2013: a systematic analysis for the Global Burden of Disease Study 2013. Lancet. 2014;384:766–781. doi: 10.1016/S0140-6736(14)60460-8. - DOI - PMC - PubMed
    1. Yengo L, et al. Meta-analysis of genome-wide association studies for height and body mass index in similar to 700 000 individuals of European ancestry. Hum Mol Genet. 2018;27:3641–3649. doi: 10.1093/hmg/ddy271. - DOI - PMC - PubMed
    1. Swinburn BA, et al. Obesity 1 The global obesity pandemic: shaped by global drivers and local environments. Lancet. 2011;378:804–814. doi: 10.1016/S0140-6736(11)60813-1. - DOI - PubMed
    1. Llewellyn C, Wardle J. Behavioral susceptibility to obesity: Gene-environment interplay in the development of weight. Physiology & behavior. 2015;152:494–501. doi: 10.1016/j.physbeh.2015.07.006. - DOI - PubMed
    1. Parkinson KN, Drewett RF, Le Couteur AS, Adamson AJT, G.M.S.C Do maternal ratings of appetite in infants predict later Child Eating Behaviour Questionnaire scores and body mass index? Appetite. 2010;54:186–190. doi: 10.1016/j.appet.2009.10.007. - DOI - PubMed

Publication types