. 2021 Jun;26(6):2350-2362.
doi: 10.1038/s41380-020-00977-z. Epub 2021 Jan 12.

Role of FMRP in rapid antidepressant effects and synapse regulation

Affiliations

Role of FMRP in rapid antidepressant effects and synapse regulation

Chelcie F Heaney et al. Mol Psychiatry. 2021 Jun.

Abstract

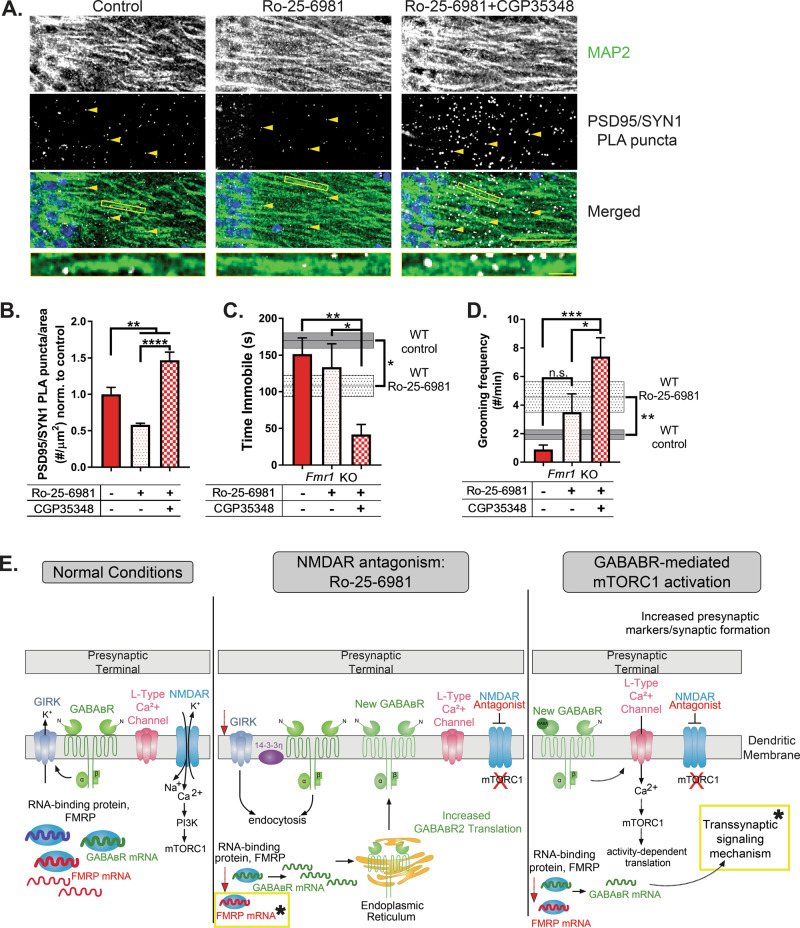
Rapid antidepressants are novel treatments for major depressive disorder (MDD) and work by blocking N-methyl-D-aspartate receptors (NMDARs), which, in turn, activate the protein synthesis pathway regulated by mechanistic/mammalian target of rapamycin complex 1 (mTORC1). Our recent work demonstrates that the RNA-binding protein Fragile X Mental Retardation Protein (FMRP) is downregulated in dendrites upon treatment with a rapid antidepressant. Here, we show that the behavioral effects of the rapid antidepressant Ro-25-6981 require FMRP expression, and treatment promotes differential mRNA binding to FMRP in an mTORC1-dependent manner. Further, these mRNAs are identified to regulate transsynaptic signaling. Using a novel technique, we show that synapse formation underlying the behavioral effects of Ro-25-6981 requires GABABR-mediated mTORC1 activity in WT animals. Finally, we demonstrate that in an animal model that lacks FMRP expression and has clinical relevance for Fragile X Syndrome (FXS), GABABR activity is detrimental to the effects of Ro-25-6981. These effects are rescued with the combined therapy of blocking GABABRs and NMDARs, indicating that rapid antidepressants alone may not be an effective treatment for people with comorbid FXS and MDD.


Conflict of interest statement

The authors declare that they have no conflict of interest.

Figures

Fig. 1
Fig. 1. The rapid antidepressant behavioral effects of Ro-25-6981 require FMRP expression.
a Representative timeline of behavioral procedures. Twenty-four hours prior to the recorded forced swim test (FST), animals were acutely stressed with FST. Approximately 22 h later, animals received a single i.p. injection of their randomly assigned treatment. Forty-five minutes after the injection, animals underwent the splash test, and 30 min after that, they were exposed to a second FST. b WT animals treated with Ro-25-6981 significantly decreased immobility in the FST, but Fmr1 KO mice did not respond to treatment. Two-way ANOVA revealed a significant main effect of treatment (F1,58 = 6.152, p = 0.0161) and genotype (F1,58 = 7.386, p = 0.0087) but did not find a significant genotype × treatment interaction. Newman–Keuls post hoc test revealed a significant difference between WT control (169.9 ± 10.4 s, n = 14) vs. WT Ro-25-6981 (108.1 ± 14.7 s, n = 17), but no significant difference between KO control (190.5 ± 16.0 s, n = 16) and KO Ro-25-6981 (173.7 ± 20.0 s, n = 15). KO control and KO Ro-25-6981 were significantly more immobile than WT Ro-25-6981. c Similarly, Ro-25-6981-treated WT animals increased grooming frequency but treated Fmr1 KO mice did not. Two-way ANOVA revealed a significant main effect of treatment (F1,57 = 7.29, p = 0.0091) and genotype (F1,57 = 15.16, p = 0.0003), but there was not a significant genotype × treatment interaction. Newman–Keuls post hoc test revealed a significant difference between WT control (1.92 ± 0.32 times per minute, n = 13) vs. WT Ro-25-6981 (4.56 ± 1.06, n = 16), but no significant difference between KO control (0.5 ± 0.22 times per minute, n = 16) and KO Ro-25-6981 (1.18 ± 0.31, n = 16). Bars represent mean ± SEM. *p < 0.05, **p < 0.01, n.s. not significant.
Fig. 2
Fig. 2. mTORC1-sensitive FMRP-target mRNAs are regulated by Ro-25-6981 treatment.
a Top: Venn diagram of differentially expressed mRNAs isolated in control/Ro-25-6981 or Ro-25-6981 + rapamycin/Ro-25-6981 conditions with the FDR cutoff of 0.1 (same mRNAs as in b). Bottom: Breakdown of log2 fold change direction of mRNAs in the intersection of the Venn diagram, indicative of the mRNAs that are sensitive to both treatment of Ro-25-6981 and mTORC1 activity. See Tables S4 and S5 for a complete list of genes and fold changes. The single mRNA that is oppositely regulated is Dbp, a transcription factor implicated in regulating circadian rhythm. b Clustered dendrogram and heatmap for log2 fold change for the treatments. Targets are the same as those in the pie chart in a. Dendrogram created using the average linkage method and Euclidean distance metric. Positive fold changes indicate mRNAs are released from FMRP and presumably translated with Ro-25-6981 treatment; negative fold changes indicate that more mRNAs are bound to FMRP with Ro-25-6981 treatment compared to the control (indicative of mRNA repression with Ro-25-6981 treatment) or Ro + Rapa (indicative that mTORC1 activity is needed for mRNAs to be released with Ro-25-6981 treatment) conditions. c In both control/Ro-25-6981 and Ro-25-6981 + rapamycin/Ro-25-6981 conditions, Fmr1 has a negative fold change, indicating Fmr1 mRNAs remain bound to FMRP with Ro-25-6981 treatment and is mTORC1 sensitive. Conversely, Prkaca has a positive fold change in both control/Ro-25-6981 and Ro-25-6981 + rapamycin/Ro-256981 conditions, indicating that Prkaca mRNAs are released from FMRP with Ro-25-6981 treatment and is mTORC1 sensitive. Significance determined with the FDR cutoff of 0.1. d Verification that protein expression of FMRP decreases [11] (control = 1.0 ± 0.03 normalized optical density, n = 8; Ro-25-6981 = 0.83 ± 0.07, n = 8; t14 = 2.008, p = 0.0322) and PKA C-α increases (control = 1.0 ± 0.10 normalized optical density, n = 7; Ro-25-6981 = 1.29 ± 0.12, n = 7; t12 = 1.797, p = 0.0488) with Ro-25-6981 treatment in cortical lysates 45 min after treatment. *p < 0.05.
Fig. 3
Fig. 3. FMRP-target mRNAs regulate transsynaptic signaling.
a Uniquely enriched GO biological process clusters for FMRP targets identified by RIP-Seq where log2(control/Ro-25-6981 fold change) > 0 (blue) and b log2(Ro-25-6981 + Rapa/Ro-25-6981 fold change) > 0 (pink). Transsynaptic signaling is the most significantly enriched GO cluster in both conditions. c Scatterplot showing log2(control/Ro-25-6981 fold change) > 0 log2(Ro-25-6981 + Rapa/Ro-25-6981 fold change) > 0 of the mTORC1-sensitive transsynaptic targets (upper right quadrant). Supplementary Tables S4 and S5 contain the complete list of identified targets.
Fig. 4
Fig. 4. Transsynaptic signaling requires both NMDAR blockade and GABABR-mediated mTORC1 activation.
a Timeline of treatments for neuronal culture experiments in b and f. b Representative immunofluorescence images of treated WT hippocampal neurons stained for PSD-95 (red), SYN1 (green), and MAP2 (gray outline). Panels depict 10 µm segments of dendrites, at least 20 µm from the soma; scale bar = 1 µm. Highlighted boxes indicate representative SYN1 and PSD-95 staining; scale bar = 0.2 µm. c Quantification of average number of PSD-95 puncta within dendritic MAP2 area by treatment. PSD-95 expression increased in all treatments in an mTORC1-independent manner. One-way ANOVA revealed a significant main effect of treatment (F3,184 = 6.303, p = 0.0004). Newman–Keuls post hoc test revealed a significant difference between control (1.0 ± 0.08 normalized optical density, n = 49) vs. Ro-25-6981 (1.63 ± 0.14, n = 46), control vs. Ro-25-6981 + baclofen (1.88 ± 0.17, n = 41), and control vs. Ro-25-6981 + rapamycin + baclofen (1.63 ± 0.17, n = 52). d Quantification of average number of SYN1 puncta within dendritic MAP2 area by treatment. One-way ANOVA revealed a significant main effect of treatment (F3,184 = 11.14, p < 0.0001). Newman–Keuls post hoc test revealed Ro-25-6981 + baclofen (1.61 ± 0.13 normalized optical density, n = 41) significantly increased the number of SYN1 puncta compared to control-treated neurons (1.0 ± 0.06, n = 49), as well as neurons treated with Ro-25-6981 (0.98 ± 0.07, n = 46) and Ro-25-6981 + rapamycin + baclofen (1.08 ± 0.06, n = 52), indicating an mTORC1-dependent effect. e Quantification of Pearson’s correlation coefficient of PSD-95 and SYN1 by treatment. One-way ANOVA did not reveal a significant effect of treatment for the correlation between PSD-95 and SYN1 (F3,186 = 0.8282, p = 0.4799). f Representative dendritic traces of treated hippocampal neurons. White puncta represent proximity-detected PSD-95 and SYN1 proteins by PLA (indicated by yellow arrowheads), and gray outline represents MAP2 staining of the neuron. Puncta at least 12.5 µm from the soma were analyzed. Scale bar = 10 µm. g Quantification of the average number of PSD-95/SYN1 PLA puncta per dendritic MAP2 area. One-way ANOVA revealed a significant main effect of treatment (F4,581 = 18.25, p < 0.0001). Newman–Keuls post hoc test revealed Ro-25-6981 + baclofen (1.65 ± 0.11 puncta/µm2 normalized to control, n = 132) significantly increased the number of PSD-95/SYN1 PLA puncta compared to control-treated (1.0 ± 0.10 puncta/µm2 normalized, n = 119), Ro-25-6981-treated (1.12 ± 0.14 puncta/µm2 normalized, n = 125), and Ro-2506981+rapamycin + baclofen-treated (1.06 ± 0.10 puncta/µm2 normalized, n = 143) neurons. In addition, PLA control neurons (0.05 ± 0.01 puncta/µm2 normalized, n = 67) showed a significant lack of puncta compared to all other treatments. h Representative images of treated WT CA1 stratum radiatum dendrites. White puncta represent proximity-detected PSD-95 and SYN1 proteins by PLA, and red puncta represent FMRP (yellow arrowheads indicate representative puncta of each). i Quantification of the average number of PSD-95/SYN1 PLA puncta per area of CA1 stratum radiatum dendrites. Puncta at least 10 µm from the pyramidal layer were analyzed. One-way ANOVA revealed a significant main effect of treatment (F2,52 = 6.79, p = 0.0024). Newman–Keuls post hoc test revealed that treatment with Ro-25-6981 (4.68 ± 0.78 puncta/µm2 normalized to control, n = 23) significantly increased PSD-95/SYN1 PLA puncta 45 min after treatment compared to control (1.0 ± 0.11 puncta/µm2 normalized, n = 13) and Ro-25-6981 + CGP35348 (2.58 ± 0.64 puncta/µm2 normalized, n = 19). This increase is blocked with the GABABR antagonist CGP35348 (no significant difference between control and Ro-25-6981 + CGP35348). j Protein expression of FMRP decreases with Ro-25-6981 treatment in CA1 stratum radiatum dendrites 45 min after treatment (control = 1.0 ± 0.12 normalized optical density, n = 19; Ro-25-6981 = 0.70 ± 0.07, n = 23; t40 = 2.026, p = 0.0247). Scale bar = 50 µm. Representative dendrites shown below to demonstrate the puncta are located on dendrites. Scale bar = 5 µm. Bars represent mean ± SEM. *p < 0.05, **p < 0.01, ***p < 0.001, ****p < 0.0001, n.s. not significant.
Fig. 5
Fig. 5. GABABR activity is detrimental to synapse formation and rapid antidepressant efficacy of Ro-25-6981 in a preclinical mouse model of FXS.
a Representative images of treated KO CA1 stratum radiatum dendrites. White puncta represent proximity-detected PSD-95 and SYN1 proteins by PLA (indicated by yellow arrowheads). Scale bar = 50 µm. Representative dendrites shown below to demonstrate the puncta are located on dendrites. Scale bar = 5 µm. b Quantification of the average number of PSD-95/SYN1 PLA puncta per area of CA1 stratum radiatum dendrites. Puncta at least 10 µm from the pyramidal layer were analyzed. One-way ANOVA revealed a significant main effect of treatment (F2,10 = 25.45, p = 0.0001). Newman–Keuls post hoc test revealed Ro-25-6981 (0.57 ± 0.02 puncta/µm2 normalized to control, n = 4) significantly decreases PLA puncta compared to control (1.0 ± 0.09 puncta/µm2 normalized, n = 4), but blocking GABABRs with CGP35348 increases the number of puncta (1.47 ± 0.10 puncta/µm2 normalized, n = 5) compared to both other treatments. c One-way ANOVA revealed a significant main effect of treatment (F2,24 = 6.157, p = 0.0069) in the FST. Newman–Keuls post hoc test revealed Fmr1 KO animals treated with Ro-25-6981 + CGP35348 (41.6 ± 13.7 s, n = 9) significantly decrease immobility in the FST compared to control (151.5 ± 21.9 s, n = 9), whereas treatment with Ro-25-6981 alone does not (133.5 ± 31.9 s, n = 9). WT data from Fig. 1 depicted on the y-axis for reference. d Similarly, one-way ANOVA revealed a significant main effect of treatment (F2,24 = 9.616, p = 0.0009) in the splash test. Newman–Keuls post hoc test revealed Ro-25-6981 + CGP35348 (7.4 ± 1.3 times per minute, n = 10) significantly increases grooming frequency in the splash test compared to control (0.88 ± 0.30 times per minute, n = 9) but not Ro-25-6981 treatment only (3.5 ± 1.2 times per minute, n = 8) for Fmr1 KO animals. WT data from Fig. 1 depicted on the y-axis for reference. e Updated rapid antidepressant signaling mechanism model [11, 25, 26] to include RIP-Seq results. Under baseline conditions, activated NMDARs increase intracellular calcium, which activates mTORC1 (left panel). With NMDAR antagonists like ketamine and Ro-25-6981, NMDARs are blocked but activate the release or binding of mRNAs from the RNA-binding protein FMRP (middle panel). Among these released transcripts is GABABR mRNA, which is translated into newly synthesize GABABRs [25]. Old GABABRs and the GIRK channels they are coupled to undergo endocytosis [26]. Newly synthesized GABABRs are coupled to L-type calcium channels and, upon activation, increase intracellular calcium, activating mTORC1 (right panel) [26]. mTORC1-dependent transcripts are released from or bound to FMRP, including those mediating a transsynaptic signal that recruits presynaptic engagement to help form new synapses. Yellow boxes with stars indicate the new steps added to the model based on the current data presented. Bars represent mean ± SEM. *p < 0.05, **p < 0.01, ***p < 0.001, ****p < 0.0001.

References

    1. Wei Y, Chang L, Hashimoto K. A historical review of antidepressant effects of ketamine and its enantiomers. Pharm Biochem Behav. 2020;190:172870. doi: 10.1016/j.pbb.2020.172870. - DOI - PubMed
    1. Li N, Lee B, Liu R-J, Banasr M, Dwyer JM, Iwata M, et al. mTOR-dependent synapse formation underlies the rapid antidepressant effects of NMDA antagonists. Science. 2010;329:959–64. doi: 10.1126/science.1190287. - DOI - PMC - PubMed
    1. Duman RS, Li N, Liu R-J, Duric V, Aghajanian GK. Signaling pathways underlying the rapid antidepressant actions of ketamine. Neuropharmacology. 2011;62:35–41. doi: 10.1016/j.neuropharm.2011.08.044. - DOI - PMC - PubMed
    1. Trullas R, Folio T, Young A, Miller R, Boje K, Skolnick P. 1-aminocyclopropanecarboxylates exhibit antidepressant and anxiolytic actions in animal models. Eur J Pharm. 1991;203:379–85. doi: 10.1016/0014-2999(91)90894-V. - DOI - PubMed
    1. Murrough JW, Iacoviello B, Neumeister A, Charney DS, Iosifescu DV. Cognitive dysfunction in depression: neurocircuitry and new therapeutic strategies. Neurobiol Learn Mem. 2011;96:553–63. doi: 10.1016/j.nlm.2011.06.006. - DOI - PubMed

Publication types

MeSH terms

Substances