. 2021 Feb;24(2):276-287.
doi: 10.1038/s41593-020-00764-7. Epub 2021 Jan 11.

Molecular characterization of selectively vulnerable neurons in Alzheimer's disease

Affiliations

Molecular characterization of selectively vulnerable neurons in Alzheimer's disease

Kun Leng et al. Nat Neurosci. 2021 Feb.

Abstract

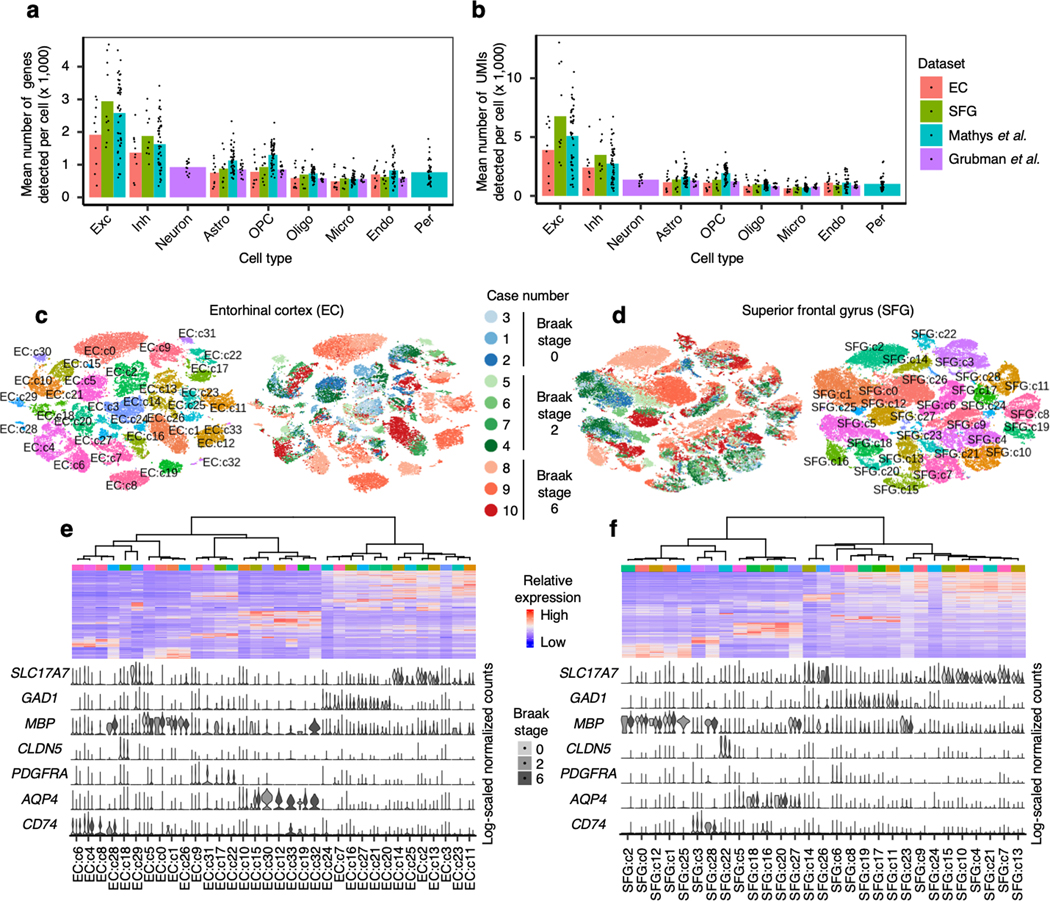
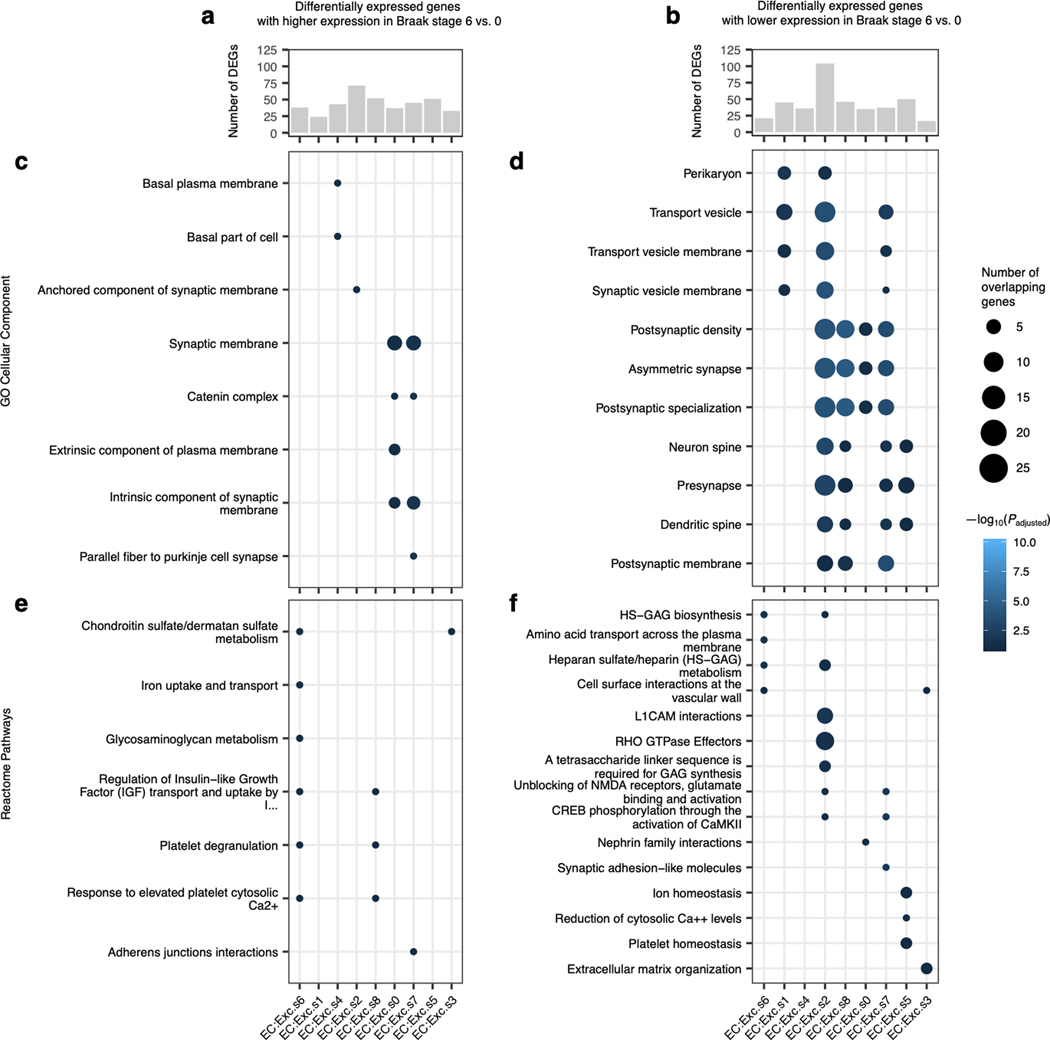
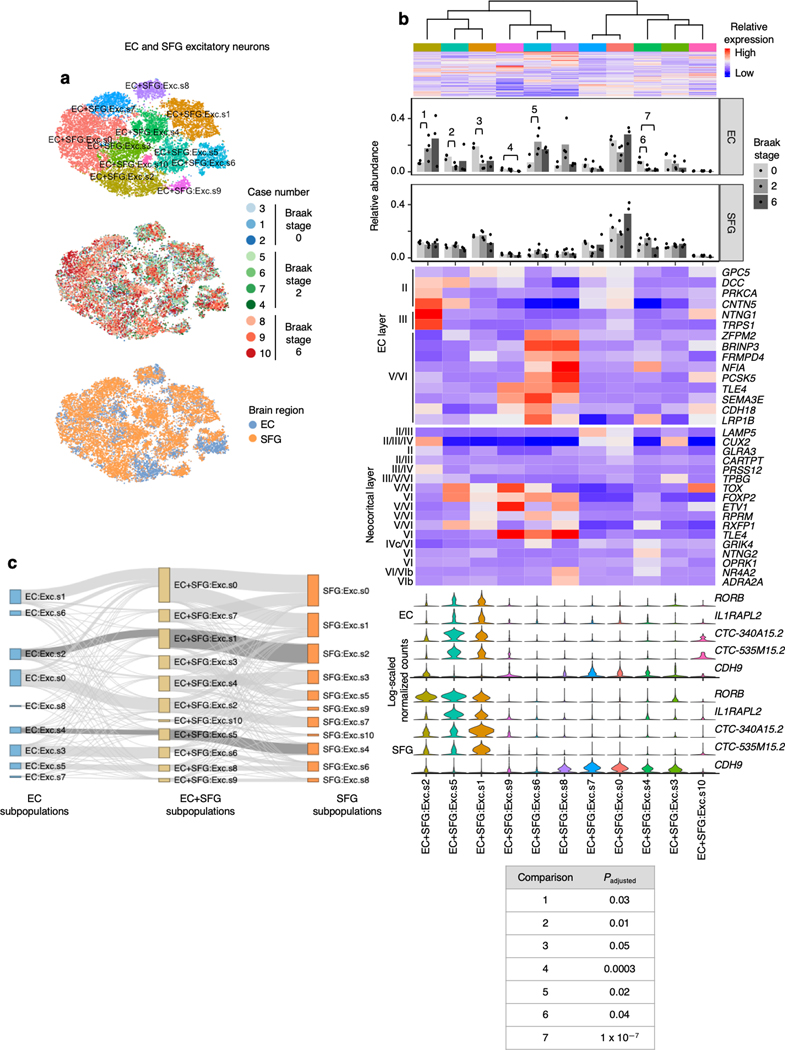
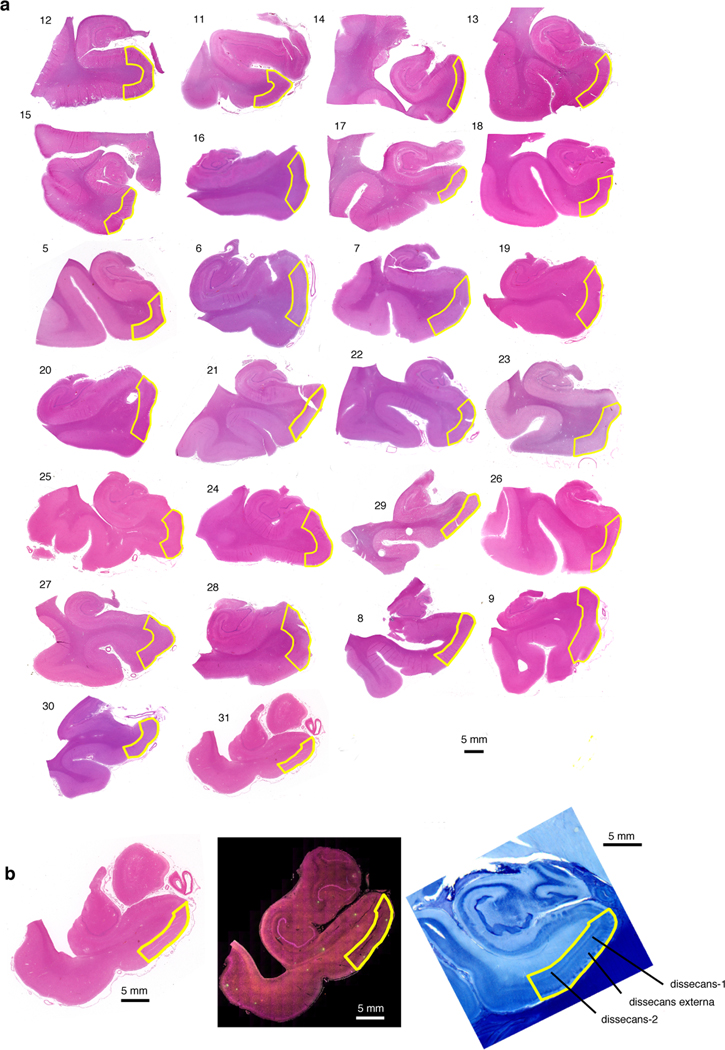
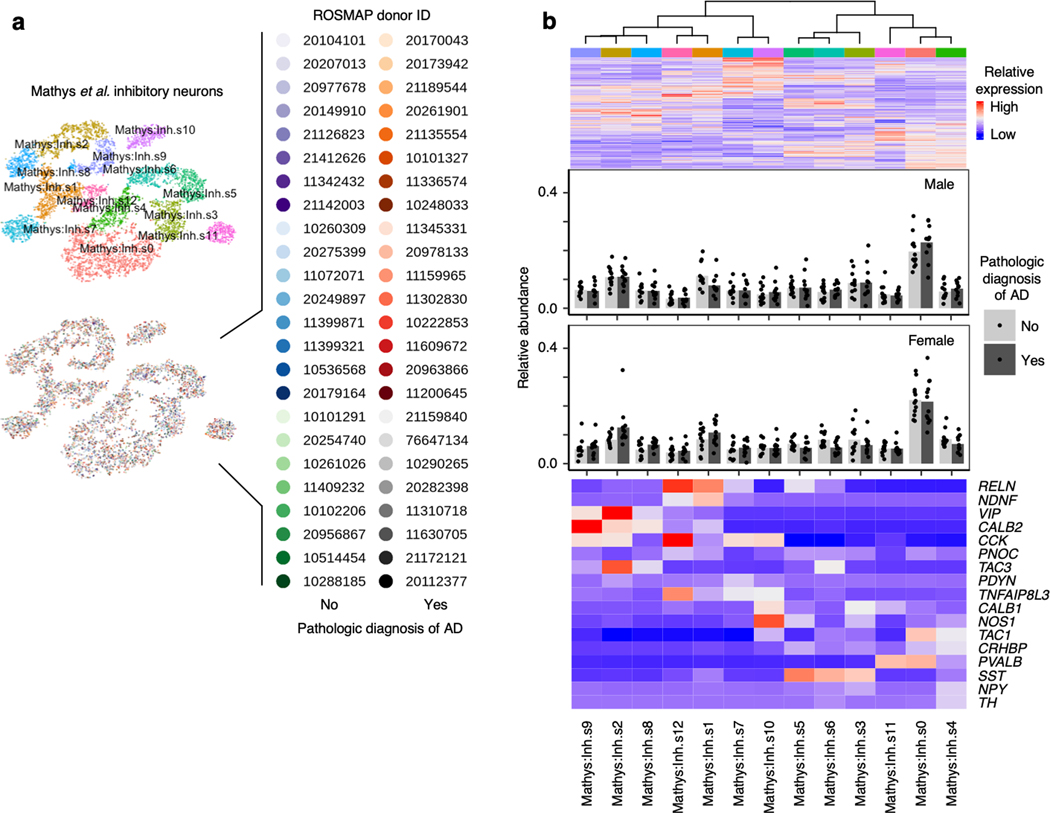
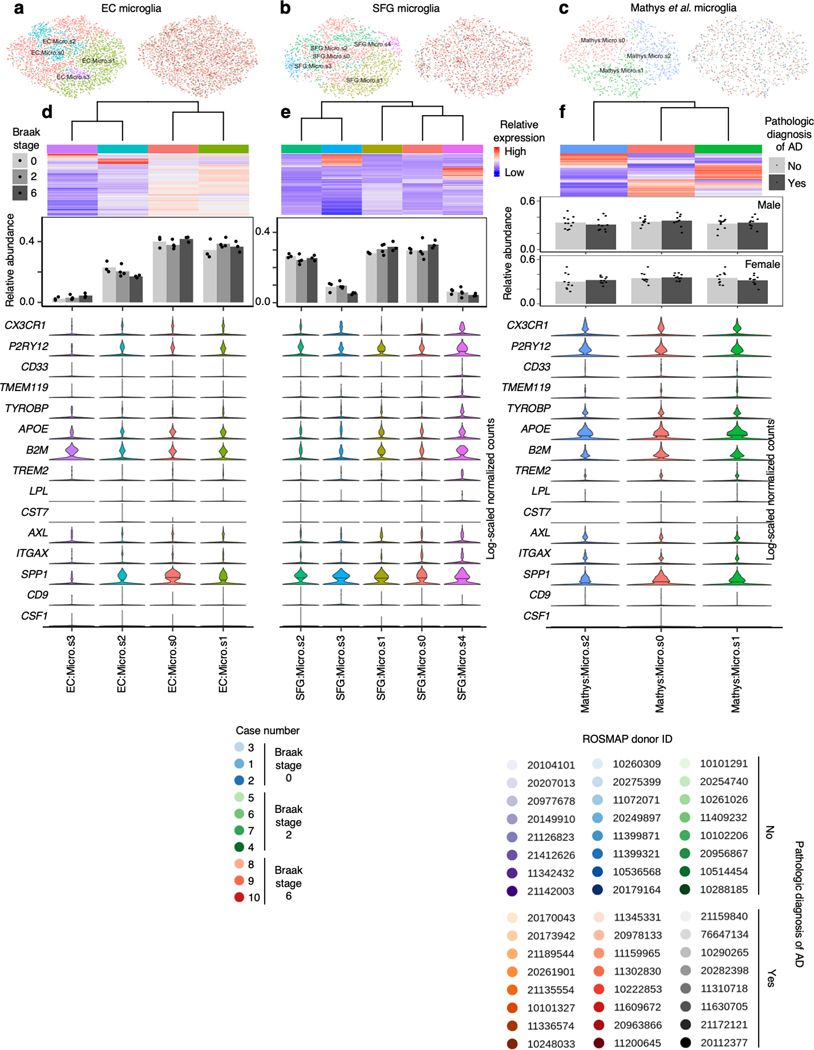
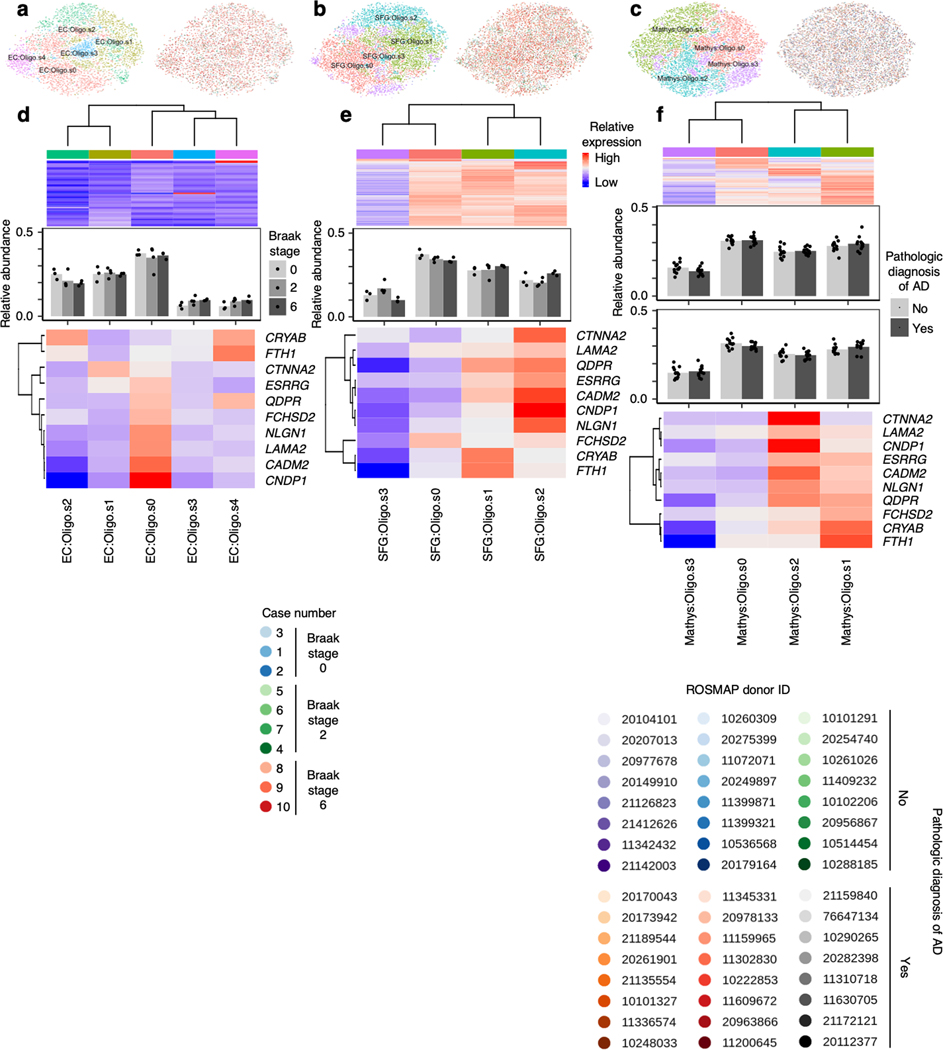
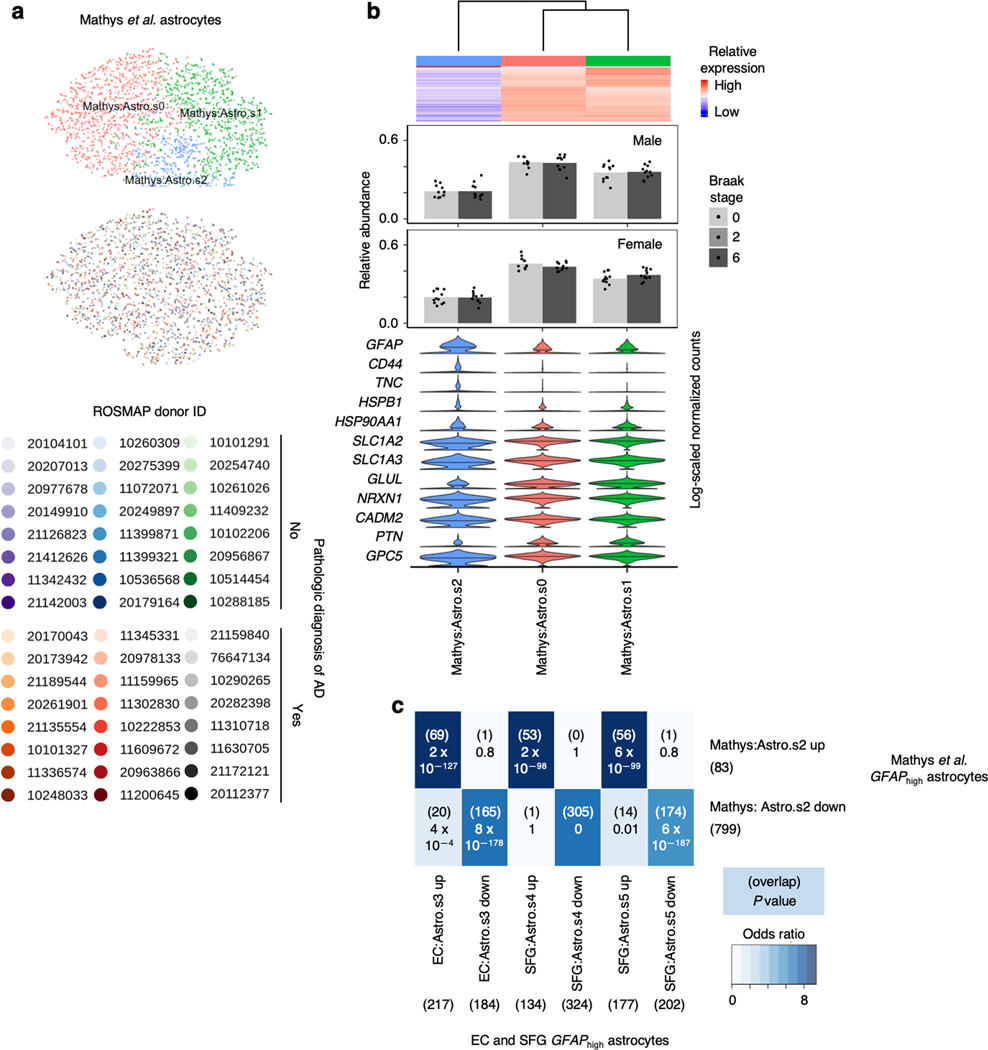
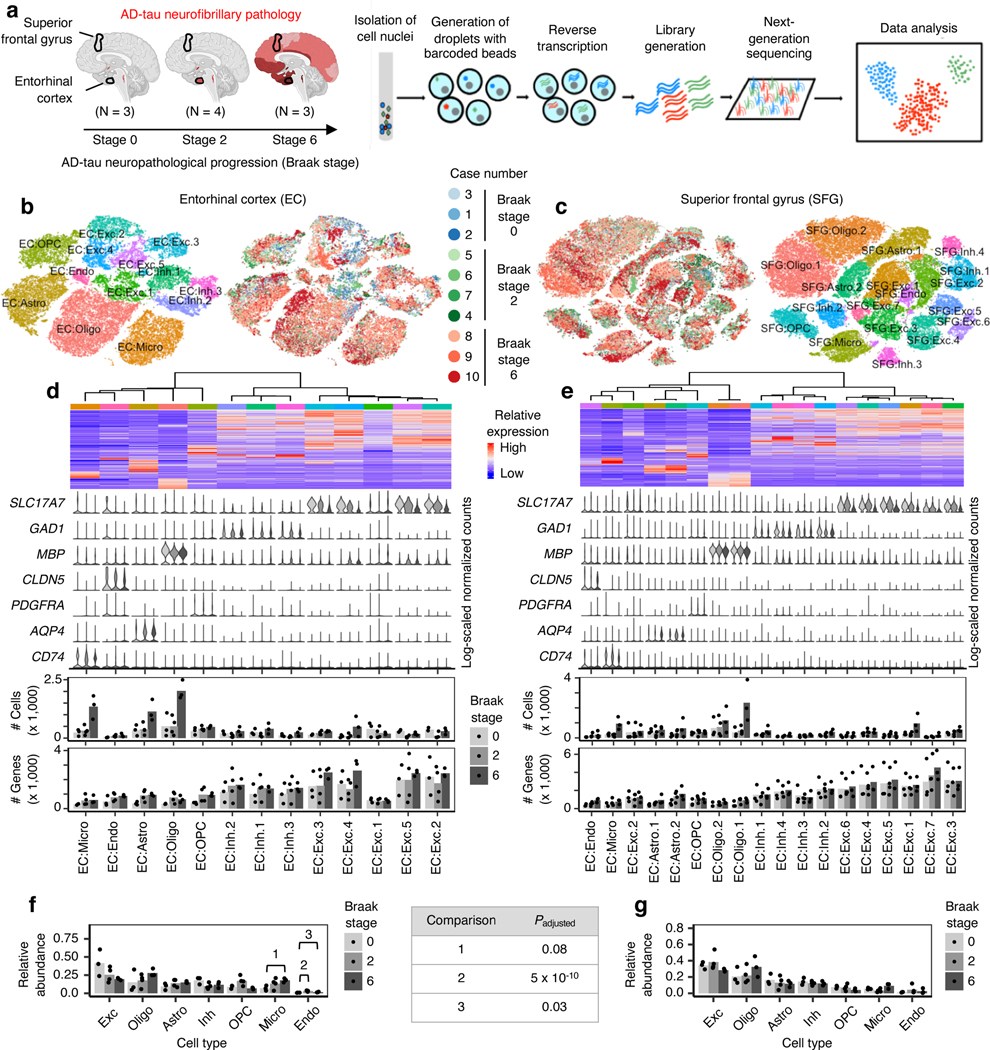
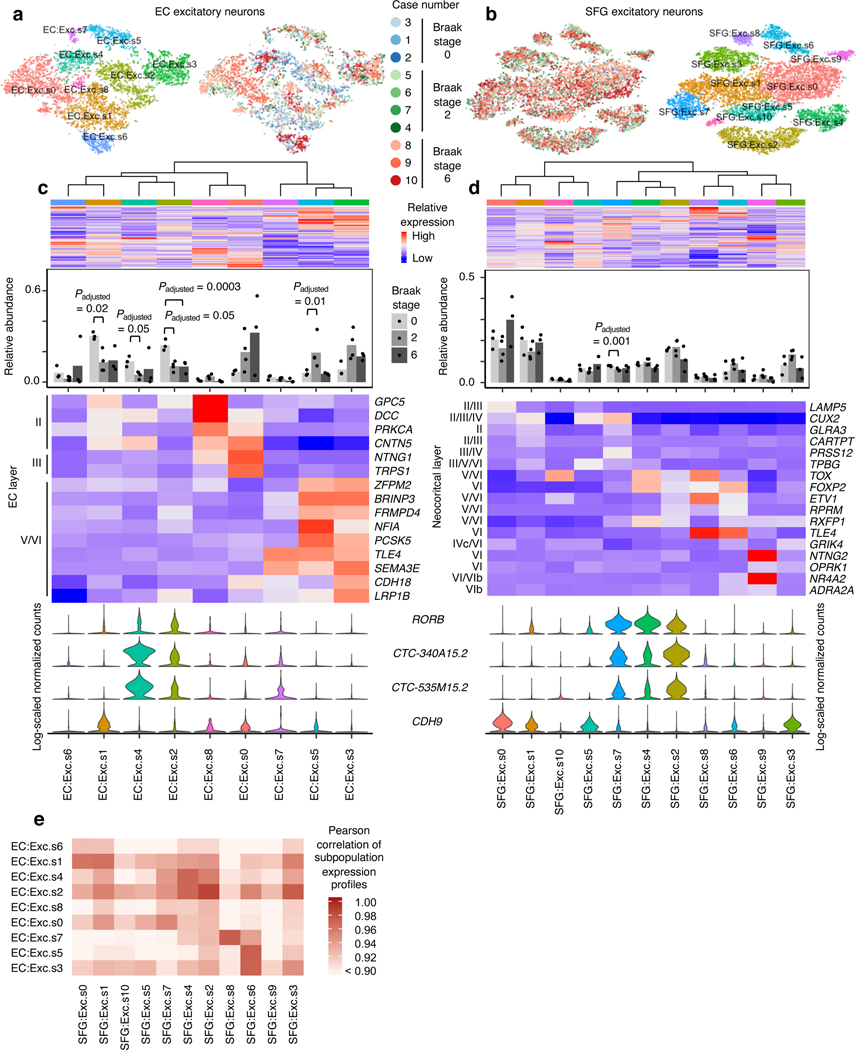
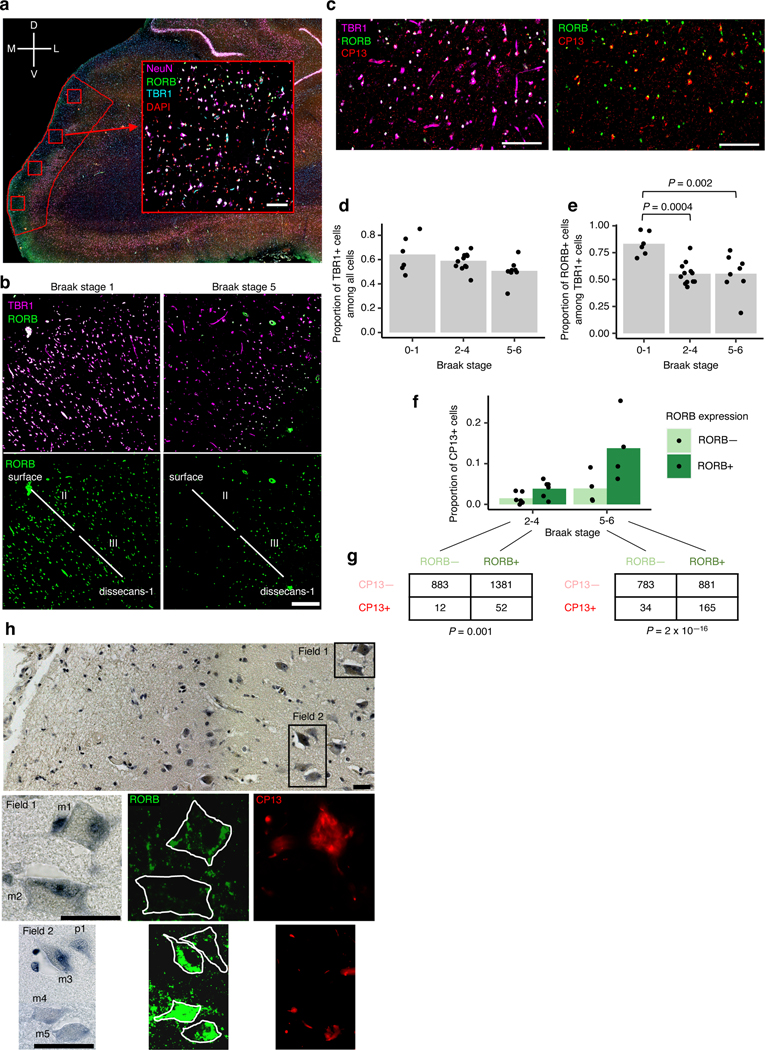
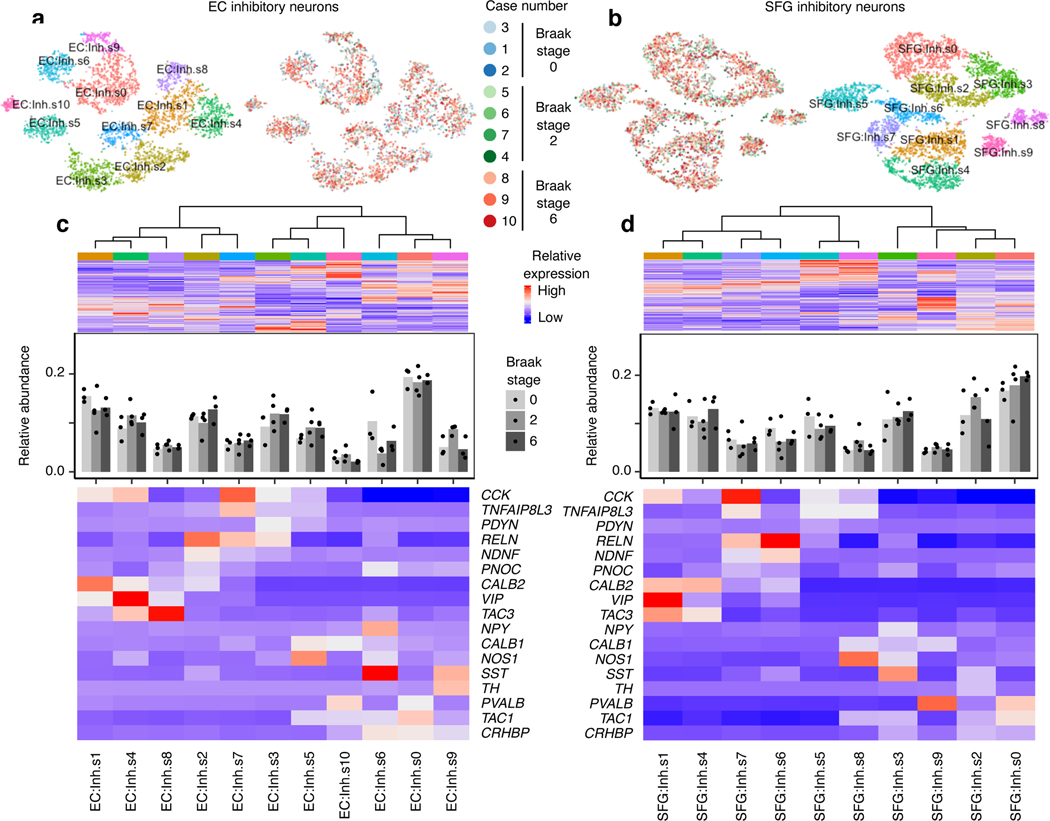
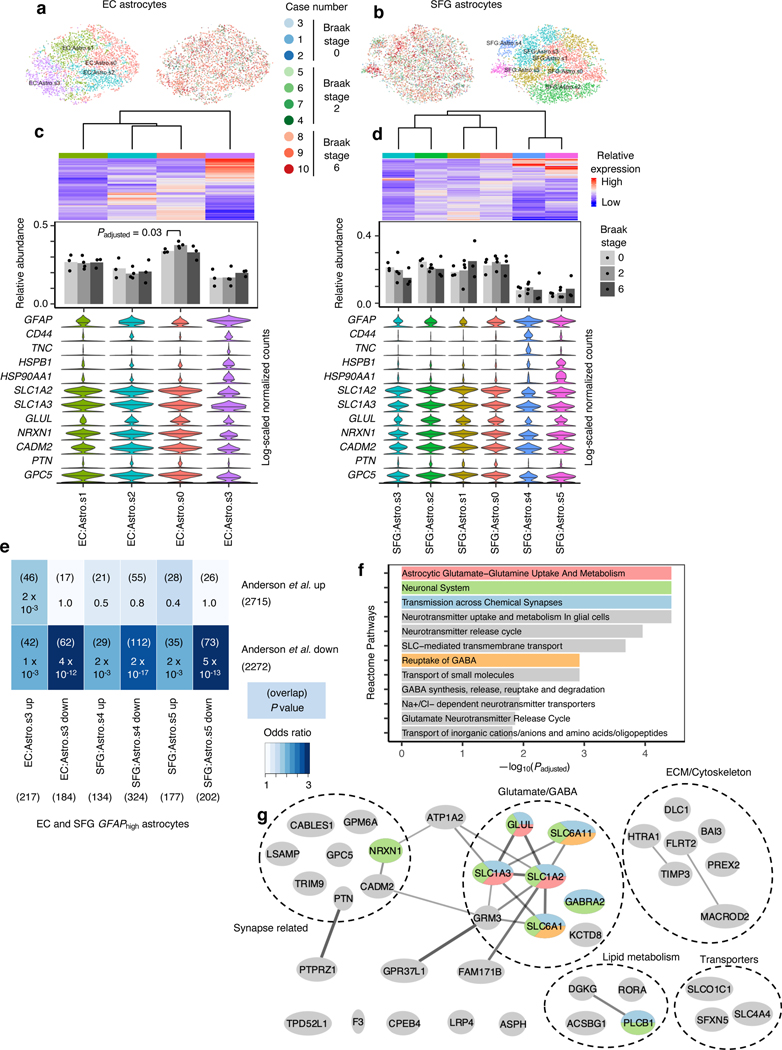
Alzheimer's disease (AD) is characterized by the selective vulnerability of specific neuronal populations, the molecular signatures of which are largely unknown. To identify and characterize selectively vulnerable neuronal populations, we used single-nucleus RNA sequencing to profile the caudal entorhinal cortex and the superior frontal gyrus-brain regions where neurofibrillary inclusions and neuronal loss occur early and late in AD, respectively-from postmortem brains spanning the progression of AD-type tau neurofibrillary pathology. We identified RORB as a marker of selectively vulnerable excitatory neurons in the entorhinal cortex and subsequently validated their depletion and selective susceptibility to neurofibrillary inclusions during disease progression using quantitative neuropathological methods. We also discovered an astrocyte subpopulation, likely representing reactive astrocytes, characterized by decreased expression of genes involved in homeostatic functions. Our characterization of selectively vulnerable neurons in AD paves the way for future mechanistic studies of selective vulnerability and potential therapeutic strategies for enhancing neuronal resilience.


Figures

Extended Data Fig. 1
Extended Data Fig. 1. Data quality and initial clustering without cross-sample alignment
a-b, Mean number of genes (a) or UMIs (b) detected per cell across individual samples for major cell types identified in each dataset. Grubman et al. did not resolve excitatory neurons from inhibitory neurons. Pericytes were identified only in Mathys et al. Cell type abbreviations: Exc – excitatory neurons, Oligo – oligodendrocytes, Astro – astrocytes, Inh – inhibitory neurons, OPC – oligodendrocyte precursor cells, Micro – microglia, Endo – endothelial cells, Per – pericytes. c-d, tSNE projection of cells from the EC (c) and SFG (d) clustered without first performing cross-sample alignment, colored by individual of origin (center) or cluster assignment (outer). e-f, Heatmap and hierarchical clustering of clusters and cluster marker expression (top subpanels); “High” and “Low” relative expression reflect above- and below-average expression, respectively (see Methods). Expression of cell type markers (bottom subpanels).
Extended Data Fig. 2
Extended Data Fig. 2. Expression of selected EC excitatory neuron subpopulation markers and pathway enrichment analysis of differentially expressed genes in selectively vulnerable EC excitatory neuron subpopulations
a, Expression heatmap of genes that are specifically expressed by four or fewer EC excitatory neuron subpopulations; “High” and “Low” relative expression reflect above- and below-average expression, respectively (see Methods). b-d, Enrichment analysis against Gene Ontology Cellular Component terms or Reactome Pathways (b,d) and functional association network analysis (c,e; see Methods) of genes with higher (b-c) or lower expression (d-e) in RORB+ vulnerable EC excitatory neurons, with selected terms highlighted by color. In panels c and e, genes with stronger associations are connected by thicker lines, and genes without known associations are not shown.
Extended Data Fig. 3
Extended Data Fig. 3. Differential expression analysis across Braak stages for EC excitatory neuron subpopulations
a-b, Number of differentially expressed genes in EC excitatory neuron subpopulations with higher (a) or lower (b) expression in Braak stage 6 vs. Braak stage 0. c-f, Enrichment analysis against Gene Ontology Cellular Component terms (c-d) or Reactome Pathways (e-f) of differentially expressed genes in EC excitatory neuron subpopulations with higher (c,e) or lower (d,f) expression in Braak stage 6 vs. Braak stage 0.
Extended Data Fig. 4
Extended Data Fig. 4. Alignment of EC and SFG maps homologous excitatory neuron subpopulations.
a, tSNE projection of excitatory neurons from the EC and SFG in the joint alignment space, colored by subpopulation identity (top), individual of origin (middle), or brain region (bottom). b, Heatmap and hierarchical clustering of subpopulations and subpopulation marker expression (top subpanel); “High” and “Low” relative expression reflect above- and below-average expression, respectively (see Methods). Relative abundance of subpopulations across Braak stages (second and third subpanels); for each brain region, statistical significance of differences in relative abundance across Braak stages (Braak 0 n=3, Braak 2 n=4, Braak 6 n=3, where n is the number of individuals sampled) was determined by beta regression and adjusted for multiple comparisons (see Methods). Expression heatmap of EC layer-specific genes identified from Ramsden et al. (fourth subpanel). Expression heatmap of neocortical layer-specific genes from Lake et al. (fifth subpanel). Expression of selectively vulnerable EC excitatory neuron subpopulation markers by excitatory neurons in the EC (sixth subpanel) or SFG (bottom subpanel). Significant beta regression P values (adjusted for multiple testing) are shown in a table at the bottom of the panel. c, Sankey diagram connecting subpopulation identity of excitatory neurons in the EC alignment space and the SFG alignment space to subpopulation identity in the EC+SFG alignment space. The links connecting EC:Exc.s2 and EC:Exc.s4 to SFG:Exc.s2 and SFG:Exc.s4, respectively, are highlighted.
Extended Data Fig. 5
Extended Data Fig. 5. Cross-sample alignment of excitatory neurons from Mathys et al. recapitulates selective vulnerability in a RORB-expressing subpopulation
a, tSNE projection of excitatory neurons from Mathys et al. in the alignment space, colored by subpopulation identity (top) or individual of origin (bottom). b, Heatmap and hierarchical clustering of subpopulations and subpopulation marker expression (top subpanel); “High” and “Low” relative expression reflect above- and below-average expression, respectively (see Methods). Relative abundance of subpopulations in in AD cases vs. controls, separated by sex (second and third subpanels); for each sex, statistical significance of differences in relative abundance between AD cases vs. controls (cases n=12, controls n=12, where n is the number of individuals sampled) was determined by beta regression and adjusted for multiple comparisons (see Methods). Expression heatmap of neocortical layer-specific genes from Lake et al. (fourth subpanel). Expression of selectively vulnerable EC excitatory neuron subpopulation markers (bottom subpanel). c, Heatmap of Pearson correlation between the gene expression profiles of excitatory neuron subpopulations from the EC vs. those from the prefrontal cortex in Mathys et al.
Extended Data Fig. 6
Extended Data Fig. 6. Delineation of the EC for each case used in immunofluorescence validation
a, The borders of the caudal EC delineated on sections stained with hematoxylin and eosin (H&E) for all 26 cases used in immunofluorescence validation (Table 1). b, Borders of the EC were determined with the aid of 400 um thick serial coronal sections of whole-brain hemispheres stained with gallocyanin (see Methods). Each H&E section (left) along with its corresponding immunofluorescence image (middle) was aligned to the most approximate gallocyanin section (right), in which the the dissecans layers (diss-1, diss-2, and diss-ext) characteristic of the caudal EC were easier to visualize. This was then used to guide delineation of the EC on the H&E and immunofluorescence sections. For more details on the cytoarchitectonic definitions used to define the caudal EC, please consult Heinsen et al..
Extended Data Fig. 7
Extended Data Fig. 7. Inhibitory neurons from Mathys et al. also do not show differences in resilience or vulnerability to AD
a, tSNE projection of inhibitory neurons from Mathys et al. in the alignment space, colored by subpopulation identity (top) or individual of origin (bottom). b, Heatmap and hierarchical clustering of subpopulations and subpopulation markers (top subpanel); “High” and “Low” relative expression reflect above- and below-average expression, respectively (see Methods). Relative abundance of subpopulations in in AD cases vs. controls, separated by sex (second and third subpanels); for each sex, statistical significance of differences in relative abundance between AD cases vs. controls (cases n=12, controls n=12, where n is the number of individuals sampled) was determined by beta regression and adjusted for multiple comparisons (see Methods). Expression heatmap of inhibitory neuron subtype markers from Lake et al. (bottom subpanel).
Extended Data Fig. 8
Extended Data Fig. 8. Subclustering of microglia does not sufficiently resolve disease associated microglia signature
a-c, tSNE projection of astrocytes from the EC (a), SFG (b), and Mathys et al. (c) in their respective alignment spaces, colored by subpopulation identity (left) or individual of origin (right). d-f, Heatmap and hierarchical clustering of subpopulations and subpopulation marker expression (top subpanels); “High” and “Low” relative expression reflect above- and below-average expression, respectively (see Methods). Relative abundance of subpopulations (middle subpanels) across Braak stages in the EC and SFG (for each brain region, Braak 0 n=3, Braak 2 n=4, Braak 6 n=3, where n is the number of individuals sampled) or between AD cases vs. controls in Mathys et al. (for each sex, cases n =12, controls n = 12, where n is the number of individuals sampled); statistical significance of differences in relative abundance was determined by beta regression and adjusted for multiple comparisons (see Methods). Expression of disease associated microglia markers, with median expression level marked by line (bottom subpanels).
Extended Data Fig. 9
Extended Data Fig. 9. Subclustering of oligodendrocytes identifies subpopulations with higher expression of AD-associated oligodendrocyte markers from Mathys et al.
a-c, tSNE projection of oligodendrocytes from the EC (a), SFG (b), and Mathys et al. (c) in their respective alignment spaces, colored by subpopulation identity (left) or individual of origin (right). d-f, Heatmap and hierarchical clustering of subpopulations and subpopulation marker expression (top subpanels); “High” and “Low” relative expression reflect above- and below-average expression, respectively (see Methods). Relative abundance of subpopulations (middle subpanels) across Braak stages in the EC and SFG (for each brain region, Braak 0 n=3, Braak 2 n=4, Braak 6 n=3, where n is the number of individuals sampled) or between AD cases vs. controls in Mathys et al. (for each sex, cases n =12, controls n = 12, where n is the number of individuals sampled); statistical significance of differences in relative abundance was determined by beta regression and adjusted for multiple comparisons (see Methods). Relative expression of AD-associated oligodendrocyte subpopulation markers from Mathys et al. (bottom subpanels).
Extended Data Fig. 10
Extended Data Fig. 10. Astrocyte subpopulations with high GFAP expression from Mathys et al. are highly similar to those from the EC and SFG
a, tSNE projection of astrocytes from Mathys et al. in the alignment subspace, colored by subpopulation identity (top) or individual of origin (bottom). b, Heatmap and hierarchical clustering of subpopulations and subpopulation marker expression (top subpanel); “High” and “Low” relative expression reflect above- and below-average expression, respectively (see Methods). Relative abundance of subpopulations in in AD cases vs. controls, separated by sex (middle subpanels); for each sex, statistical significance of differences in relative abundance between AD cases vs. controls (cases n=12, controls n=12, where n is the number of individuals sampled) was determined by beta regression and adjusted for multiple comparisons (see Methods). Expression of genes associated with reactive astrocytes, with median expression level marked by line (bottom subpanel). c, Enrichment analysis of overlap between differentially expressed genes in astrocytes with high GFAP expression from Mathys et al. vs. differentially expressed genes in astrocytes with high GFAP expression from the EC and SFG; the number of genes in each gene set and the number of overlapping genes are shown in parentheses, and the hypergeometric test p-values are shown without parentheses.
Fig. 1 |
Fig. 1 |. AD progression differentially affects the cell-type composition of the EC and SFG.
a, Schematic of experimental design and sample processing. Darker shades of red in brain cartoons reflect more severe AD-tau neurofibrillary pathology. b-c, tSNE projection of cells from the EC (b) and SFG (c) in their respective alignment spaces, colored by individual of origin (center) or cluster assignment (outer). d-e, Heatmap and hierarchical clustering of clusters and cluster marker expression (top subpanel); “High” and “Low” relative expression reflect above- and below-average expression, respectively (see Methods). Expression of cell type markers in each cluster (second subpanel). The average number of cells and average number of genes detected per cell in each cluster (third and fourth subpanels). f-g, Relative abundance of major cell types across Braak stages. For each brain region, statistical significance of differences in relative abundance across Braak stages (Braak 0 n=3, Braak 2 n=4, Braak 6 n=3, where n is the number of individuals sampled) was determined by beta regression and adjusted for multiple comparisons (see Methods). Cell type abbreviations: Exc – excitatory neurons, Oligo – oligodendrocytes, Astro – astrocytes, Inh – inhibitory neurons, OPC – oligodendrocyte precursor cells, Micro – microglia, Endo – endothelial cells.
Fig. 2 |
Fig. 2 |. RORB-expressing excitatory neuron subpopulations in the EC are selectively vulnerable.
a-b, tSNE projection of excitatory neurons from the EC (a) and SFG (b) in their respective alignment spaces, colored by individual of origin (center) or subpopulation identity (outer). c-d, Heatmap and hierarchical clustering of subpopulations and subpopulation marker expression (top subpanel); “High” and “Low” relative expression reflect above- and below-average expression, respectively (see Methods). Relative abundance of subpopulations across Braak stages (second subpanel); for each brain region, statistical significance of differences in relative abundance across Braak stages (Braak 0 n=3, Braak 2 n=4, Braak 6 n=3, where n is the number of individuals sampled) was determined by beta regression and adjusted for multiple comparisons (see Methods). Expression heatmap of EC layer-specific genes identified from Ramsden et al. (c, third subpanel). Expression heatmap of neocortical layer-specific genes from Lake et al. (d, third subpanel). Expression of selectively vulnerable subpopulation markers identified in the EC (bottom subpanel). e, Heatmap of Pearson correlation between the gene expression profiles of EC and SFG subpopulations.
Fig. 3 |
Fig. 3 |. Immunofluorescence of the EC validates selective vulnerability of RORB-expressing excitatory neurons.
a, The method for extracting regions of interest (ROI) is illustrated using a representative brain slice used for immunofluorescence (pseudo-colored: DAPI in blue, RORB in green, TBR1 In orange and NeuN in pink) with the EC delineated in red. Four ROIs (drawn in red squares) were randomly distributed along the superficial layers of the EC and extracted for quantification after masking neurons (see Methods). A representative ROI image is shown as insert (note that the pseudo-coloring scheme for the insert, as indicated in the Figure, differs from the pseudo-coloring scheme of the larger panel). The anatomical orientation of the slice is provided in the top left corner (D – dorsal, V – ventral, M – medial, L – lateral). b, Representative RORB staining in a Braak stage 1 sample (left) vs. a Braak stage 5 sample (right), shown with (top) and without (bottom) excitatory neurons marked by TBR1 staining. The EC layers captured in the image are demarcated in the bottom subpanels (see Methods and Extended Data Fig. 6). c, Representative CP13 staining in a Braak stage 6 sample, shown together with TBR1 and RORB staining (left) or only with RORB staining (right). d-e, Proportion of TBR1+ cells among all cells (d) or proportion of RORB+ cells among TBR1+ cells (e) averaged across ROIs for each individual across groups of Braak stages; statistical significance of differences in the above proportions across groups of Braak stages (Braak 0–1 n=6, Braak 2–4 n=12, Braak 5–6 n=8, where n is the number of individuals sampled) was determined by beta regression without adjustment for multiple comparisons. f, Proportion of CP13+ cells in RORB- or RORB+ excitatory neurons (i.e. TBR1+ cells) averaged across ROIs for each individual across groups of Braak stages. g, Contingency tables of raw counts of TBR1+ cells based on their RORB or CP13 staining status summed across ROIs and individuals for each group of Braak stages (Braak 2–4 n=6, Braak 5–6 n=4, where n is the number of individuals sampled); the Fisher’s Exact Test p-value (two-sided) is shown below each table. h, Representative image of EC layer II neurons stained with gallocyanin (top subpanel) with the corresponding RORB and CP13 immunofluorescence signal shown in selected fields (Field 1 – middle subpanels, Field 2 – bottom subpanels). RORB+ neurons include both large multipolar neurons (m1, m3, m4, m5) and pyramidal neurons (p1). One large multipolar neuron (m2) is RORB-. The neuronal somas are outlined manually in white in the RORB immunofluorescence images to aid interpretation. Scale bars shown in a-c correspond to 100 microns; scale bars shown in h correspond to 15 microns. For all data shown in this figure, the experiment was performed once.
Fig. 4 |
Fig. 4 |. Inhibitory neuron subpopulations do not consistently show differences in resilience or vulnerability to AD progression.
a-b, tSNE projection of inhibitory neurons from the EC (a) and SFG (b) in their respective alignment spaces, colored by individual of origin (center) or subpopulation identity (outer). c-d, Heatmap and hierarchical clustering of subpopulations and subpopulation marker expression (top subpanel); “High” and “Low” relative expression reflect above- and below-average expression, respectively (see Methods). Relative abundance of subpopulations across Braak stages (middle subpanel); for each brain region, statistical significance of differences in relative abundance across Braak stages (Braak 0 n=3, Braak 2 n=4, Braak 6 n=3, where n is the number of individuals sampled) was determined by beta regression and adjusted for multiple comparisons (see Methods). Expression heatmap of inhibitory neuron molecular subtype markers from Lake et al. (bottom subpanel).
Fig. 5 |
Fig. 5 |. GFAPhigh astrocytes show signs of dysfunction in glutamate homeostasis and synaptic support.
a-b, tSNE projection of astrocytes from the EC (a) and SFG (b) in their respective alignment spaces, colored by individual of origin (center) or subpopulation identity (outer). c-d, Heatmap and hierarchical clustering of subpopulations and subpopulation marker expression (top subpanel); “High” and “Low” relative expression reflect above- and below-average expression, respectively (see Methods). ). Relative abundance of subpopulations across Braak stages (middle subpanel); for each brain region, statistical significance of differences in relative abundance across Braak stages (Braak 0 n=3, Braak 2 n=4, Braak 6 n=3, where n is the number of individuals sampled) was determined by beta regression and adjusted for multiple comparisons (see Methods). Expression of genes associated with reactive astrocytes, with median expression level marked by line (bottom subpanel). e, Enrichment analysis of overlap between differentially expressed genes in GFAPhigh astrocytes vs. differentially expressed genes in reactive astrocytes from Anderson et al. The number of genes in each gene set and the number of overlapping genes are shown in parentheses, and the hypergeometric test p-values (one-sided, corrected for multiple testing using the Benjamini-Hochberg procedure) are shown without parentheses. f, Enrichment of Reactome pathways in downregulated genes in GFAPhigh astrocytes, with selected terms highlighted in color. g, Functional association network (see Methods) of downregulated genes shared between EC and SFG GFAPhigh astrocytes that overlap with those in Anderson et al. Genes with stronger associations are connected by thicker lines. Genes that belong to selected gene sets in f are highlighted in color.

Comment in

References

    1. Braak H & Braak E. Neuropathological stageing of Alzheimer-related changes. Acta Neuropathol 82, 239–259 (1991). - PubMed
    1. Scholl M, et al. PET Imaging of Tau Deposition in the Aging Human Brain. Neuron 89, 971–982 (2016). - PMC - PubMed
    1. Seeley WW, Crawford RK, Zhou J, Miller BL & Greicius MD Neurodegenerative diseases target large-scale human brain networks. Neuron 62, 42–52 (2009). - PMC - PubMed
    1. Braak H & Braak E. Staging of Alzheimer’s disease-related neurofibrillary changes. Neurobiol Aging 16, 271–278; discussion 278–284 (1995). - PubMed
    1. Price JL, et al. Neuron number in the entorhinal cortex and CA1 in preclinical Alzheimer disease. Arch Neurol 58, 1395–1402 (2001). - PubMed

Publication types