. 2021 Feb;24(2):197-203.
doi: 10.1038/s41593-020-00766-5. Epub 2021 Jan 11.

Large mosaic copy number variations confer autism risk

Affiliations

Large mosaic copy number variations confer autism risk

Maxwell A Sherman et al. Nat Neurosci. 2021 Feb.

Abstract

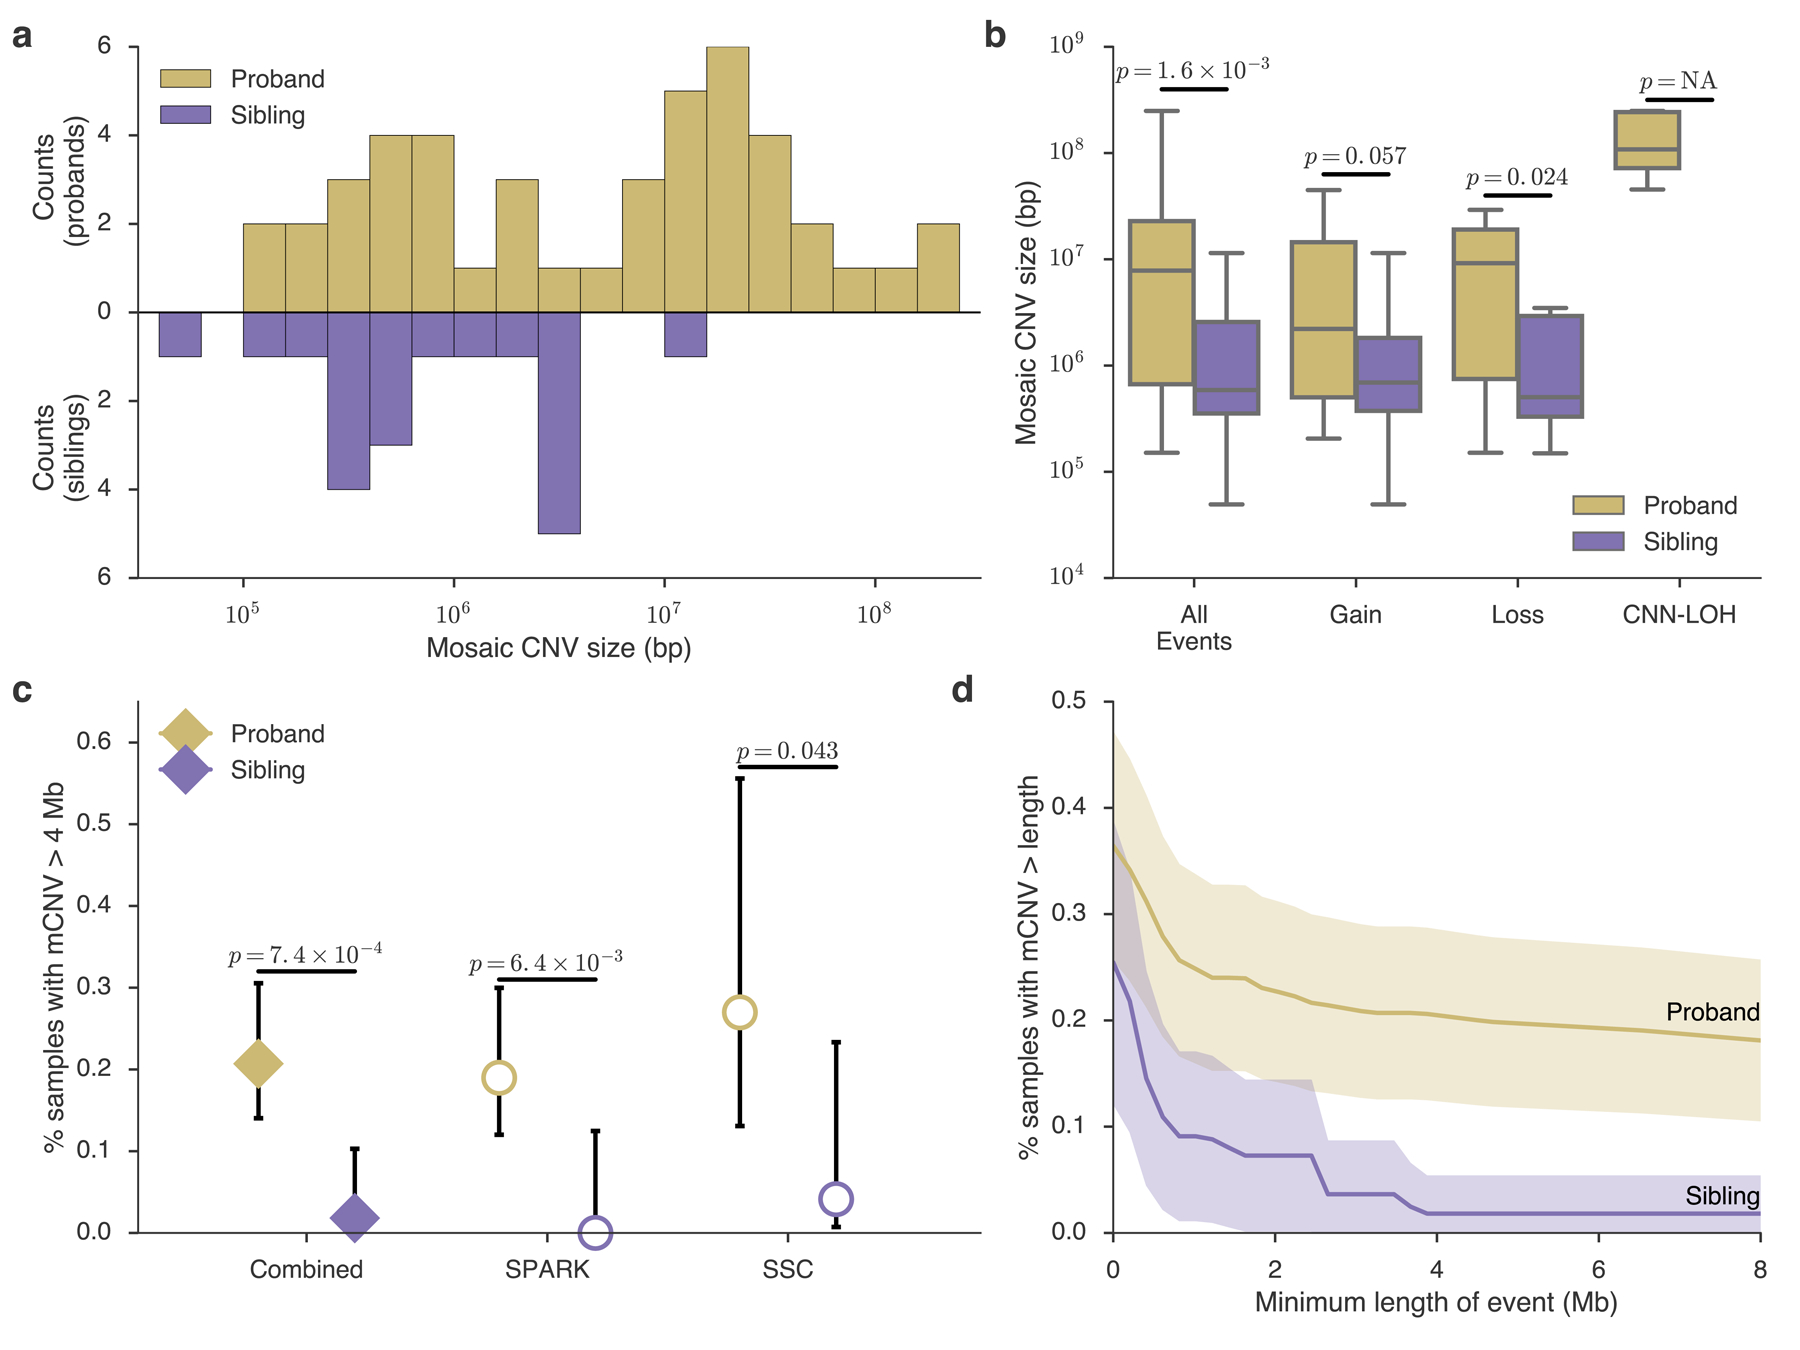
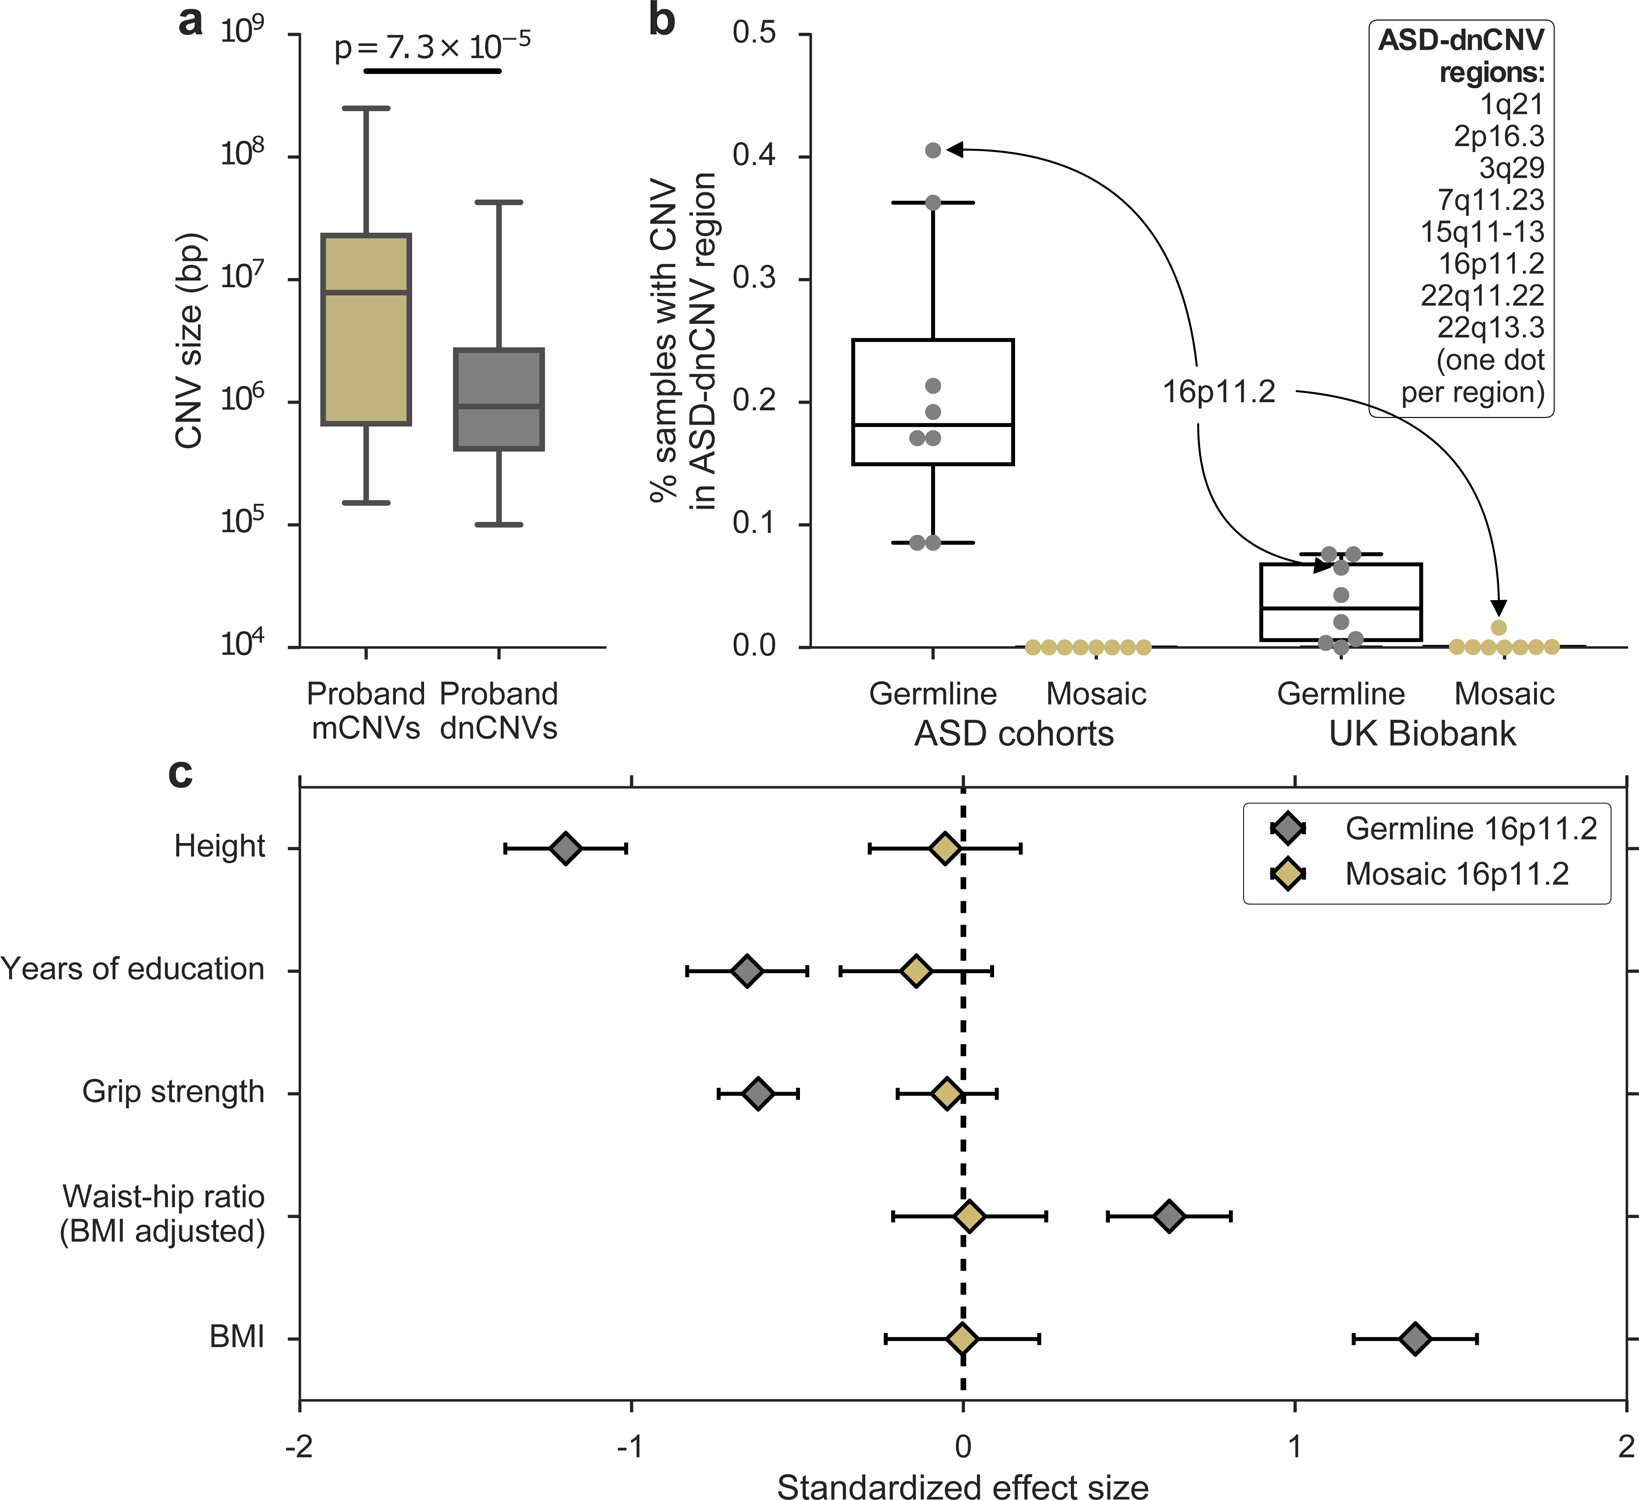
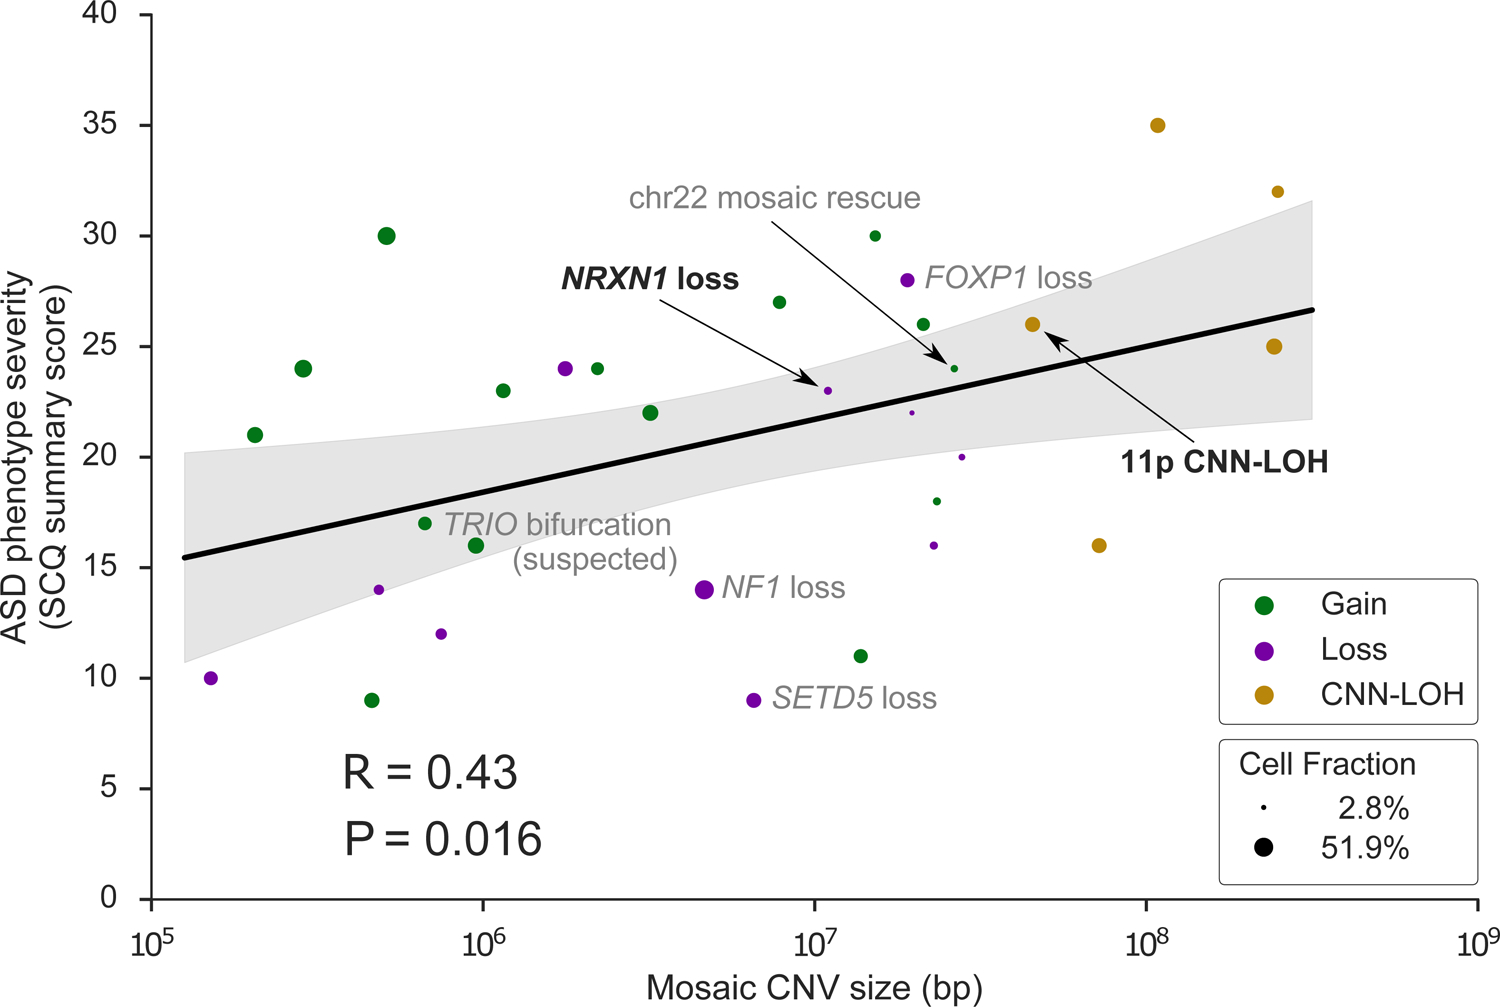
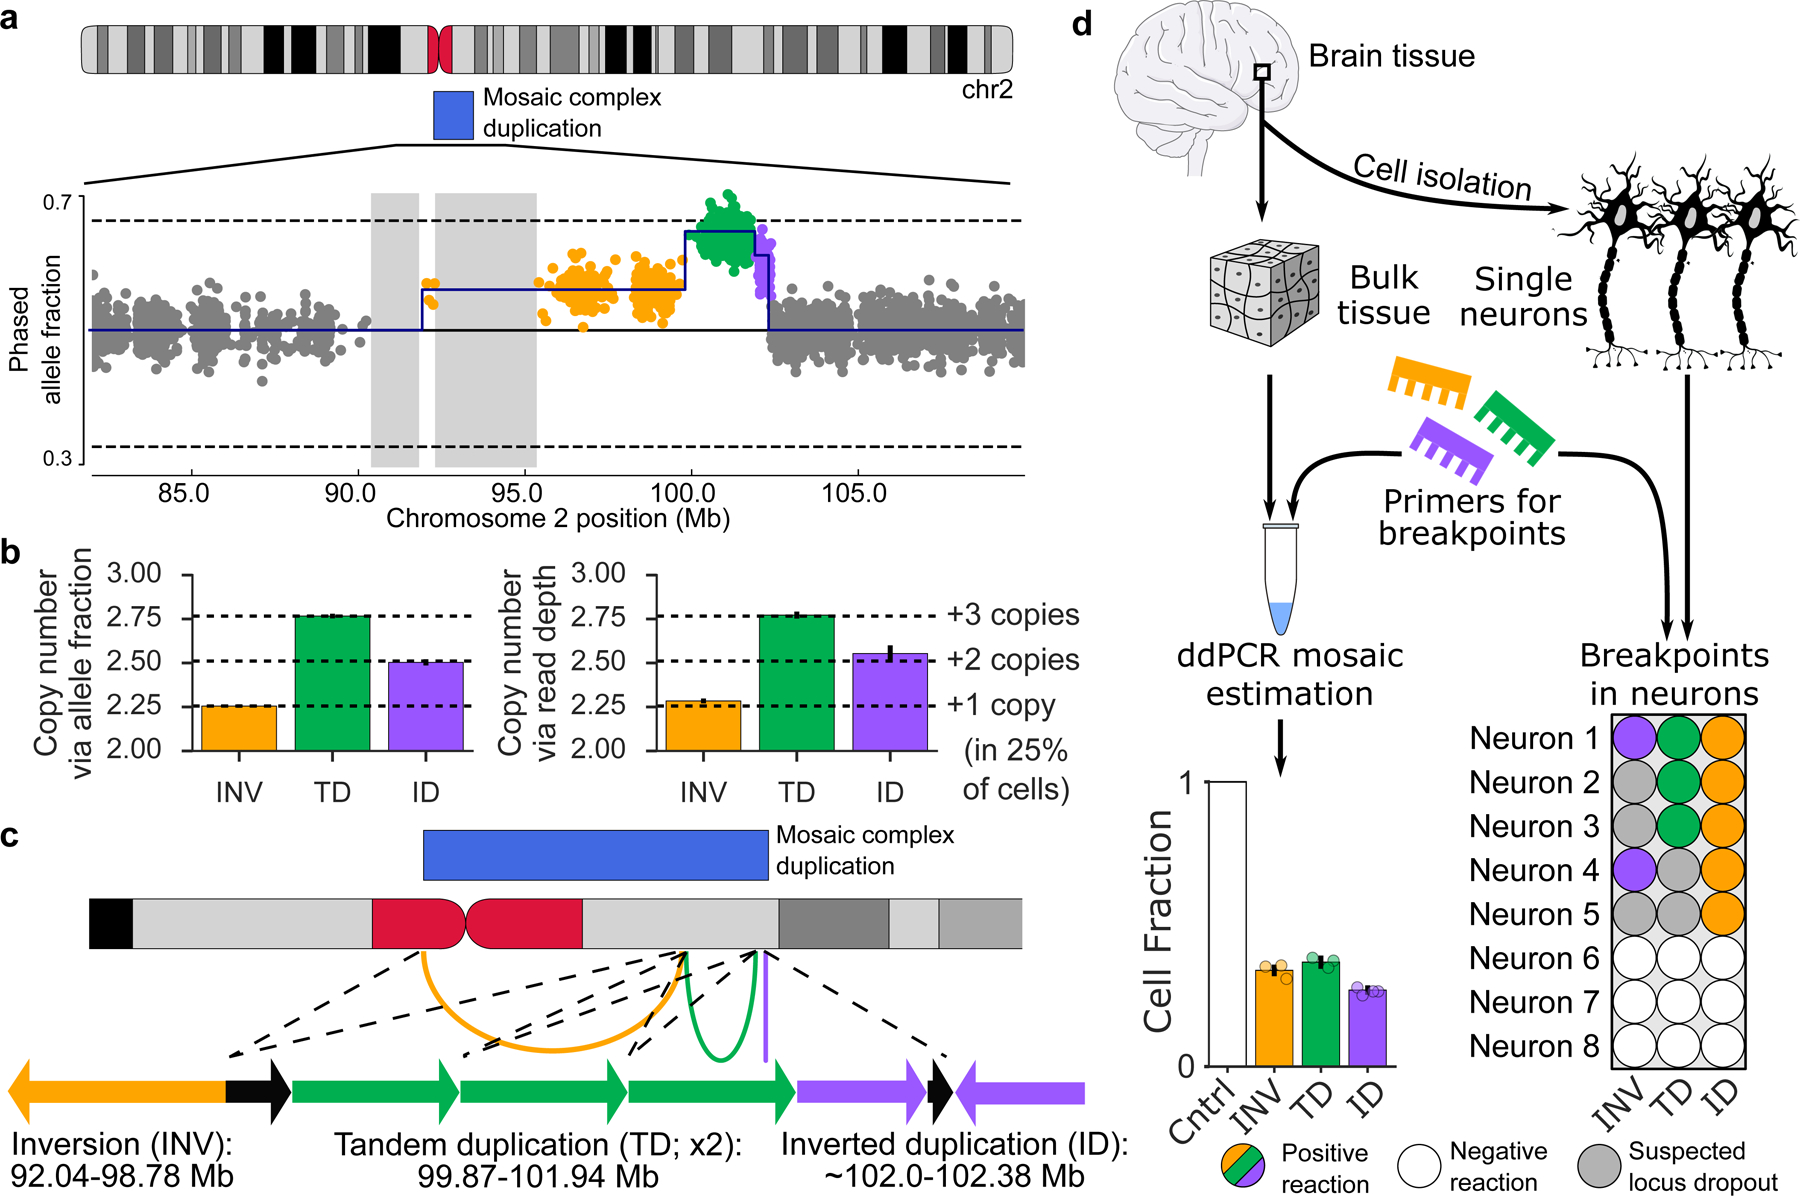
Although germline de novo copy number variants (CNVs) are known causes of autism spectrum disorder (ASD), the contribution of mosaic (early-developmental) copy number variants (mCNVs) has not been explored. In this study, we assessed the contribution of mCNVs to ASD by ascertaining mCNVs in genotype array intensity data from 12,077 probands with ASD and 5,500 unaffected siblings. We detected 46 mCNVs in probands and 19 mCNVs in siblings, affecting 2.8-73.8% of cells. Probands carried a significant burden of large (>4-Mb) mCNVs, which were detected in 25 probands but only one sibling (odds ratio = 11.4, 95% confidence interval = 1.5-84.2, P = 7.4 × 10⁻⁴). Event size positively correlated with severity of ASD symptoms (P = 0.016). Surprisingly, we did not observe mosaic analogues of the short de novo CNVs recurrently observed in ASD (eg, 16p11.2). We further experimentally validated two mCNVs in postmortem brain tissue from 59 additional probands. These results indicate that mCNVs contribute a previously unexplained component of ASD risk.


Conflict of interest statement

Competing interests

The authors declare no competing interests.

Figures

Figure 1:
Figure 1:. ASD probands carry a burden of large mosaic CNVs.
a, Histogram of mosaic CNV sizes in probands (gold) and siblings (purple). b, Box-and-whisker plots of mCNV sizes in probands versus siblings across all events and stratified by copy-number state (Gain, Loss, or CNN-LOH); see Methods for box plot definitions. P-values, one-sided Mann-Whitney U-test. No CNN-LOH events were detected in siblings. c, Percent of probands and siblings carrying a mCNV >4 Mb in size combined across cohorts (filled diamonds) and stratified by cohort (unfilled circles); data presented are rate ± 95% CI (Wilson score interval). d, Percent of probands and siblings carrying a mCNV of length at least L, with L varying from 0–8 Mb; mean (solid lines) ± approximate 95% CI (shaded regions). The burden is robust to the choice of size threshold (Supplementary Figure 11, Supplementary Note 5).
Figure 2:
Figure 2:. Mosaic and germline CNVs have different properties and effects.
a, Sizes of mCNVs compared to sizes of de novo CNVs (dnCNVs) identified by Ref. in SSC probands. De novo CNVs <100 kb in size were removed to account for our limited sensitivity to detect mosaic CNVs <100 kb in size; p-value from one-sided Mann-Whitney U-test. b, Percent of samples carrying a germline or mosaic CNV (gain or loss) in each of eight ASD-dnCNV regions in ASD cohorts (SSC + Autism Genome Project for germline; SSC + SPARK for mosaic) or the UK Biobank. Each marker indicates the percent of carriers of a specific ASD-dnCNV; markers corresponding to 16p11.2 CNVs are indicated with callouts. c, Effects of germline (n = 111) and mosaic (n = 71) 16p11.2 deletions on phenotypes previously associated with 16p11.2 deletions (units, s.d.). Phenotypes were missing for some samples; see Supplementary Table 6 for exact sample sizes for each association. See Methods for box plot definitions.
Figure 3:
Figure 3:. Mosaic CNV size positively correlates with ASD severity.
ASD severity (quantified by the Social Communication Questionnaire (SCQ) summary score) versus mCNV size (n = 31 probands with reported SCQ score). For probands with more than one mCNV, the longest event size is used. Marker color indicates mosaic copy number state; marker size indicates mosaic cell fraction. Events discussed in the main text are labeled with black text; events discussed in Supplementary Notes are labeled with grey text. R, Pearson correlation coefficient. Data are presented as regression mean (solid line) ± 95% CI (shaded region). The association was robust to the scale used for CNV size (Spearman rank correlation Rs = 0.42, P = 0.019).
Figure 4:
Figure 4:. A complex mosaic chromosomal rearrangement present in neurons.
a, Phased allele fraction at heterozygous SNPs on chromosome 2, binned into groups of four adjacent SNPs. SNPs within the mCNV are highlighted, with distinct copy-number states indicated in different colors. Assembly gaps >1 Mb are shaded. b, Estimated mean copy number in each mCNV region as inferred from phased allele fractions (left) and sequencing read depths (right) at heterozygous SNPs; mean ± 95% CI (n INV=876, n TD=1170, n ID=375). Confidence intervals on allele fraction-based estimates are very narrow. c, Inferred structure of a complex duplication consistent with the observed data. Arcs on the ideogram indicate fusions supported by breakpoint analysis. Arrows are a schematic reconstruction of the event (not to scale); each arrow points in the 3’ direction relative to the GRCh37 reference genome. Black arrows indicate genomic regions with a single copy in the proper orientation within the duplicated region. The left breakpoint of the inverted duplication is approximate. d, Experimental validation of the three breakpoints, labeled according to their corresponding segment (inversion, INV; tandem duplication, TD; inverted duplication, ID). Left, fractions of cells containing each breakpoint estimated using digital droplet PCR (ddPCR) on DNA extracted from bulk brain tissue; mean ± approximate 95% CI (# experimental replicates: INV=3, TD=3, ID=4; replicates are shown as individual points). Right, validation of co-occurrence of breakpoints in single neurons. Observation of some but not all breakpoints in some neurons is probably explained by locus dropout, a common feature of single cell whole-genome amplification.

Comment in

References

    1. Gaugler T et al. Most genetic risk for autism resides with common variation. Nature Genetics 46, 881–885 (2014). - PMC - PubMed
    1. De Rubeis S et al. Synaptic, transcriptional and chromatin genes disrupted in autism. Nature 515, 209–215 (2014). - PMC - PubMed
    1. Turner TN et al. Genomic Patterns of De Novo Mutation in Simplex Autism. Cell 171, 710–722.e12 (2017). - PMC - PubMed
    1. Sebat J et al. Strong Association of De Novo Copy Number Mutations with Autism. Science 316, 445–449 (2007). - PMC - PubMed
    1. Sanders SJ et al. Multiple Recurrent De Novo CNVs, Including Duplications of the 7q11.23 Williams Syndrome Region, Are Strongly Associated with Autism. Neuron 70, 863–885 (2011). - PMC - PubMed

References (methods-only)

    1. Feliciano P et al. Exome sequencing of 457 autism families recruited online provides evidence for novel ASD genes. bioRxiv 516625 (2019) 10.1101/516625. - DOI - PMC - PubMed
    1. Diskin SJ et al. Adjustment of genomic waves in signal intensities from whole-genome SNP genotyping platforms. Nucleic Acids Res 36, e126 (2008). - PMC - PubMed
    1. Pedregosa F et al. Scikit-learn: Machine Learning in Python. Journal of Machine Learning Research 12, 2825–2830 (2011).
    1. the Haplotype Reference Consortium et al. A reference panel of 64,976 haplotypes for genotype imputation. Nature Genetics 48, 1279–1283 (2016). - PMC - PubMed
    1. Wang K et al. PennCNV: An integrated hidden Markov model designed for high-resolution copy number variation detection in whole-genome SNP genotyping data. Genome Res 17, 1665–1674 (2007). - PMC - PubMed

Publication types

Grants and funding