. 2021 Feb;24(2):176-185.
doi: 10.1038/s41593-020-00765-6. Epub 2021 Jan 11.

The landscape of somatic mutation in cerebral cortex of autistic and neurotypical individuals revealed by ultra-deep whole-genome sequencing

Collaborators, Affiliations

The landscape of somatic mutation in cerebral cortex of autistic and neurotypical individuals revealed by ultra-deep whole-genome sequencing

Rachel E Rodin et al. Nat Neurosci. 2021 Feb.

Erratum in

Abstract

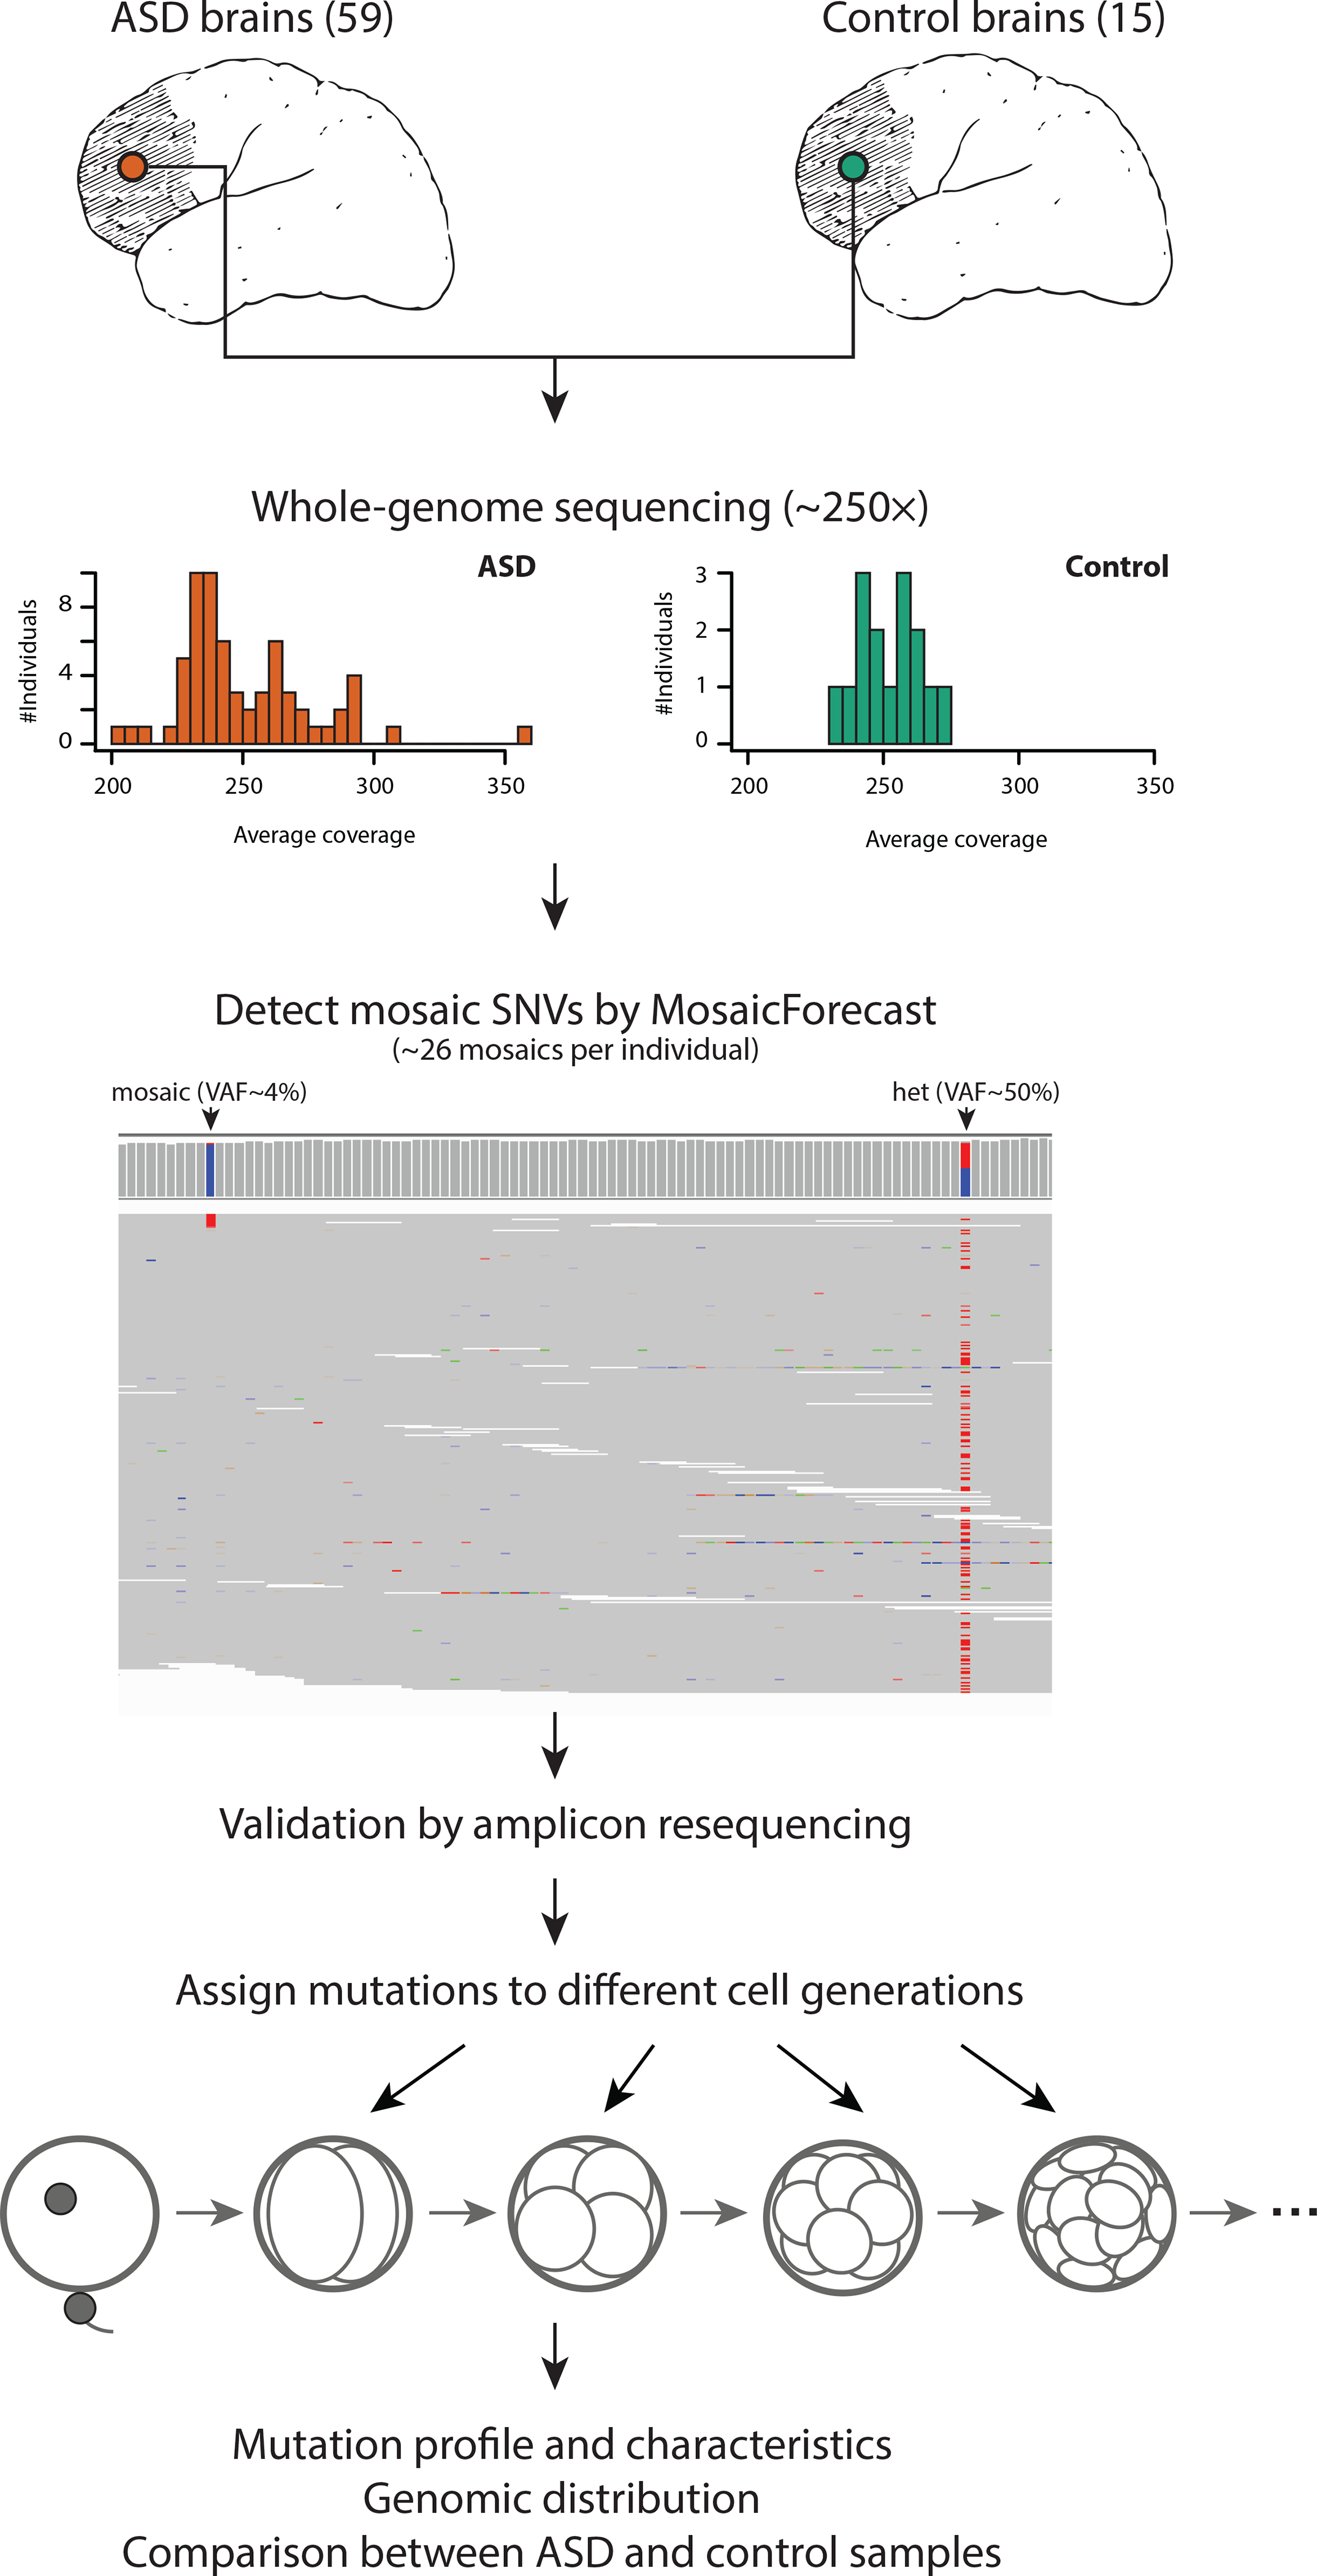
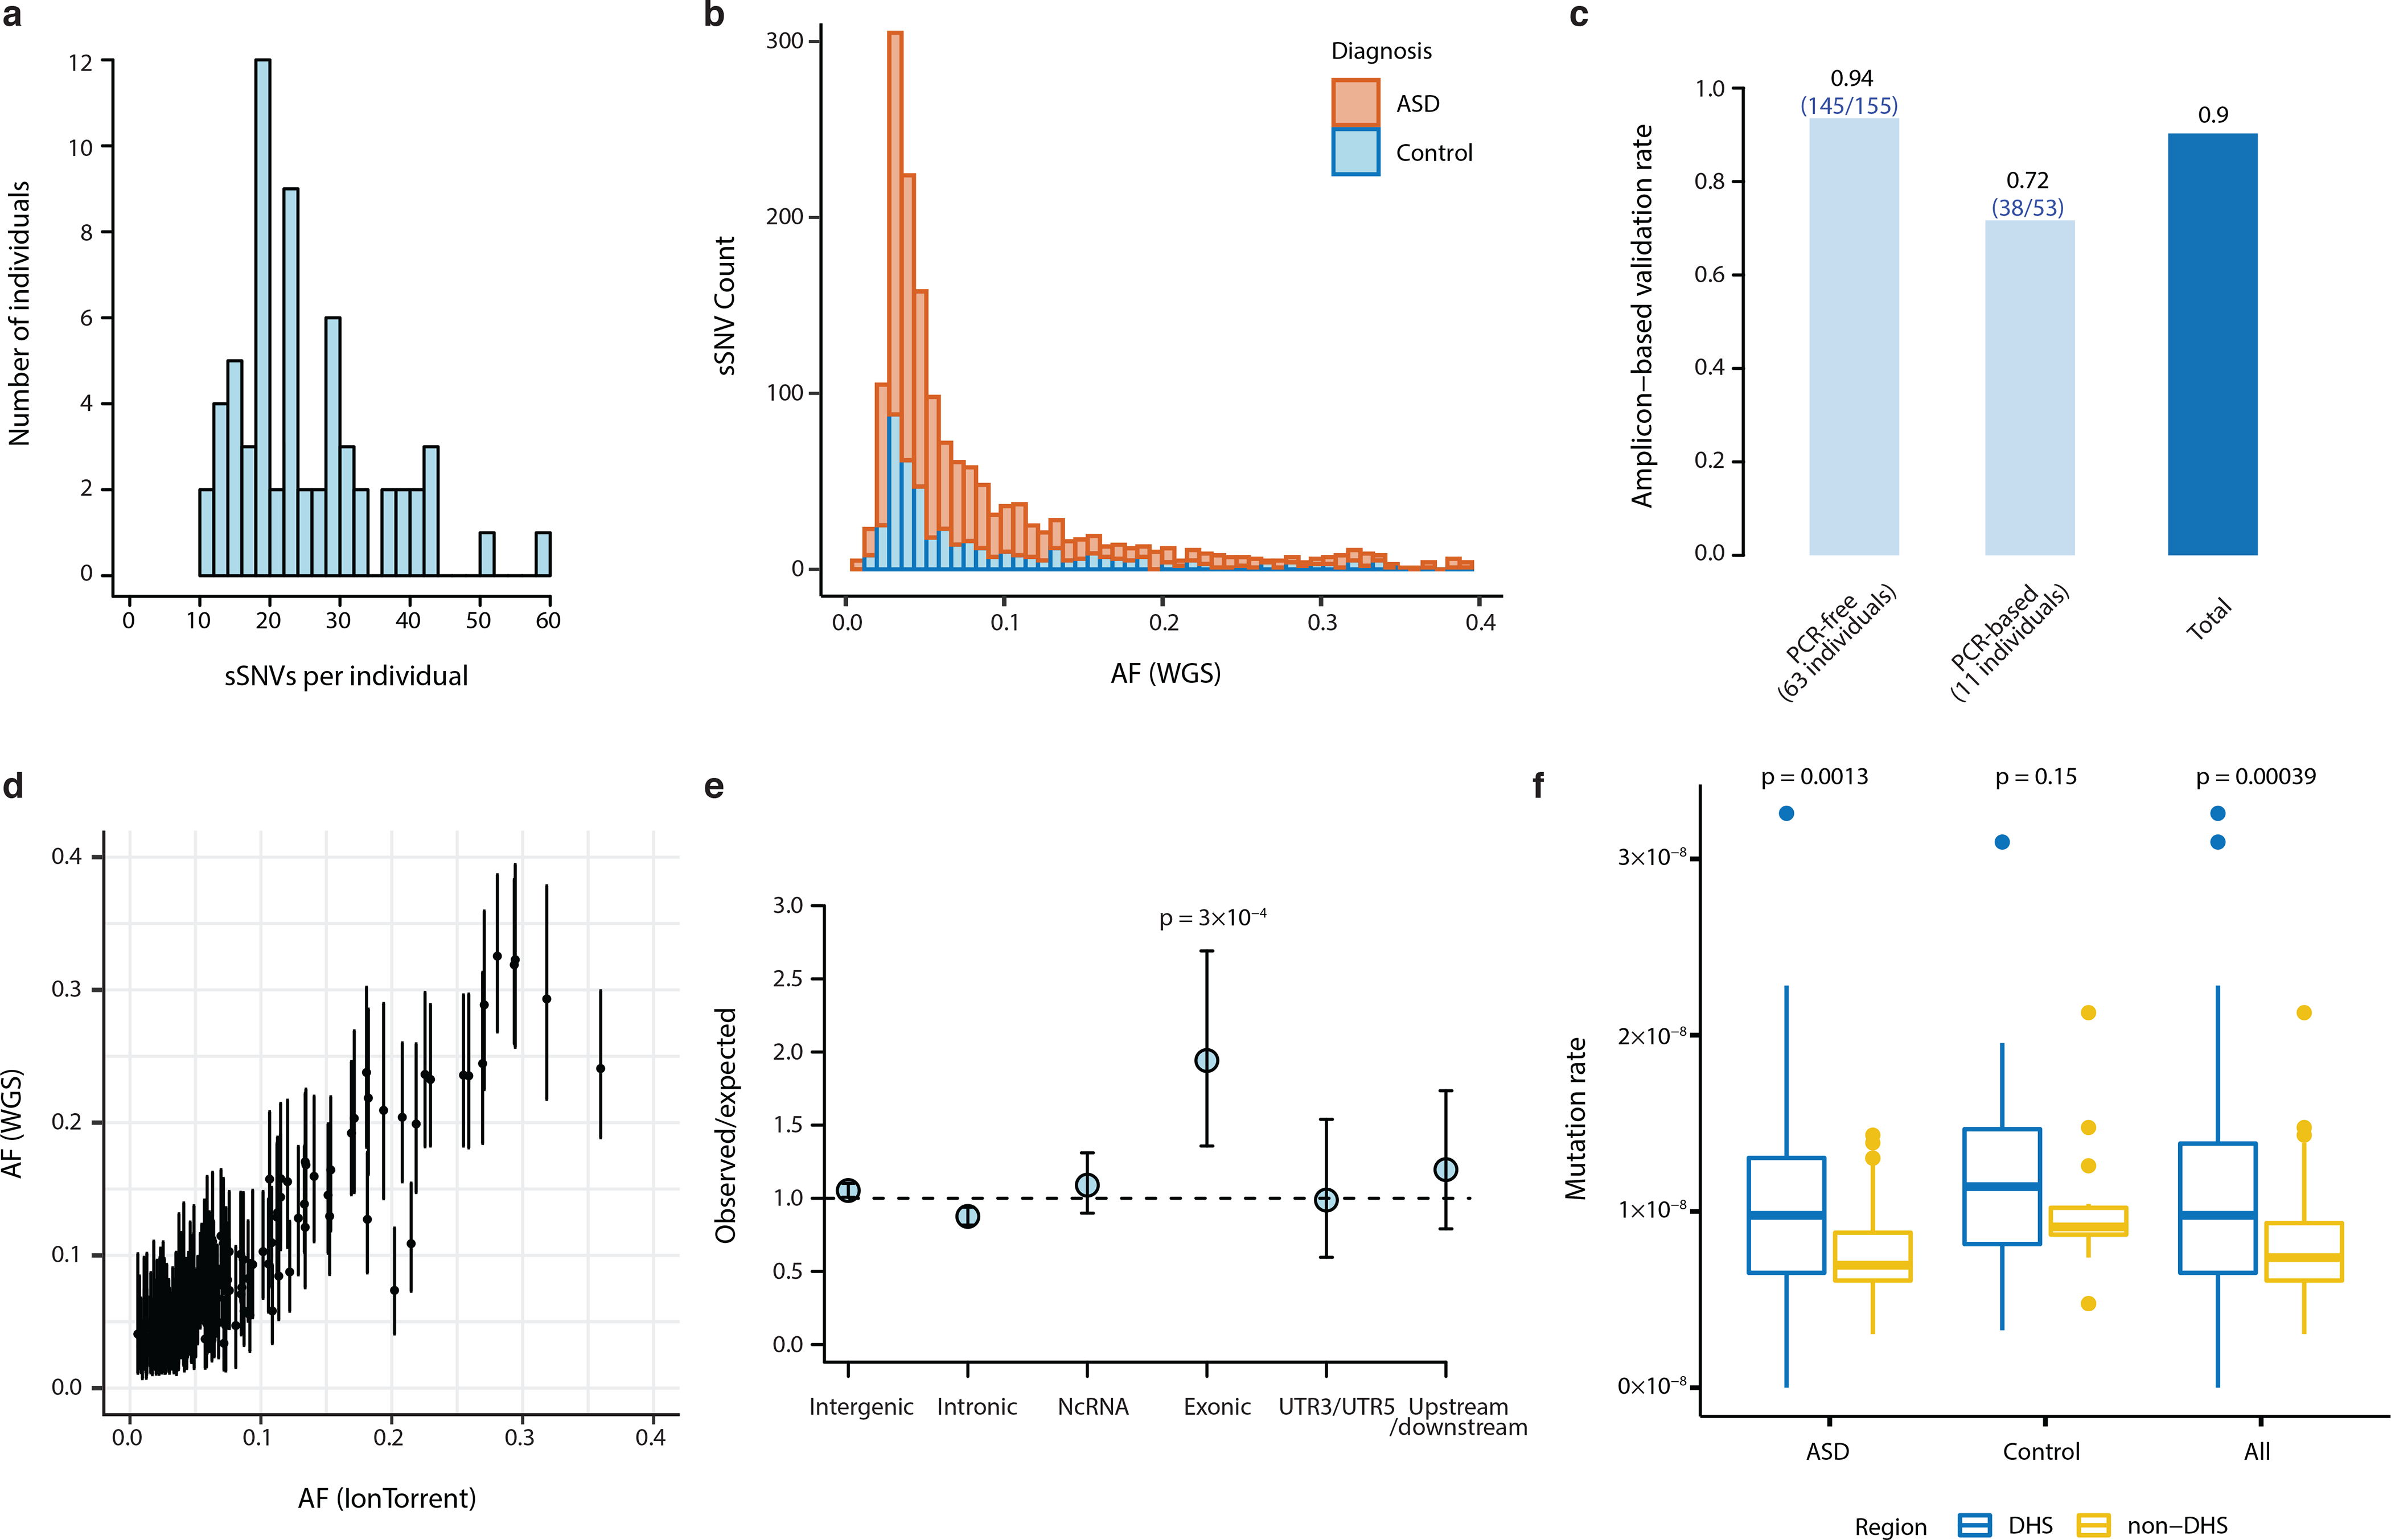
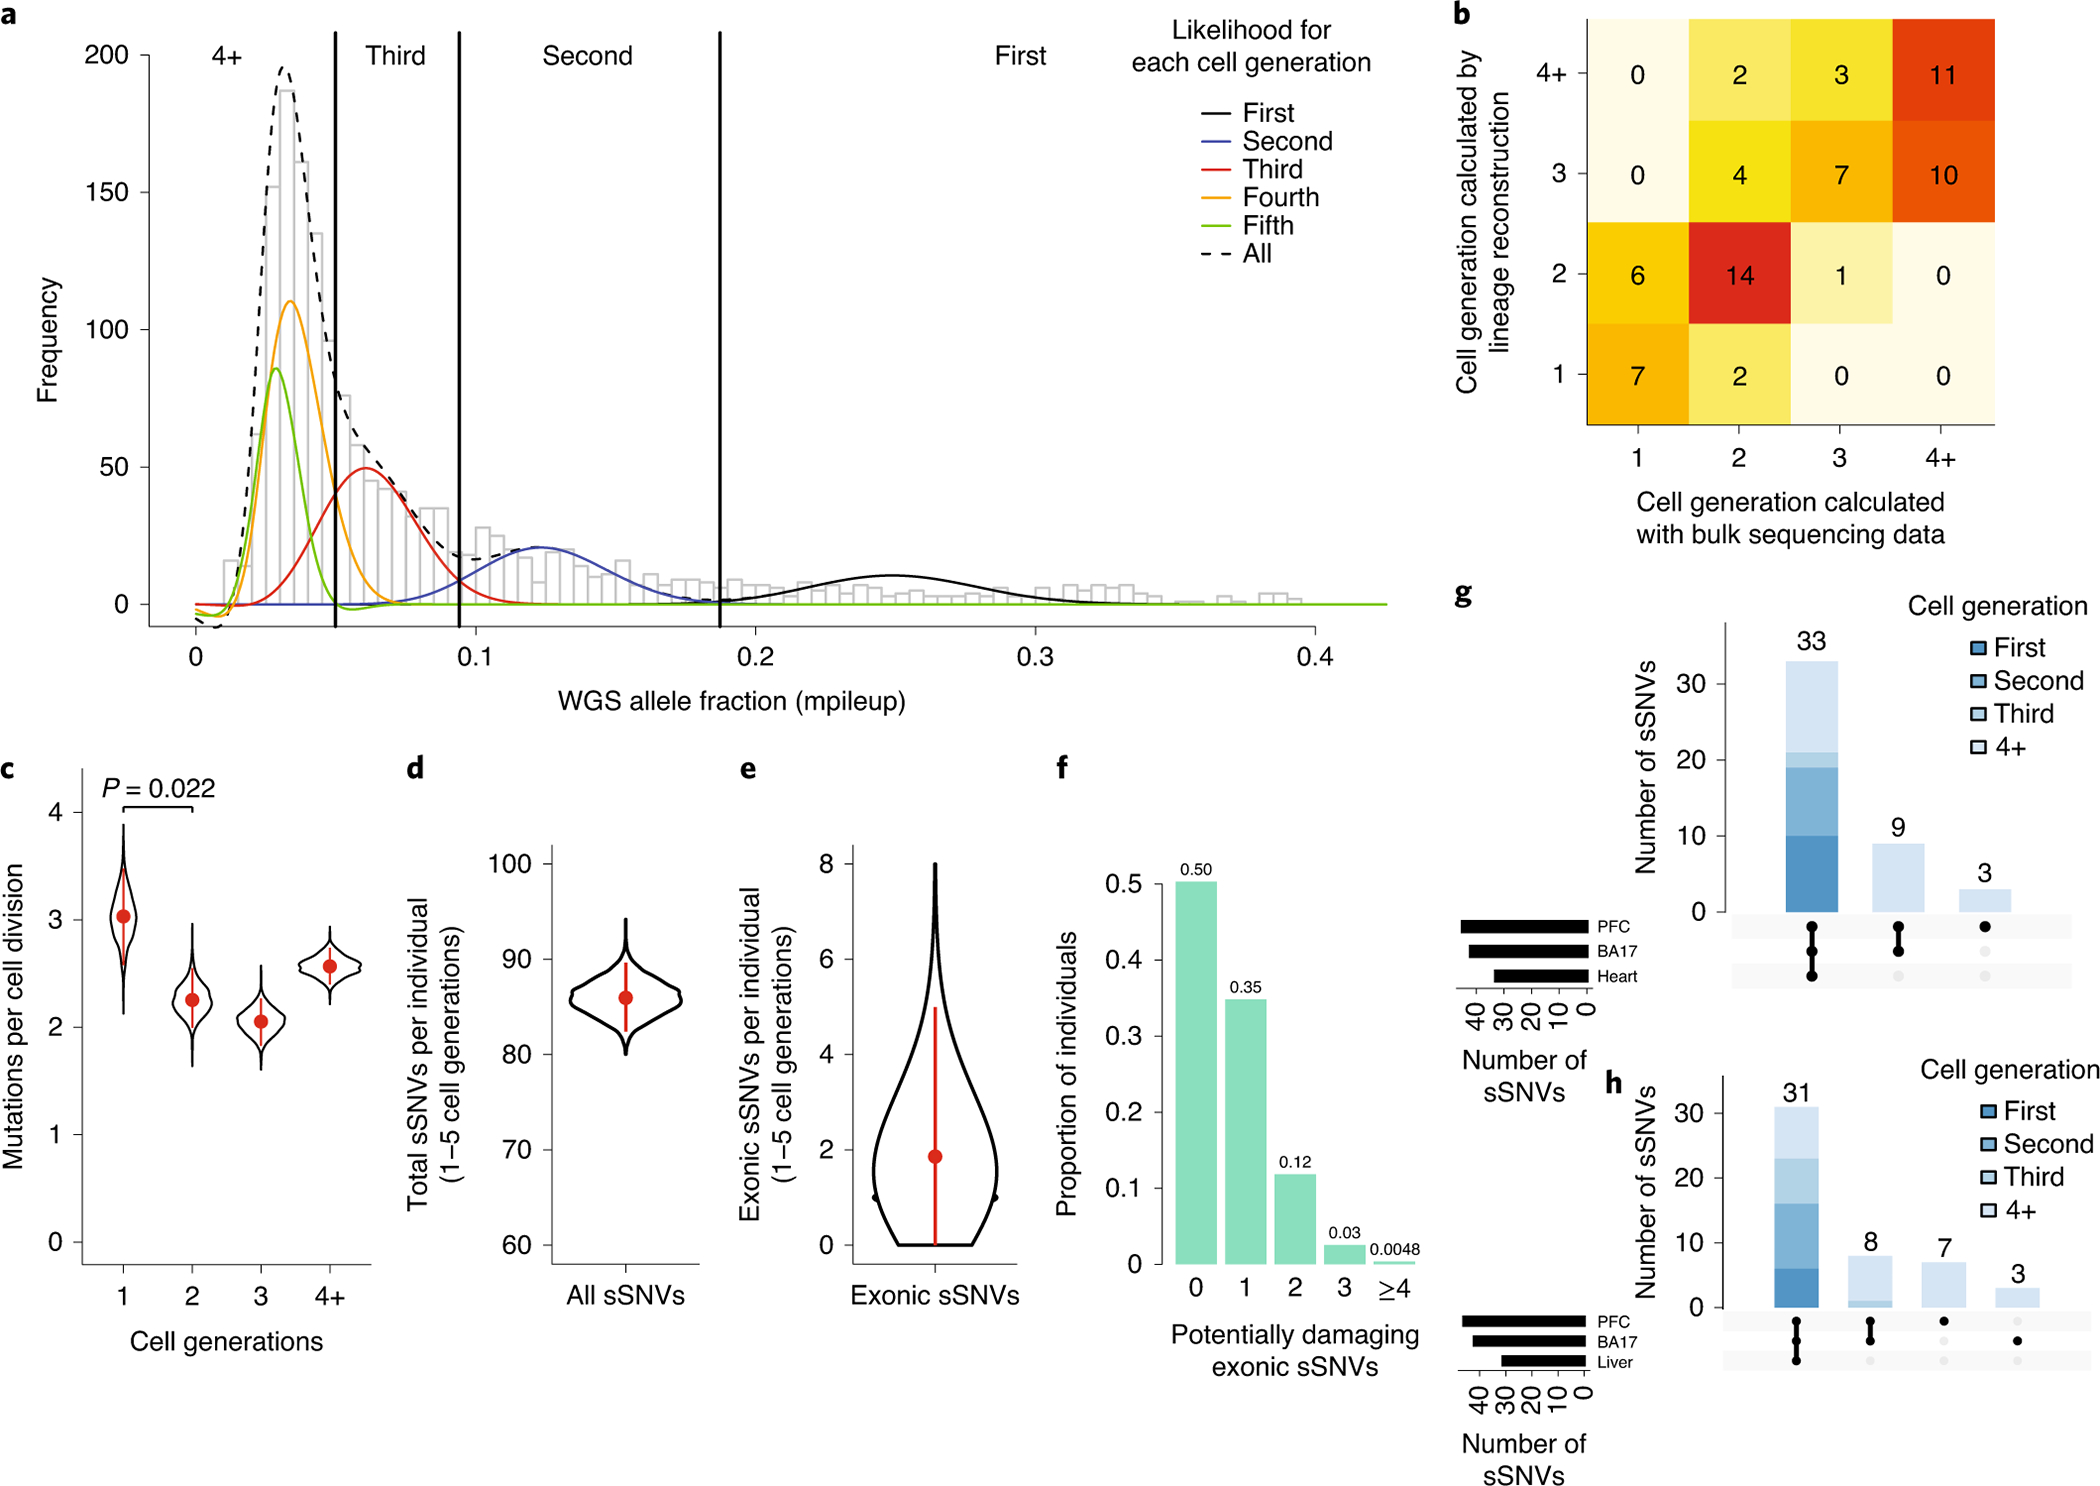
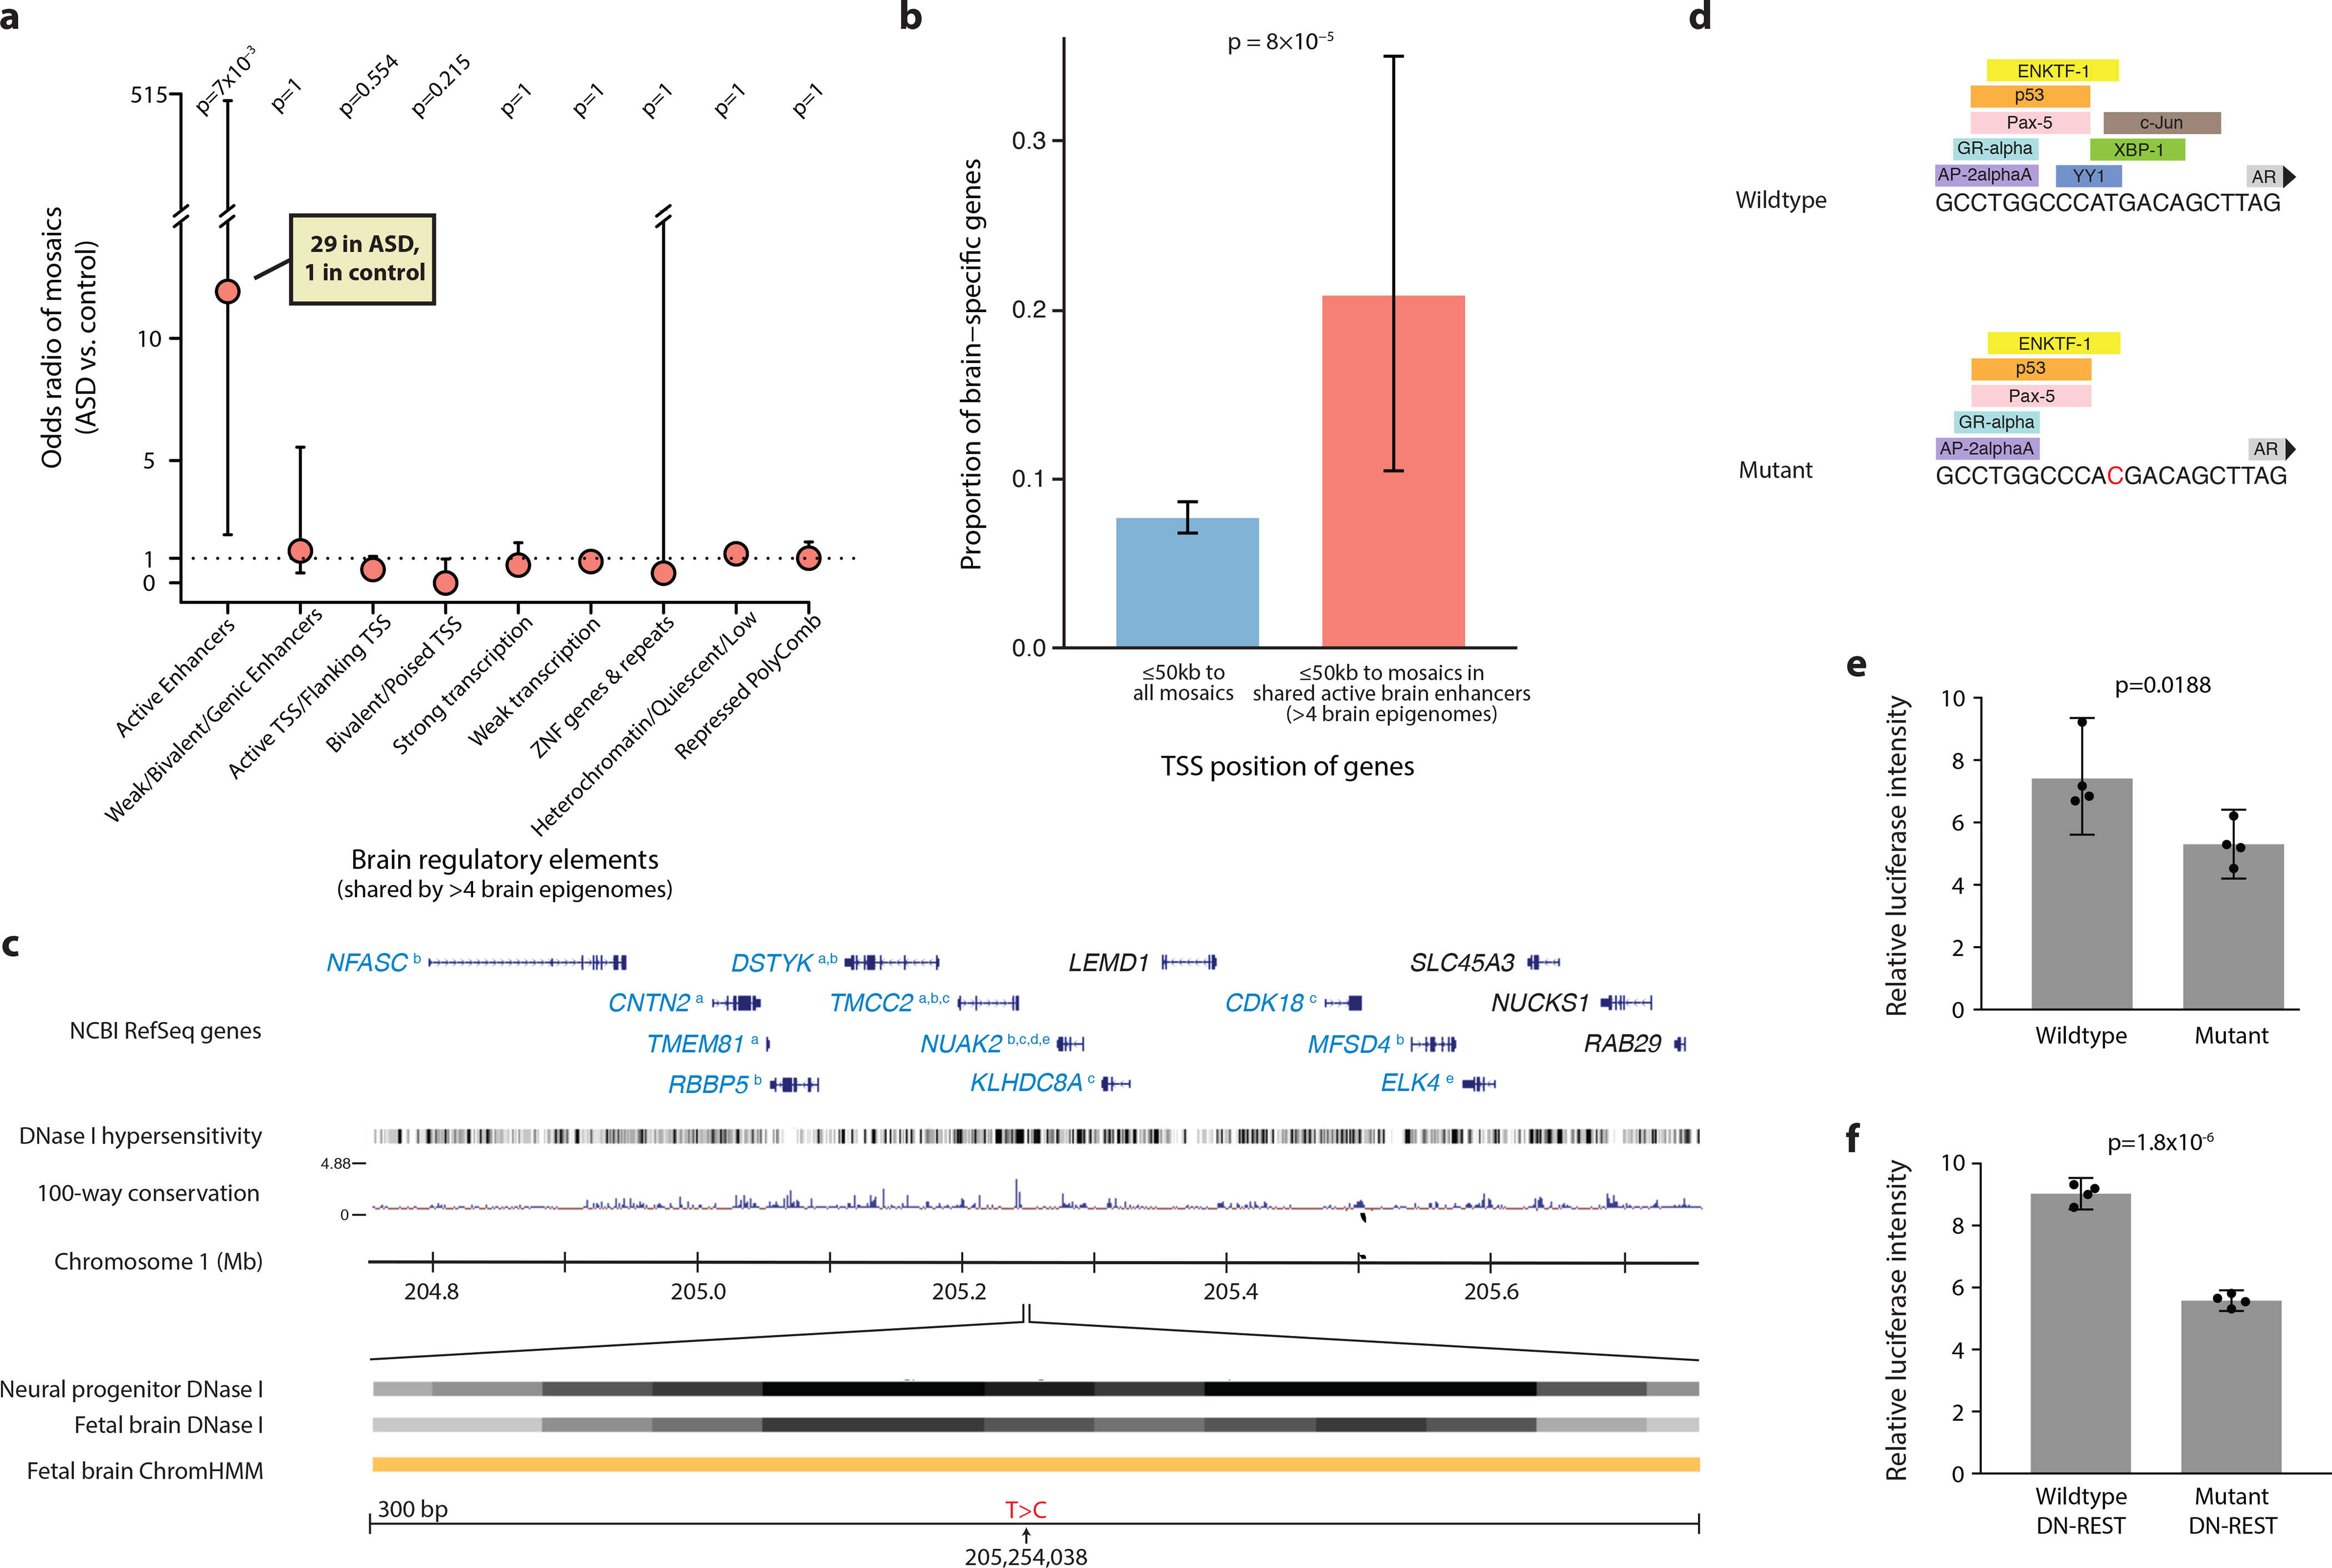
We characterize the landscape of somatic mutations-mutations occurring after fertilization-in the human brain using ultra-deep (~250×) whole-genome sequencing of prefrontal cortex from 59 donors with autism spectrum disorder (ASD) and 15 control donors. We observe a mean of 26 somatic single-nucleotide variants per brain present in ≥4% of cells, with enrichment of mutations in coding and putative regulatory regions. Our analysis reveals that the first cell division after fertilization produces ~3.4 mutations, followed by 2-3 mutations in subsequent generations. This suggests that a typical individual possesses ~80 somatic single-nucleotide variants present in ≥2% of cells-comparable to the number of de novo germline mutations per generation-with about half of individuals having at least one potentially function-altering somatic mutation somewhere in the cortex. ASD brains show an excess of somatic mutations in neural enhancer sequences compared with controls, suggesting that mosaic enhancer mutations may contribute to ASD risk.


Conflict of interest statement

Competing interests

The authors declare no competing interests.

Figures

Figure 1:
Figure 1:. Experimental design and genome coverage.
DNA was isolated from dorsolateral prefrontal cortex of 59 ASD brains and 15 control brains then whole-genome sequenced to an average depth of 250×. Germline variants were identified and somatic single nucleotide variants were called using MosaicForecast. A representative set of mutations was validated using targeted amplicon resequencing. Mutations were systematically assigned to cell generations based on variant allele fraction.
Figure 2:
Figure 2:. Mosaic mutations are present across the genomes of cases and controls.
a, Distribution of mosaic mutations per subject. b, VAF distribution of all mosaic variants identified in this study (stacked barplot). There are more ASD cases than controls and therefore more total ASD sSNVs, but no difference in allele fraction distribution. c, Validation rates in PCR-free and PCR-based samples from deep targeted resequencing of 208 putative mutations. d, Variant allele fractions from WGS were highly correlated with allele fractions from deep resequencing (R2=0.904; n=208 mutations). Error bars indicate 95% CIs calculated with a binomial test. e, Number of observed mosaic mutations divided by the expected number of mosaics assuming a uniform mutation rate, among 1603 PCR-free sSNVs (excluding false positive mutations by deep re-sequencing validation). Exonic regions show the strongest enrichment for mosaics among several genomic regions (two-tailed binomial test). Error bars indicate 95% CIs calculated with a binomial test. f, Non-coding somatic mutations are enriched in DNAse I hypersensitive sites annotated by the Roadmap Epigenomics Project in both 59 ASD cases and the total dataset (74 cases total; two-tailed Wilcoxon rank sum test). The lower and upper hinges of the boxplot correspond to the first and third quartiles, and the middle lines correspond to the median values.
Figure 3:
Figure 3:. Clonal mutation analysis reveals mutational dynamics in the early embryo.
a, Clonal somatic mutations map onto a symmetrical model of cell division in the early embryo. The black curve represents the likelihood of sSNVs belonging to the first cell generation, blue the second cell generation, red the third cell generation, yellow the fourth cell generation, and green the fifth cell generation. b, Cell generation assignments for sSNVs were congruent with data from single-cell lineage analysis of three individuals (UMB1465, UMB4643, UMB4638). c, Somatic mutations are elevated in the first cell generation of embryogenesis (~3.4 mutations per cell division), then occur at a rate of approximately 2–3 mutations per cell division in subsequent generations. d, Based on the mutation rate per cell generation, an average individual would carry ~86 (95% CI: 82–90) sSNVs from the first five cell generations. e, Given that ~2.2% of sSNVs in our dataset are exonic, each individual would carry ~1.9 (95% CI: 0–5) exonic sSNVs. Panels c-e are based on 1603 PCR-free sSNVs. Plots represent mean and error bars indicate 95% CI calculated with a binomial test. f, Assuming ~37% of new exonic mutations are damaging, ~50% of individuals would carry ≥1 damaging exonic mutation from the first 5 cell divisions, present in roughly ≥2% of cells. g-h, Amongst mosaic mutations in the occipital lobe and prefrontal cortex for control brains UMB4638 and UMB4643, variants assigned to earlier cell divisions are present in wider tissue distributions across the body.
Figure 4:
Figure 4:. Base substitutions vary with cell generation and replication timing.
a, There is significant evolution of mutation profiles across the first four cell divisions. Specifically, there is an increase of C>T transitions and decrease of T>A mutations (two-tailed Fisher’s Exact test). Data includes 1641 mutations (all PCR-free sSNVs with false positives removed and validated PCR-based sSNVs). Error bars indicate 95% CIs calculated with a binomial test. b, C>T mutations in CpG dinucleotides tend to occur in earlier replicating genomic regions. c, C>T mutations in non-CpG contexts show no replication timing bias. d, All other substitution types show a more typical late-replication bias.
Figure 5:
Figure 5:. ASD brains contain somatic mutations affecting brain-active enhancers.
a, Although there is no difference between ASD cases and controls in the burden of mosaic mutations present in all brain-active enhancers from the Roadmap project, ASD cases are enriched for mutations occurring in regions that act as enhancers in the majority of brain epigenomes available for analysis. Odds ratios and error bars (95% CI) were calculated by Fisher’s Exact test; p value was further corrected with Bonferroni correction. b, Active brain enhancer regions harboring mutations in our dataset are nearby transcription start sites of genes that are enriched for brain-specific expression, compared to genes nearby all mutations in our dataset. Error bars indicate 95% CI calculated with a binomial test. Panels a and b include sSNVs from PCR-free samples (false positive sites by deep resequencing were excluded) and validated mosaic indels, for a total of 1689 mutations. c, Example of a sSNV in ASD brain AN06365 located in a brain-active enhancer. Genes in blue font have functional evidence linking their expression to enhancer activity (a = Genotype Tissue Expression, b = Predicted Enhancer Targets, c = Hi-C sequencing data, d = Chromatin Interaction Analysis by Paired-End Tag Sequencing, e = ENCODE data). Orange ChromHMM track represents active enhancer designation. d, The mutation is predicted to affect transcription factor binding. e, A mutant construct transfected into N2A cells results in reduced enhancer activity by 29% compared to wildtype construct (n=4 independent plates cultured in parallel, two-tailed t-test, t=3.191, df=6). f, In N2A cells pre-treated with DN-REST to assume a neuronal-like state, the mutant construct reduces enhancer activity by 38% (n=4 independent plates cultured in parallel, two-tailed t-test, t=18.07, df=6). Error bars in panels e and f represent 95% CIs.

Comment in

References

    1. Lynch M Rate, molecular spectrum, and consequences of human mutation. Proc Natl Acad Sci U S A 107, 961–968, doi:10.1073/pnas.0912629107 (2010). - DOI - PMC - PubMed
    1. D’Gama AM et al. Mammalian target of rapamycin pathway mutations cause hemimegalencephaly and focal cortical dysplasia. Ann Neurol 77, 720–725, doi:10.1002/ana.24357 (2015). - DOI - PMC - PubMed
    1. Lim JS et al. Somatic Mutations in TSC1 and TSC2 Cause Focal Cortical Dysplasia. Am J Hum Genet 100, 454–472, doi:10.1016/j.ajhg.2017.01.030 (2017). - DOI - PMC - PubMed
    1. Nakashima M et al. Somatic Mutations in the MTOR gene cause focal cortical dysplasia type IIb. Ann Neurol 78, 375–386, doi:10.1002/ana.24444 (2015). - DOI - PubMed
    1. Erickson RP Recent advances in the study of somatic mosaicism and diseases other than cancer. Curr Opin Genet Dev 26, 73–78, doi:10.1016/j.gde.2014.06.001 (2014). - DOI - PubMed

Publication types