. 2021 Feb;24(2):186-196.
doi: 10.1038/s41593-020-00767-4. Epub 2021 Jan 11.

Machine learning reveals bilateral distribution of somatic L1 insertions in human neurons and glia

Collaborators, Affiliations

Machine learning reveals bilateral distribution of somatic L1 insertions in human neurons and glia

Xiaowei Zhu et al. Nat Neurosci. 2021 Feb.

Erratum in

Abstract

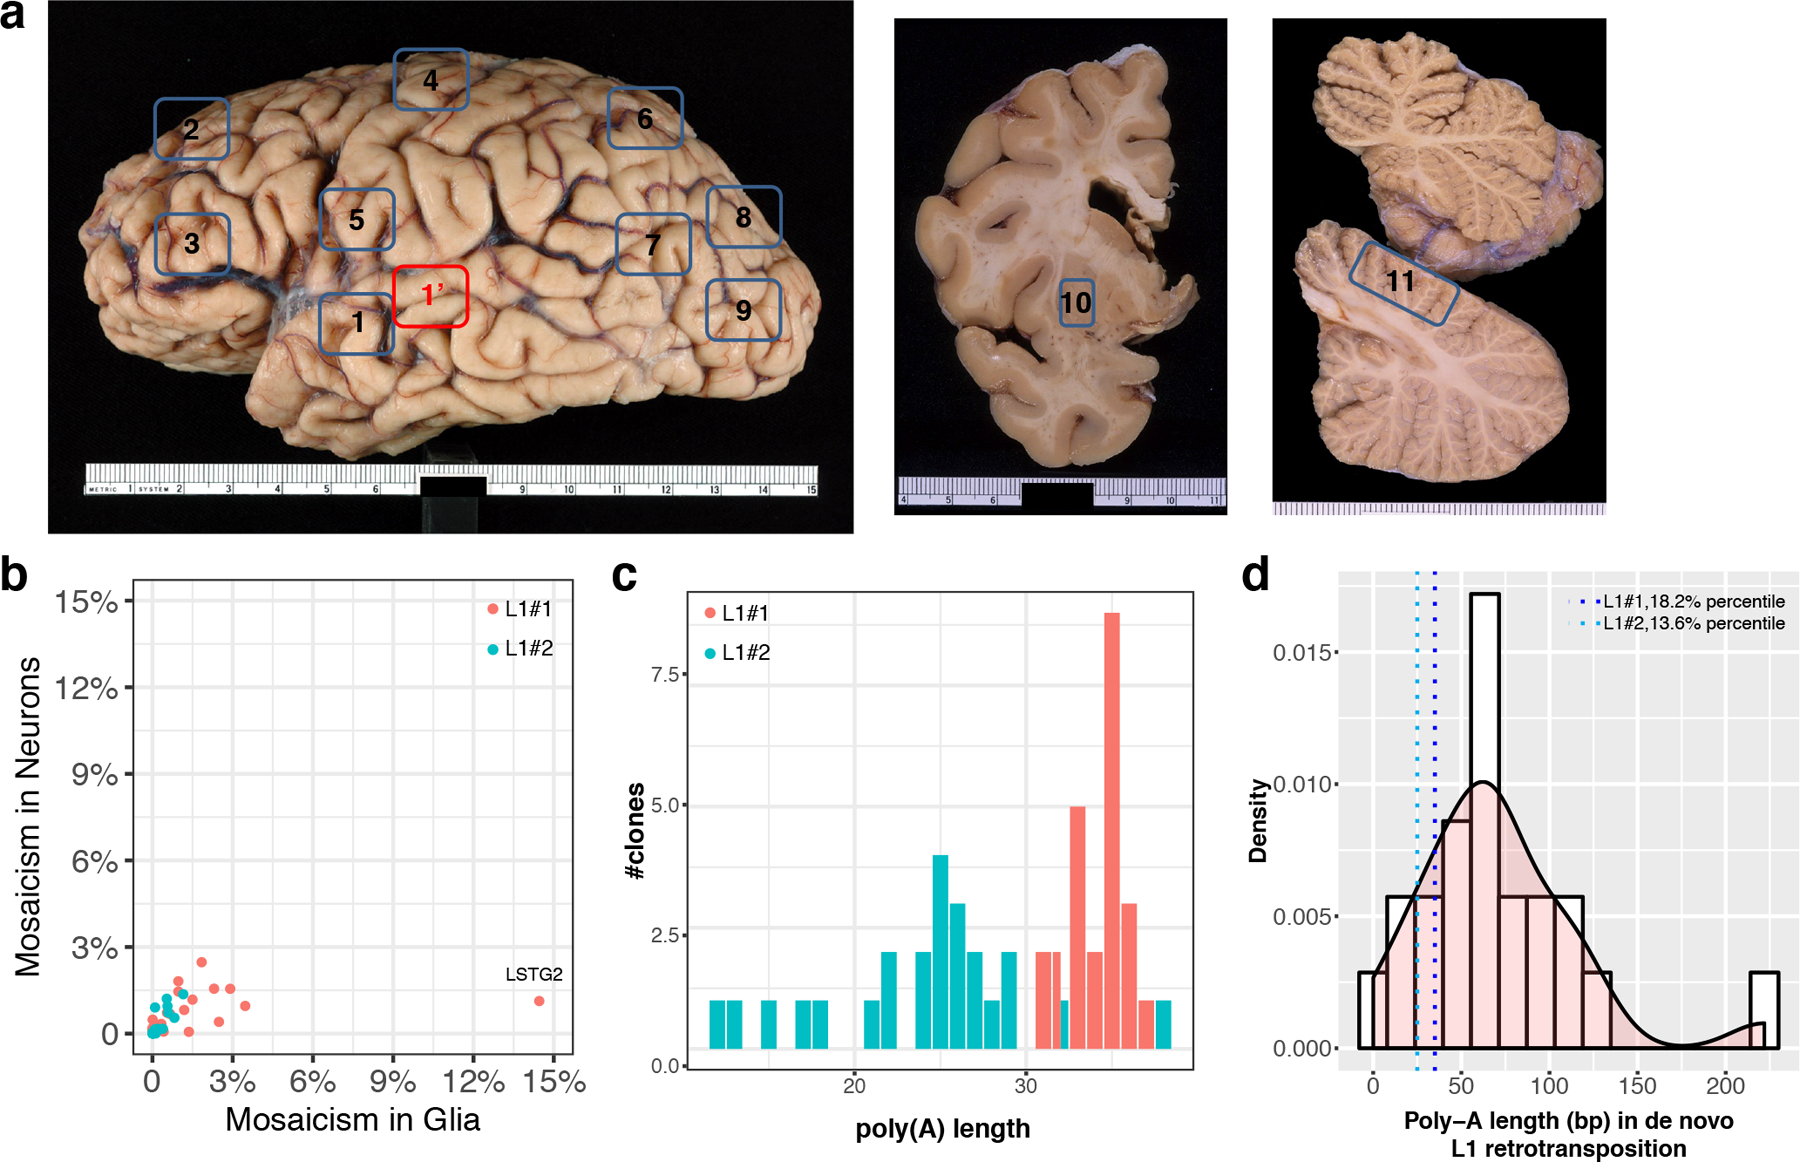
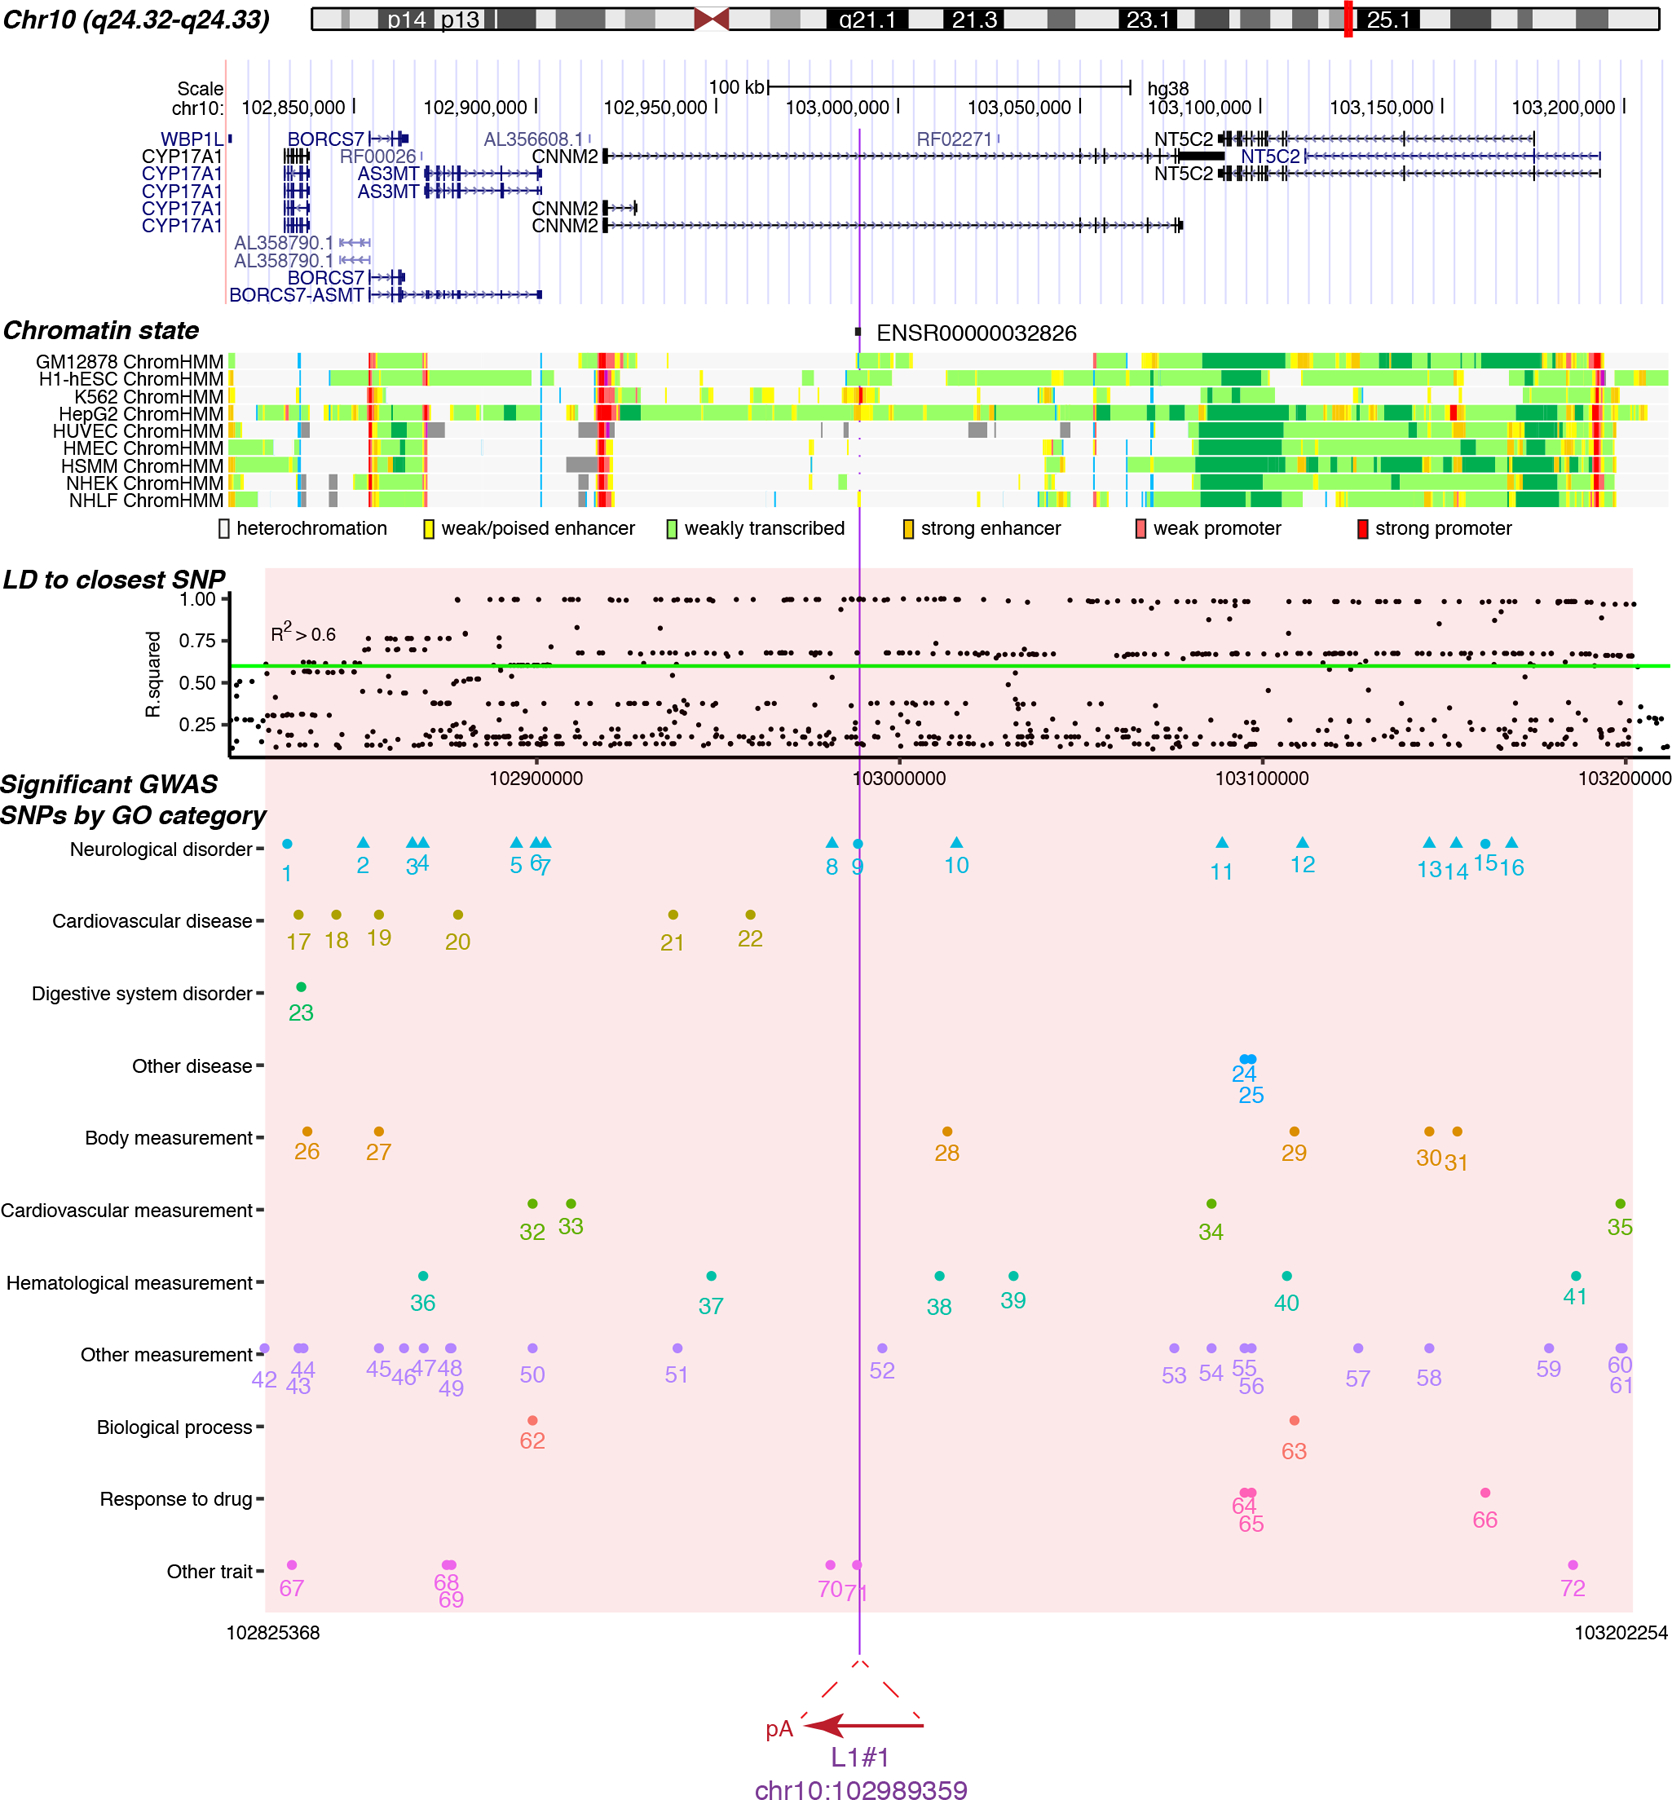
Retrotransposons can cause somatic genome variation in the human nervous system, which is hypothesized to have relevance to brain development and neuropsychiatric disease. However, the detection of individual somatic mobile element insertions presents a difficult signal-to-noise problem. Using a machine-learning method (RetroSom) and deep whole-genome sequencing, we analyzed L1 and Alu retrotransposition in sorted neurons and glia from human brains. We characterized two brain-specific L1 insertions in neurons and glia from a donor with schizophrenia. There was anatomical distribution of the L1 insertions in neurons and glia across both hemispheres, indicating retrotransposition occurred during early embryogenesis. Both insertions were within the introns of genes (CNNM2 and FRMD4A) inside genomic loci associated with neuropsychiatric disorders. Proof-of-principle experiments revealed these L1 insertions significantly reduced gene expression. These results demonstrate that RetroSom has broad applications for studies of brain development and may provide insight into the possible pathological effects of somatic retrotransposition.


Conflict of interest statement

Competing Interests Statement

J.V.M. is an inventor on patent US6150160, is a paid consultant for Gilead Sciences, serves on the scientific advisory board of Tessera Therapeutics Inc. (where he is paid as a consultant and has equity options), and currently serves on the American Society of Human Genetics Board of Directors. C.A.T is or has been a deputy editor for the American Psychiatric Association; an ad hoc consultant for Astellas, Eli Lilly and Lundbeck; a council member for the Brain & Behavior Research Foundation, the Institute of Medicine, the National Alliance on Mental Illness and the National Institute of Mental Health; an organizer for the International Congress on Schizophrenia Research; a consultant for Kaye Scholer; and a member of the advisory board of drug development for Intra-Cellular Therapies.

Figures

Extended Data Fig. 1
Extended Data Fig. 1. Classification of supporting reads from putative mobile element insertions.
(a) We simulated the relationship between the detectable mosaicism of somatic MEIs and the number of supporting reads in bulk sequencing by considering the range of coordinates for the putative supporting reads for either the upstream or downstream junction (see Fig. 1d). Blue, segment of supporting read that maps to flanking sequence; red, segment of read that maps to ME consensus; gray, the insert segment between the two paired-end reads. (b) A detailed flowchart describing the framework behind RetroSom. We labeled putative supporting reads as true or false insertions based on the inheritance pattern and built a set of random forest models to classify them based on various sequencing features (see Supplementary Table 3). (c) The distribution of true L1 (left) and Alu (right) insertions among 11 offspring is similar to a theoretical binomial distribution (red line). The peaks around N=11 represent additional MEIs that are homozygous in one of the parents and transmitted to all 11 offspring. (d) To avoid missing values, we categorized L1 PE supporting reads into 8 subgroups depending on their mapping locations on the L1Hs (L1 human specific) consensus sequence. (e) The performance of random forest classification in all 8 L1 PE read sub-models, ranked based on their average F1 score (harmonic average of sensitivity and precision) from 11× cross validation (n=11 tests). (f and g) Model selection and evaluation with 11× cross validation: (f) precision-recall curve, (g) area under the precision-recall curve (AUPR, n=11 tests). The boundaries of the boxplots indicate the 25th percentile (above) and the 75th percentile (below), the black line within the box marks the median. Whiskers above and below the box indicate the 10th and 90th percentiles.
Extended Data Fig. 2
Extended Data Fig. 2. Benchmarking Alu insertions in independent test datasets.
(a) Performance in detecting germline Alu insertions from clonally expanded fetal brain cells sequencing data. Gray, clones from donor “316” sequenced with whole genome amplification (316WGA, n=10 clones); brown, the rest of the “316” datasets (316 noWGA, n=5 clones); blue, clones from donor “320” (n=52 clones). The boundaries of the boxplots indicate the 25th percentile (above) and the 75th percentile (below), the black line within the box marks the median. Whiskers above and below the box indicate the 10th and 90th percentiles. (b) Performance in detecting germline Alu insertions from sequencing libraries prepared with or without PCR. Light blue/green, PCR-free libraries for sample “Heart” (light blue circle, n=1) and “Neuron” (light green triangle, n=1); Dark blue/green, PCR-based libraries for “Heart” (dark blue circle, n=6) and “Neuron” (dark green triangle, n=6). (c-e) Performance in detecting somatic MEIs simulated by six genomic DNA samples at proportions of 0.04% to 25% with that of NA12878, at various sequencing depth (gray, 50× brown, 100× blue, 200× green, 400×).
Extended Data Fig. 3
Extended Data Fig. 3. Discovery and experimental validation of insertion L1#3.
(a) We identified a somatic L1 insertion (L1#3, red arrow) in one clone, “BG clone16,” with 17 supporting reads. (b) L1#3 is inserted into an intron of gene EVC2. Blue, segment of supporting read that maps to the flanking sequence; red, segment of read that maps to ME consensus. (c) PCR (n=1 replicate) surrounding L1#3 produced a unique band in BG clone16, as well as a lower band in all tested samples, representing the product from the DNA without the insertion. (d) DdPCR (n=2 replicates) detects the upstream junction in 22.54% of the cells in BG clone16. (e) DdPCR (n=2 replicates) detects the downstream junction in 24.16% of the cells in BG clone16. (f and g) L1#3 is absent in 6 bulk tissues (n=4 replicates): BG ventricular zone/subventricular zone (BG VZ/SVZ), BG cortex (BG CX), FR VZ/SVZ, FR CX, occipital cortex, and spleen. The error bars represent the 95% confidence intervals of the mosaicism level in BG clone 16. (h) The full sequence of L1#3: black, flanking sequence; red, inserted L1 sequence; purple, target site duplication; brown, mismatches to the L1Hs consensus. (i) Sequencing depth and reads around L1#3 junction in BG clone16. Mismatch bases are indiated by color: green, A; blue, C; brown, G; red, T.
Extended Data Fig. 4
Extended Data Fig. 4. Postprocessing of putative somatic MEIs.
(a) Procedure for manual curation of putative somatic MEIs. To further remove false positive MEIs, especially for Alu insertions, we implemented manual inspections for each putative insertion. We first check the neighboring regions in both the UCSC and IGV browsers and remove calls that are from regions of potential mapping errors or CNVs. We also remove calls that are found in datasets of other donors. We then apply a novel visualization tool, RetroVis, to quickly screen out calls with questionable supporting read positions. We further inspect the read sequences to check for unwarranted transduction and similarity between different supporting reads. Finally, we design nested PCR and ddPCR to validate the insertions and quantify their respective levels of mosaicism using DNA from the same tissue. In a RetroVis plot, black lines represent human genome location (top) and the inferred segment of the inserted mobile element (e.g., L1) (bottom). A paired-end supporting read is represented by a blue arrow and a red (+ strand insertion) or purple (-strand insertion) arrow connected by a dashed line. A split-read supporting read (spanning an insertion junction) is plotted as a blue arrow (reference segment) connected to an empty rectangle (mobile element segment), with a red or purple arrow below. The positions of the blue segments and red/purple segments reflect the insertion coordinates in the human reference genome and mobile element consensus. (b-j) Examples of likely false positive insertions examined by manual curation. Blue, flanking sequence; red, mobile element sequence (+ strand insertion). (b) Merging different MEIs into one. (c) PCR duplicates. (d) All ME ends are mapped to identical coordinates at the 3’ end of the L1Hs sequence. (e) All anchor ends are mapped to identical coordinates in flanking sequences. (f) Lacking target site duplication. (g) A truncated 3’ end indicates a false insertion or an endonuclease-independent retrotransposition. (h) Two supporting reads mapping to the same ME location but having a low sequence similarity. (i) When the split-read supporting read is mapped partially to the ME consensus (red, locus 2) and fully to another reference genome element (green and red, locus 1), the additional sequence (green) is transduced to the new location. Transduction in Alu insertions, or 5’ transduction in 5’-truncated L1 insertions, indicates a false insertion. (j) The supporting reads suggest that the ME is inserted in the + strand, yet the 3’ end is closer to the upstream flank and the 5’ end is closer to the downstream flank. This conflict indicates a false insertion or a 5’ inversion in L1 retrotransposition.
Extended Data Fig. 5
Extended Data Fig. 5. Summary of the validation experiments.
(a) We used droplet digital PCR (ddPCR) to confirm presence of detected somatic L1s in the DNA from combined cells and to measure the tissue allele frequency, and nested PCR to sequence the junctions (1st nested PCR is the reaction containing both ends of the insertion, and the 2nd nested PCR then uses the product of the 1st as template and targets upstream or downstream junctions), (b) We applied nested PCR to amplify the 5’ and 3’ junctions for L1#1 and L1#2 with overlapping primers, and then used overlap extension PCR (OE-PCR) to obtain the full sequence of L1#1 and L1#2. Control DNA was amplified on DNA without the L1 insertion (NA12878) using primer iii and primer vi. The amplified DNA (L1 or control) was cloned to a constitutively spliced intron in an enhanced green fluorescence protein (EGFP) reporter, pGint. (c) An example of biased PCR amplification favoring pre-integration (insertion-) site blocks the amplification of the post-integration (insertion+) site even at relatively high tissue allele frequencies. We titrated the L1#1 template from GL1#1 plasmid in NA12878 genomic DNA at allele frequencies of 92.4%, 64.6%, 20.7%, 3.59% and 0.53%, and then tested PCR amplification with external primers using PhusionTaq or DreamTaq polymerases, and 30 or 60 PCR cycles (n=1 replicate for each PCR cycle). (d) We designed a droplet-based full length PCR to reduce bias and amplify the post-integration site. We prepared 8 droplet PCR reactions from the genomic DNA of brain or controls: 7 reactions were combined for gel electrophoresis and the last reaction was tested for the probe fluorescence (e.g, again ddPCR). NA12878 genomic DNA was used negative control and the known L1#1 or L1#2 templates was tested as positive controls. (e) The placement of primers (P1+P2) and probe used in the droplet-based full length PCR for L1#1 and L1#2. Primer P3+P2 and P3+P4 were used for in a second PCR to re-amplify the full length insertion of L1#1 and L1#2, respectively.
Extended Data Fig. 6
Extended Data Fig. 6. Experimental validation of L1#1.
(a) We used droplet digital PCR (ddPCR) to measure the frequency, nested PCR to sequence the junctions, cloning with overlap extension PCR (OE-PCR) to obtain the full length insertion sequence, and droplet-based full length PCR followed by gel electrophoresis or fluorescence read-out to amplify the post-integration site (see Extended Data Fig. 5d). TSD, target site duplication; up, upstream junction; dn, downstream junction. (b) DdPCR detected a clear signal for L1#1 in the genomic DNA from right hemisphere superior temporal gyrus, in both neurons (n=8 replicates) and glia (n=8 replicates), but not in the fibroblast (n=8 replicates). Green, droplets containing only RPP30 (internal control); Blue, droplets containing only the L1 junction template; Orange, droplets containing both L1 and RPP30 templates; Black, droplets containing neither L1 nor RPP30 templates. We used NA12878 DNA as a negative control and synthesized DNA with the target L1 junction as a positive control. (c) The full sequence of L1#1 based on OE-PCR. Black, flanking sequence; red, inserted L1 sequence; purple, target site duplication; cyan, L1Hs specific alleles; brown, mismatch to the L1Hs consensus. (d) Nested PCR results showed L1#1 upstream and downstream junctions amplified specifically in the genomic DNA of right STG (RSTG) but not in NA12878. This experiment was repeated for 4 times and always showed the same results. Yellow arrow, product of pre-integration site in the 1st nested PCR (934bp); yellow rectangle, gel extraction from the 1st PCR to serve as template in 2nd PCRs; red arrow: upstream junction in 2nd nested PCR (336bp); blue arrow, downstream junction in 2nd nested PCR (594bp); NA12878, negative control. (e and f) The gel electrophoresis from three independent replicate experiment of the droplet-based full length PCR, confirming the amplification of the L1#1 post-integration site in glia from two brain anatomical regions: LOP—left hemisphere occipital cortex, proximal to STG and LSTG2—a second sample from left hemisphere superior temporal gyrus. NA12878, negative control; L1#1, positive control with known L1#1 junction from plasmid GL1#1. (e) Replicate experiment 1. (f) Replicate experiment 2 and 3. (g) Fluorescence readout of the droplet-based full length PCR was quantified based on a standard curve where L1#1 template (from plasmid GL1#1) is mixed with NA12878 at 4 different allele frequencies: 10.83%, 19.54%, 24.27% and 32.69%. The ratio of positive droplets is positively correlated with the L1#1 template frequency (Pearson’s r=0.99). The blue line marks the linear trend and the surrounding gray area marks the 95% confidence intervals. (h) Fluorescence readout (n=2 anatomical regions) of the droplet-based full length PCR confirms the presence of L1#1 in the tested glial cells but shows no signal in the fibroblasts. The results are displayed in 2 dimensions for clearer illustration, with no internal control used for the signal on the X-axis. The ratio of L1#1 positive droplets (blue) over the total number of droplets is indicated in each ddPCR experiment.
Extended Data Fig. 7
Extended Data Fig. 7. Experimental validation of L1#2.
(a) We used droplet digital PCR (ddPCR) to measure the frequency, nested PCR to sequence the junctions, cloning with overlap extension PCR (OE-PCR) to obtain the full length insertion sequence, droplet-based full length PCR followed by gel electrophoresis or fluorescence ddPCR to amplify the post-integration site, and ddPCR using a Taqman probe crossing its 5’-junction (see Extended Data Fig. 5d). TSD, target site duplication; up, upstream junction; dn, downstream junction. (b) DdPCR detected a clear signal for L1#2 in the genomic DNA from right hemisphere superior temporal gyrus, in both neurons (n=10 replicates) and glia (n=10 replicates), but not in the fibroblast (n=10 replicates). Green, droplets containing only RPP30 (internal control); Blue, droplets containing only the L1 junction template; Orange, droplets containing both L1 and RPP30 templates; Black, droplets containing neither L1 nor RPP30 templates. We used NA12878 DNA as a negative control and synthesized DNA with the target L1 junction as a positive control. (c) The full sequence of L1#2 based on OE-PCR. Black, flanking sequence; red, inserted L1 sequence; purple, target site duplication; cyan, L1Hs specific alleles; brown, mismatch to the L1Hs consensus. (d) Nested PCR results showed L1#2 upstream and downstream junctions amplified specifically in the genomic DNA of right STG (RSTG) but not in NA12878. This experiment was repeated for 4 times and always showed the same results. Notably, we used two different sets of primers in the first PCR for the upstream and downstream junctions. Yellow arrow, product of pre-integration site in the 1st nested PCR (L1#2 up, 266bp; L1#2 dn, 561bp); yellow rectangle, gel extraction from the 1st PCR to serve as template in 2nd PCRs; red arrow: upstream junction in 2nd nested PCR (263bp); blue arrow, downstream junction in 2nd nested PCR (215bp); NA12878, negative control. (e) Gel electrophoresis of the droplet-based full length PCR confirmed the amplification of the L1#2 post-integration site in neurons from the right hemisphere occipital cortex, distal to STG (ROD). NA12878, negative control; L1#2, positive control with known L1#2 junction from L1#2 OE-PCR (see Extended Data Fig. 5b). The droplet-based full length PCR experiment was repeated and showed similar results. (f) Fluorescence readout (n=1 replicate) of the droplet-based full length PCR confirms the presence of L1#2 in neurons from ROD but shows no signal in the fibroblasts. The results are displayed in 2 dimensions for clearer illustration, with no internal control used for the signal on the X-axis. The ratio of L1#2 positive droplets (blue) over the total number of droplets is indicated in each ddPCR experiment. The quantification of the L1#2 frequency is based on a standard curve where L1#2 template (from L1#2 OE-PCR) is mixed with NA12878 at allele frequencies of 7.25% and 13.51%.
Extended Data Fig. 8
Extended Data Fig. 8. Spatial distribution and poly(A) length of L1#1 and L1#2.
(a) Anatomical brain regions studied in donor 12004: 1 and 1’, superior temporal gyrus (BA22, both sides); 2, prefrontal cortex distal (BA9, both sides); 3, prefrontal cortex proximal (BA46, both sides); 4, motor cortex distal (BA4, both sides); 5, motor cortex proximal (BA6, both sides); 6, parietal cortex distal (BA7, both sides); 7, parietal cortex proximal (BA39, both sides); 8, occipital cortex distal (BA19, both sides); 9, occipital cortex proximal (BA19, both sides); 10, putamen (both sides); 11, cerebellum (both sides). The tissue for deep whole genome sequencing is from right superior temporal gyrus (1’). The tissues that were dissected from both hemispheres were bilaterally symmetrical. The metric unit on the ruler is the centimeter. (b) The levels of mosaicism in neurons are highly correlated with levels in glia. Red, L1#1; green, L1#2. (c) Poly(A) lengths of L1#1 and L1#2 were estimated as the lengths supported by the highest numbers of GL1#1 and GL1#2 clones (see Supplementary 8b). The variation among clones was likely the result of PCR stutter around low-complexity templates. (d) Poly-A length distribution in 22 previously reported de novo and disease-causing L1 retrotranspositions. The poly-A lengths of L1#1 and L1#2 are at 18.2% and 13.6% percentiles, respectively, of this distribution.
Extended Data Fig. 9
Extended Data Fig. 9. The genomic locus with L1#1 insertion.
Supplementary Fig. 13. L1#1 is inserted in a 2.6kb promoter flanking region (ENSR00000032826) that is hypothesized to regulates the expression of nearby genes. The chromatin states are shown for a subset of human cell lines: light gray, heterochromatin; light green, weakly transcribed; yellow, weak/poised enhancer; orange, strong enhancer; light red, weak promoter; bright red, strong promoter. L1#1 is inserted in a linkage disequilibrium (LD) block, based on the common SNPs that are highly correlated (R2 > 0.6, green line) with the closest common SNP to L1#1, rs1890185. This LD block is highlighted in red, and contains 72 lead SNPs associated with 10 diseases or disorders and 28 measurements or other traits, including 13 risk SNPs from 11 schizophrenia studies (triangle). We categorized all traits under 11 terms based on the Experimental Factor Ontology. The significantly associated SNPs, indexed from number 1 to 72, are documented in details in Supplementary Table 6.
Extended Data Fig. 10
Extended Data Fig. 10. Fluorescence quantification in the reporter assay.
(a-b) Original photos of the representative images in Fig. 6d and 6e. (c) Raw fluorescence intensities (green and red) used in the statistical analysis in Fig. 6f and Fig. 6g were in the range of 0–3035 for green fluorescence and 0–3613 for red, with no saturated pixels (>4000). Each cell is represented by the average pixel intensity (dot) and the maximum and minimum pixel intensities (bar). Red, Gcont#1; Cyan, GL1#1; Green, Gcont#2; Purple, GL1#2. (d) Measurement of the green fluorescence, red fluorescence and brightfield of three cells. C1, live cell; C2, dead cell, C3, dead cell. Each image is a representative of the green and red fluorescence images in well 1 to well 5 for any reporters (total=60). (e) Representative images from each the GFP fluorescence of the control and L1#1 reporters in the single transfection experiment (2 wells and 3 images per well, see Fig. 6c). The maximum signal intensities are adjusted from 4095 to 1000 in (d) and (e) to illustrate the cells with weak fluorescence.
Fig. 1:
Fig. 1:. Project overview and machine learning method.
(a and b) Deep whole-genome sequencing of five adult brains and one fetal brain. For each donor, DNA from glia (astrocytes for “F1”), neurons, and a non-brain control tissue were sequenced to 200× genomic coverage. (c) Both split-reads (SR) and paired-end reads (PE) can be used to detect a mobile element insertion (MEI). Blue, segment of supporting read that maps to flanking sequence; red, segment of read that maps to ME consensus. (d) Detection of low-mosaicism MEIs requires a low-stringency for the number of supporting reads and is usually accompanied by many false positives. Red, theoretic lowest levels of detectable mosaicism vs. supporting-read cutoffs, gray, number of false positive numbers vs. supporting-read cutoffs. The false positives were false L1 insertions from the offsprings (n=11) in the Illumina Platinum Genomes dataset. (e) Training RetroSom using the Illumina Platinum Genomes dataset. True (red) and false (gray) MEIs were labeled based on inheritance patterns, allowing for the training of a random-forest model using sequence features to classify supporting reads. A detailed flowchart of the modeling is shown in Extended Data Fig. 1b. (f) Distributation of the supporting read sequence homology (85% and above) to the L1Hs consensus sequence. True positive L1 MEI supporting reads (red, n=27780 reads) have a much higher homology than reads supporting false insertions (gray, n=450855 reads). 95% confidence intervals are represented by the bandwidth. (g) True positive L1 events (red, n=11 offsprings) have the L1Hs-specific allele ACA/G, but not the false reads (gray, n=11 offsprings). (h) True positive Alu events (red, n=11 offsprings) do not include the flanking sequence from the putative source location, but not the false reads (gray, n=11 offsprings). The boundaries of the boxplots indicate the 25th percentile (above) and the 75th percentile (below), the black line within the box marks the median. Whiskers above and below the box indicate the 10th and 90th percentiles.
Fig. 2:
Fig. 2:. Benchmarking in independent test datasets.
(a) Performance in detecting germline L1 insertions from clonally expanded fetal brain cells sequencing data. Gray, clones from donor “316” sequenced with whole genome amplification (316WGA, n=10 clones); brown, the rest of the “316” datasets (316 noWGA, n=5 clones); blue, clones from donor “320” (n=53 clones). The boundaries of the boxplots indicate the 25th percentile (above) and the 75th percentile (below), the black line within the box marks the median. Whiskers above and below the box indicate the 10th and 90th percentiles. (b) Performance in detecting germline L1 insertions from sequencing libraries prepared with or without PCR. Light blue/green, PCR-free libraries for sample “Heart” (light blue circle, n=1 library) and “Neuron” (light green triangle, n=1 library); Dark blue/green, PCR-based libraries for “Heart” (dark blue circle, n=6 libraries) and “Neuron” (dark green triangle, n=6 libraries). (c-e) Performance in detecting somatic MEIs simulated by six genomic DNA samples at proportions of 0.04% to 25% with that of NA12878, at various sequencing depth (gray, 50× brown, 100× blue, 200× green, 400×). Similar performance was observed for detecting Alu insertions (Extended Data Fig. 2).
Fig. 3:
Fig. 3:. Discovery and experimental validation of somatic L1#1 and L1#2.
(a) L1#1 was identified by RetroSom with two supporting sequencing reads, and the insertion is in the antisense strand of an intron of gene CNNM2. Blue, read that maps to the flanking sequence; red, mate read that maps to the L1 consensus. (b) DdPCR targeting the L1#1 upstream flanking junction confirms the insertion is present in both neurons (0.72%) and glia (0.54%), and absent in the fibroblast and NA12878. (c) With Sanger sequencing of the 5’ and 3’ junctions, we confirmed the L1 insertion has an endonuclease cleavage site 5’-TTTT/CA-3’ and a 15bp TSD. The inserted L1 element is truncated on the 5’ end and contains 5 bp microhomology (including 1 mismatch) between the L1 sequence and the target site. (d) L1#2 was identified by RetroSom with three supporting sequencing reads, and the insertion is in the sense strand of an intron of gene FRMD4A. (e) DdPCR targeting the L1#2 upstream flanking junction confirms the insertion is present in both neurons (1.2%) and glia (0.53%), and absent in the fibroblast and NA12878. (f) L1#2 has an endonuclease cleavage site 5’-CTTT/AA-3’ and a 6bp TSD. The inserted L1 element is also truncated on the 5’ end, with a 4 bp microhomology between the L1 sequence and the target site. The insertion breakpoint is indicated with a red dashed line in (a) and (c). The p-values in (b) and (e) are calculated with Welch’s two-sided t test. “n” is the number of technical replicate ddPCR experiments. The boundaries of the boxplots indicate the 25th percentile (above) and the 75th percentile (below), the black line within the box marks the median. Whiskers above and below the box indicate the 10th and 90th percentiles.
Fig. 4:
Fig. 4:. L1#1 and L1#2 have wide anatomical distribution in glia as well as in neurons.
We quantitated the levels of mosaicism of two somatic L1 insertions, L1#1 and L1#2, in neurons and glia in 24 anatomical regions. (a and b) The average levels of mosaicism (bar height) and their 95% confidence intervals (error bars) for L1#1 and L1#2 in neurons (blue, triangle) and glia (magenta, circle). (c and d) Replotting the levels of mosaicism in the corresponding brain anatomical regions. L1#1 has a widespread pattern and is present in the neurons of all 24 brain regions, and the glia of 17 regions. L1#2 is present in 12 cerebral cortical regions. The level of mosaicism is denoted by a scale from cold (black, 0.05%) to hot (red, >2%). L, Left; R, Right; FD, prefrontal cortex – distal to STG (BA9); FP, prefrontal cortex – proximal to STG (BA46); MD, motor cortex – distal (BA4); MP, motor cortex – proximal (BA6); PD, parietal cortex – distal (BA7); PP, parietal cortex – proximal (BA39); OD, occipital cortex – distal (BA19); OP, occipital cortex – proximal (BA19); STG, superior temporal gyrus (BA22); Pt, putamen; Cb, cerebellum; RSTG, Right superior temporal gyrus (site of discovery, BA22). The exact anatomical locations are labeled in Extended Data Fig. 8a.
Fig. 5:
Fig. 5:. Somatic L1 insertions occur in genomic regions of high functional potential.
L1#1 is inserted in a 2.6kb promoter flanking region (ENSR00000032826) that is expected to regulate the expression of nearby genes. The chromatin states are shown for a subset of human cell lines: light gray, heterochromatin; light green, weakly transcribed; yellow, weak/poised enhancer; orange, strong enhancer; light red, weak promoter; bright red, strong promoter. L1#1 is inserted in a linkage disequilibrium (LD) block, based on the common SNPs that are highly correlated (R2 > 0.6) with the closest common SNP to L1#1, rs1890185 (398bp upstream of L1#1). This LD block (gray) contains 72 SNPs significantly associated with 10 diseases or disorders and 28 measurement or other traits, including 13 risk SNPs from 11 schizophrenia studies. Red, SNPs associated with schizophrenia; blue, SNPs associated with other neurological disorders; black, SNPs associated with other traits.
Fig. 6:
Fig. 6:. Intronic L1 insertions suppress EGFP reporter activities.
(a) L1#1 and L1#2, as well as their flanking sequences, were cloned into a constitutively spliced intron in an EGFP reporter. An unmodified RFP reporter (Rint) was used as a control. (b) Each reporter was transfected to 5 wells (1–5) of HeLa cells with Rint. Three regions (dashed circles) per well were captured in green, red and bright field channels at 23 hours post-transfection. The order of measurement is indicated by the green arrow. (c) In a separate experiment, we repeated each reporter assay in two additional wells (6–7) with no Rint control. (d-e) A representative of the 15 green and red fluorescence images in well 1 to well 5 (3 images per well). We adjusted the maximum intensities from 4095 to 1000 in all images to illustrate cells at the lower spectrum of the intensities. The original images and values can be found in Extended Data Fig. 10a-c. (f) Cells transfected with either L1 insertion produced significantly less fluorescence than the controls in experiment (b), and L1#2 has a stronger effect than L1#1. (g) The red fluorescence is generally consistent across assays, except for a slight increase in the cells transfected with L1#2. (h) L1 reporters also reduced fluorescence significantly in experiment (c), with a stronger effect in L1#2 than in L1#1. The boundaries of the boxplots indicate the 25th percentile (above) and the 75th percentile (below), the black line within the box marks the median. Whiskers above and below the box indicate the 10th and 90th percentiles. “n” marks the number of individual cells. The p-values are calculated with Welch’s two-sided t test and adjusted with Bonferroni correction for 10 individual tests across different labels.

References

    1. Luan DD, Korman MH, Jakubczak JL & Eickbush TH Reverse transcription of R2Bm RNA is primed by a nick at the chromosomal target site: A mechanism for non-LTR retrotransposition. Cell 72, 595–605 (1993). - PubMed
    1. Symer DE et al. Human l1 retrotransposition is associated with genetic instability in vivo. Cell 110, 327–338 (2002). - PubMed
    1. Hancks DC & Kazazian HH Roles for retrotransposon insertions in human disease. Mob. DNA 7, (2016). - PMC - PubMed
    1. Tubio JMC et al. Extensive transduction of nonrepetitive DNA mediated by L1 retrotransposition in cancer genomes. Science 345, (2014). - PMC - PubMed
    1. Evrony GD et al. Cell Lineage Analysis in Human Brain Using Endogenous Retroelements. Neuron 85, 49–60 (2015). - PMC - PubMed

Methods-only References

    1. Stan AD et al. Magnetic resonance spectroscopy and tissue protein concentrations together suggest lower glutamate signaling in dentate gyrus in schizophrenia. Mol. Psychiatry 20, 433–439 (2015). - PubMed
    1. Matevossian A & Akbarian S. Neuronal Nuclei Isolation from Human Postmortem Brain Tissue. J. Vis. Exp 4–5 (2008). doi:10.3791/914 - DOI - PMC - PubMed
    1. Kozlenkov A. et al. A unique role for DNA (hydroxy)methylation in epigenetic regulation of human inhibitory neurons. Sci. Adv (2018). doi:10.1126/sciadv.aau6190 - DOI - PMC - PubMed
    1. Julius MH, Masuda T & Herzenberg LA Demonstration That Antigen-Binding Cells Are Precursors of Antibody-Producing Cells After Purification with a Fluorescence-Activated Cell Sorter. Proc. Natl. Acad. Sci. U. S. A 69, 1934–1938 (1972). - PMC - PubMed
    1. Zhang Y. et al. Purification and Characterization of Progenitor and Mature Human Astrocytes Reveals Transcriptional and Functional Differences with Mouse. Neuron 89, 37–53 (2016). - PMC - PubMed

Publication types

Substances

LinkOut - more resources