. 2021 Feb;28(2):202-209.
doi: 10.1038/s41594-020-00549-3. Epub 2021 Jan 11.

A trimeric human angiotensin-converting enzyme 2 as an anti-SARS-CoV-2 agent

Affiliations

A trimeric human angiotensin-converting enzyme 2 as an anti-SARS-CoV-2 agent

Tianshu Xiao et al. Nat Struct Mol Biol. 2021 Feb.

Abstract

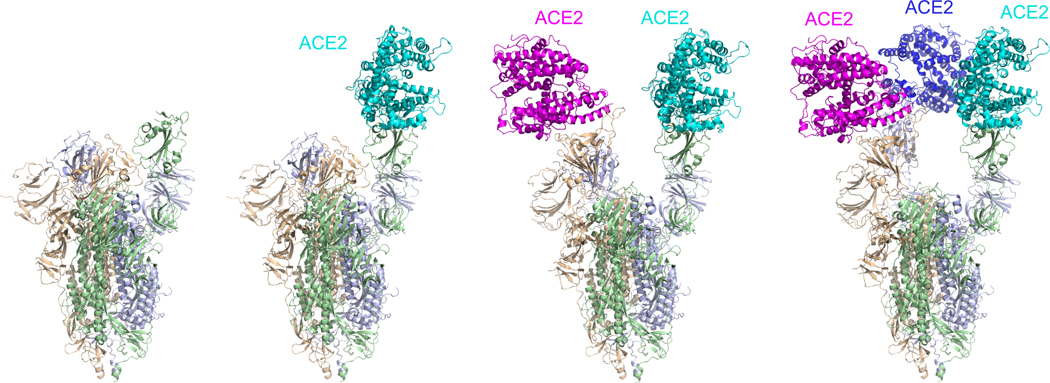
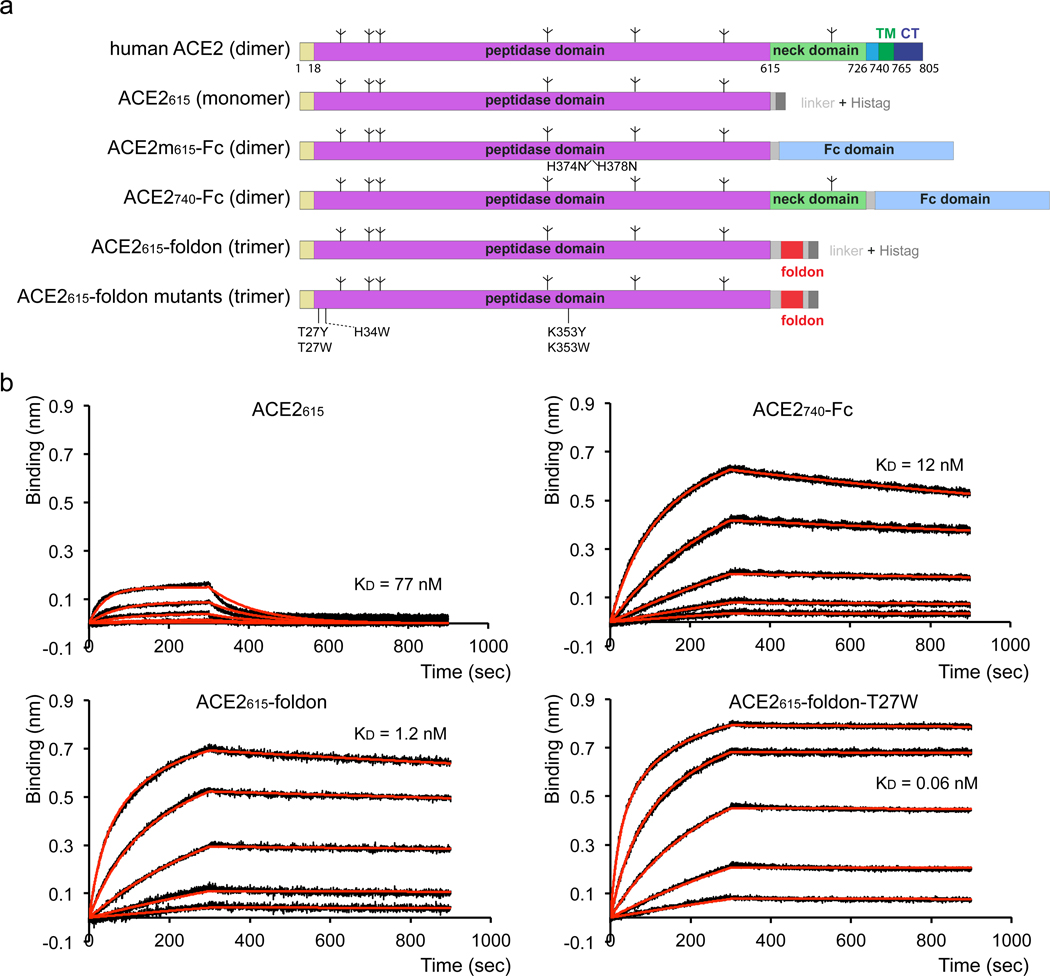
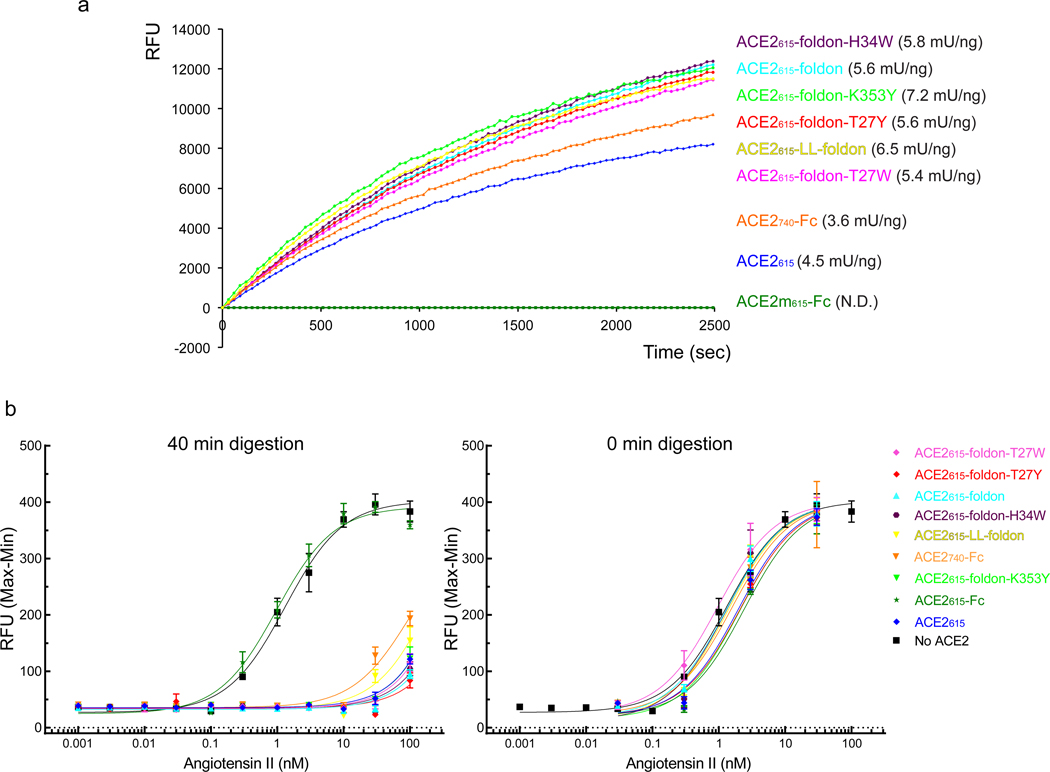
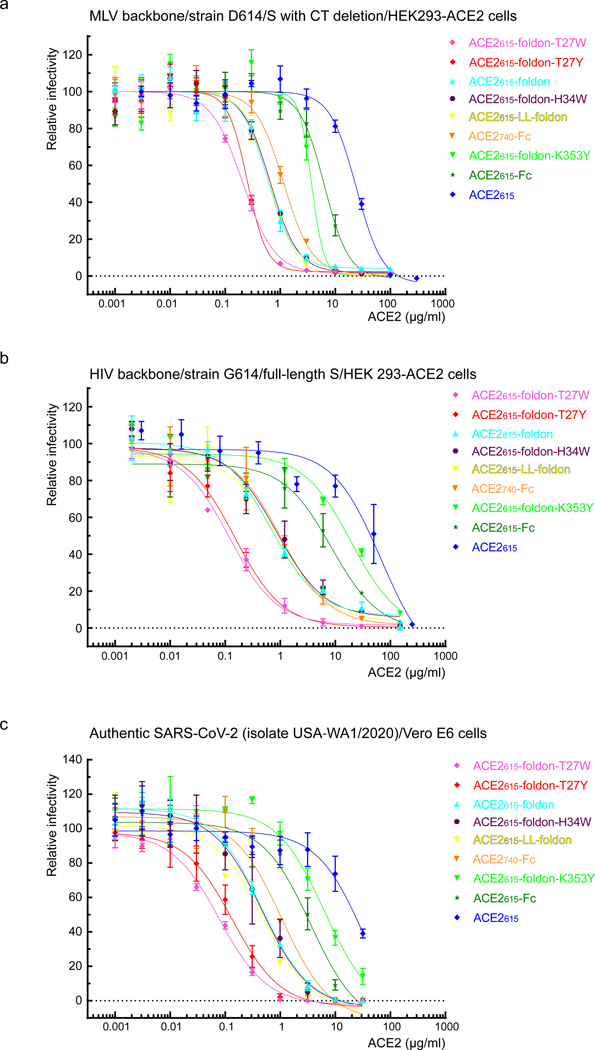
Effective intervention strategies are urgently needed to control the COVID-19 pandemic. Human angiotensin-converting enzyme 2 (ACE2) is a membrane-bound carboxypeptidase that forms a dimer and serves as the cellular receptor for severe acute respiratory syndrome coronavirus 2 (SARS-CoV-2). ACE2 is also a key negative regulator of the renin-angiotensin system that modulates vascular functions. We report here the properties of a trimeric ACE2 ectodomain variant, engineered using a structure-based approach. The trimeric ACE2 variant has a binding affinity of ~60 pM for the spike protein of SARS‑CoV‑2 (compared with 77 nM for monomeric ACE2 and 12-22 nM for dimeric ACE2 constructs), and its peptidase activity and the ability to block activation of angiotensin II receptor type 1 in the renin-angiotensin system are preserved. Moreover, the engineered ACE2 potently inhibits SARS‑CoV‑2 infection in cell culture. These results suggest that engineered, trimeric ACE2 may be a promising anti-SARS-CoV-2 agent for treating COVID-19.


Figures

Extended Data Figure 1.
Extended Data Figure 1.. Preparation of a stabilized soluble SARS-CoV-2 S trimer.
(a) Schematic representation of the expression construct of the soluble SARS-CoV-2 S protein. Segments of S1 and S2 ectodomain (S2ecto) include: NTD, N-terminal domain; RBD, receptor-binding domain; S1/S2, S1/S2 cleavage site; S2’, S2’ cleavage site; FP, fusion peptide; HR1, heptad repeat 1; CH, central helix region; HR2, heptad repeat 2; and tree-like symbols for glycans. The S1/S2 cleavage site (RRAR) was mutated to GGSG. Two mutations K986P and V987P were introduced and a trimerization tag –foldon fused to the C-terminal end to stabilize the prefusion conformation. A C-terminal histag was included for protein purification. (b) The purified S protein was resolved by gel-filtration chromatography on a Superose 6 column and the pooled peak fractions were analyzed by Coomassie stained SDS-PAGE. The molecular weight standards include thyoglobulin (670 kDa), γ-globulin (158 kDa) and ovalbumin (44 kDa). The uncropped image for panel b is available as source data.
Extended Data Figure 2.
Extended Data Figure 2.. Cryo-EM analysis of the ACE2-S complexes.
Top, representative micrograph, and 2D averages of the cryo-EM particle images showing secondary structural features. Bottom, data processing workflow for structures of the free S trimer (no ACE2), S trimer with one ACE2 bound (1 ACE2), S trimer with two ACE2 bound (2 ACE2), S trimer with three ACE2 bound (3 ACE2), as indicated.
Extended Data Figure 3.
Extended Data Figure 3.. Analysis of the 3D reconstructions of the S-ACE2 complexes.
(a) 3D reconstructions of the S trimer and its ACE2 complexes are colored according to local resolution estimated by RELION. Angular distribution of the cryo-EM particles used in the reconstruction is shown in the side view of the EM map. (b) Gold standard FSC curves of the refined 3D reconstructions. (c) Representative density in gray surface from the EM maps. No ACE2), the free S trimer; 1 ACE2, S trimer with one ACE2 bound; 2 ACE2, S trimer with two ACE2 bound; 3 ACE2, S trimer with three ACE2 bound.
Extended Data Figure 4.
Extended Data Figure 4.. ACE2-S interactions.
(a) The top view of the S trimer in complex with two monomeric ACE2 molecules (in magenta and cyan, respectively) with the distance between the C-terminal ends of the ACE2s indicated. (b) The top view of the S trimer in complex with three monomeric ACE2 molecules (in magenta, blue and cyan, respectively) with the distances between the C-terminal ends of the ACE2s indicated. (c) Superposition of the structure of the full-length ACE2 (PDB 6M17) and the structure of S-3 ACE2 complex.
Extended Data Figure 5.
Extended Data Figure 5.. Design of mutations at the ACE2-RBD interface.
Top, the interface between ACE2 in ribbon diagram in magenta and RBD in stick model from the complex structure (PDB 6M0J) with T27, H34 and K353 from ACE2 indicated. Bottom, modeled T27W, H34W and K353W mutations that may enhance the hydrophobic interactions between ACE2 and RBD.
Extended Data Figure 6.
Extended Data Figure 6.. Purification of ACE2 variants.
The purified ACE2 proteins were resolved by gel-filtration chromatography on a Superdex 200 column. The molecular weight standards include thyoglobulin (670 kDa), γ-globulin (158 kDa) and ovalbumin (44 kDa). Inset, peak fractions were analyzed by Coomassie stained SDS-PAGE. The uncropped image is available as source data.
Extended Data Figure 7.
Extended Data Figure 7.. Comparison of secreted and cellular ACE2615-foldon protein.
(a) The purified ACE2615-foldon protein either from cell supernatants (secrected) or cell lysates (cellular) was resolved by gel-filtration chromatography on a Superdex 200 column. Inset, peak fractions were analyzed by Coomassie stained SDS-PAGE. The uncropped image for panel a is available as source data. (b) Binding of ACE2615-foldon to the stabilized soluble S trimer by bio-layer interferometry (BLI). The S protein was immobilized and subsequently dipped into the wells containing either secreted or cellular ACE2615-foldon at various concentrations (0.617–50 nM). The sensorgrams for the secreted ACE2615-foldon are in blue and those for the cellular ACE2615-foldon in red.
Extended Data Figure 8.
Extended Data Figure 8.. Binding of ACE2 variants to the stabilized soluble S trimer by bio-layer interferometry (BLI).
The S protein was immobilized and subsequently dipped into the wells containing ACE2 proteins at various concentrations (0.926–75 nM for ACE2615-Fc, 0.617–50 nM for the ACE2615-foldon variants). Binding kinetics was evaluated using a bivalent model for all oligomeric ACE2s. The sensorgrams are in black and the fits in red. All the experiments were repeated at least twice with essentially identical results. Binding constants derived from the BLI experiments are summarized in Supplementary Table 3.
Figure 1.
Figure 1.. Cryo-EM structures of the ACE2-soluble S trimer complexes.
Four distinct classes were identified and refined from a sample prepared by mixing a monomeric ACE2 and the stabilized soluble SARS-CoV-2 trimer. Left, the structure of the S trimer without ACE2 in a conformation with one RBD up was modeled based on a 3.6-Å resolution density map. Three protomers are colored in green, blue and wheat, respectively. The structures of the S trimer in complex with one ACE2 (3.6Å), two ACE2 (3.7Å) or three ACE2 (3.4Å) are shown, with ACE2 colored in dark blue, cyan or magenta.
Figure 2.
Figure 2.. Design and characterization of ACE2 variants.
(a) Schematic representation of the full-length human ACE2. Various segments include: catalytic peptidase domain, neck domain; TM, transmembrane anchor; CT, cytoplasmic tail; tree-like symbols represent glycans. Expression constructs of various forms of ACE2 used in this study: ACE2615, an inactive peptidase domain with mutations at the active site (H374N and H378N) fused with a C-terminal histag via a flexible linker; ACE2m615-Fc, the peptidase domain fused to a Fc fragment of an immunoglobulin G at the C-terminus; ACE2740-Fc, the peptidase and neck domains fused to a Fc fragment at the C-terminus; ACE2615-foldon, the peptidase domain fused to a trimerization tag- foldon, followed by a C-terminal histag; ACE2615-foldon mutants, single mutations (T27Y, T27W, H34W, K353Y and K353W) were introduced in the context of ACE2615-foldon construct. (b) Binding of ACE2 variants to the stabilized soluble S trimer by bio-layer interferometry (BLI). The S protein was immobilized to AR2G biosensors, which were dipped into the wells containing ACE2 at various concentrations (1.852–150 nM for ACE2615, 0.926–75 nM for ACE2740-Fc and 0.617–50 nM for all the ACE2615-foldon variants). Binding kinetics was evaluated using a 1:1 Langmuir binding model for the monomeric ACE2615 and a bivalent model for all other oligomeric ACE2. The sensorgrams are in black and the fits in red. All experiments were repeated at least twice with independent samples and essentially identical results. Binding constants derived from the BLI experiments are summarized in Table 2.
Figure 3.
Figure 3.. ACE2 peptidase activity and negative regulation of Ang II receptor type 1 activation.
(a) Peptidase activity of the ACE2 variants were measured by detecting free fluorophore released from a synthetic peptide substrate in a time-course experiment. Calculated specific activities are listed and summarized in Table 2. The experiment has been repeated twice with independent samples and similar results. (b) Ang II peptide was treated with various ACE2 variants before adding to the cells expressing Ang II receptor type 1 (AT1R) at different concentrations. AT1R activation was quantified by changes in the intracellular calcium concentration. Samples quenched at time 0 were used as controls. The y-axis is Ratio (Max-Min) (Peak fluorescent intensity - baseline fluorescent intensity). The EC50 values are summarized in Table 2. Data are mean and s.d. for n = 4 technical replicates; data behind graphs are available as source data. The experiment has been repeated at least three times with independent samples and similar results.
Figure 4.
Figure 4.. Inhibition of SARS-CoV-2 pseudoviruses and authentic viruses by ACE2 variants.
(a) Serial dilutions of each ACE2 variant were tested for inhibition against an MLV-based pseudotyped virus using a SARS-CoV-2 S construct containing D614 and a CT deletion in a single-round infection of HEK293-ACE2 cells. The experiments were repeated three times with independent samples giving similar results. (b) ACE2 variants were tested for inhibition against an HIV-based pseudotyped virus using a full-length SARS-CoV-2 S construct containing G614 in a single-round infection of HEK293-ACE2 cells. The experiments were repeated twice with independent samples giving similar results. (c) Serial dilutions of each ACE2 variant were tested for inhibition against an authentic SARS-CoV-2 S virus (isolate USA-WA1/2020) infecting Vero E6 cells. The experiments were repeated three times with similar results. For all panels, data points shown are mean and s.d. for n = 3 technical replicates. Data behind graphs are available as source data. IC50 values derived from curve fitting are listed in Table 2 and Supplementary Table 2.

Update of

Similar articles

Cited by

References

    1. Duan K et al. Effectiveness of convalescent plasma therapy in severe COVID-19 patients. Proc Natl Acad Sci U S A 117, 9490–9496 (2020). - PMC - PubMed
    1. Bloch EM et al. Deployment of convalescent plasma for the prevention and treatment of COVID-19. J Clin Invest 130, 2757–2765 (2020). - PMC - PubMed
    1. Shen C et al. Treatment of 5 Critically Ill Patients With COVID-19 With Convalescent Plasma. JAMA 323,1582–1589 (2020). - PMC - PubMed
    1. Wec AZ et al. Broad neutralization of SARS-related viruses by human monoclonal antibodies. Science 369, 731–736 (2020). - PMC - PubMed
    1. Shi R et al. A human neutralizing antibody targets the receptor binding site of SARS-CoV-2. Nature 584, 120–124 (2020). - PubMed

Methods-only References:

    1. Zheng SQ et al. MotionCor2: anisotropic correction of beam-induced motion for improved cryo-electron microscopy. Nat Methods 14, 331–332 (2017). - PMC - PubMed
    1. Rohou A & Grigorieff N CTFFIND4: Fast and accurate defocus estimation from electron micrographs. J Struct Biol 192, 216–21 (2015). - PMC - PubMed
    1. Wagner T et al. SPHIRE-crYOLO is a fast and accurate fully automated particle picker for cryo-EM. Commun Biol 2, 218 (2019). - PMC - PubMed
    1. Scheres SH RELION: implementation of a Bayesian approach to cryo-EM structure determination. J Struct Biol 180, 519–30 (2012). - PMC - PubMed
    1. Emsley P, Lohkamp B, Scott WG & Cowtan K Features and development of Coot. Acta crystallographica. Section D, Biological crystallography 66, 486–501 (2010). - PMC - PubMed

MeSH terms