. 2021 Jan 12:10:e56426.
doi: 10.7554/eLife.56426.

Random access parallel microscopy

Affiliations

Random access parallel microscopy

Mishal Ashraf et al. Elife. .

Abstract

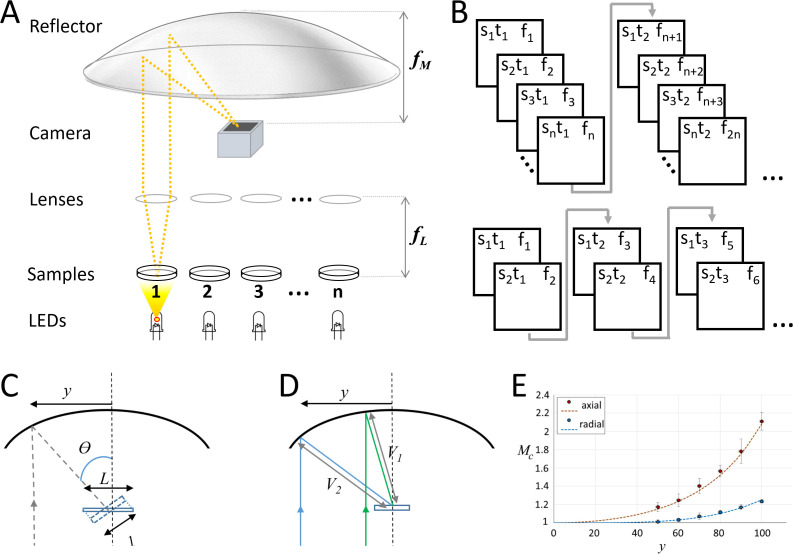
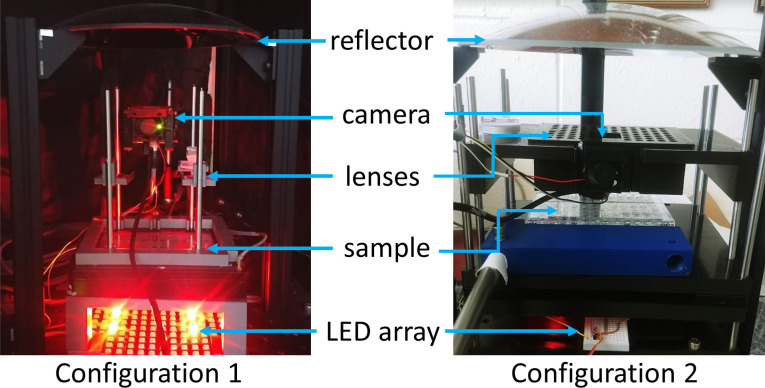
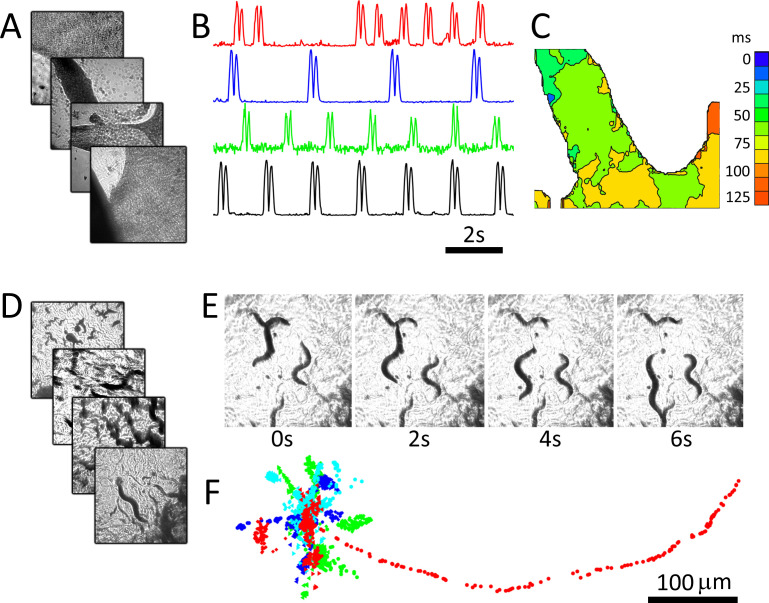
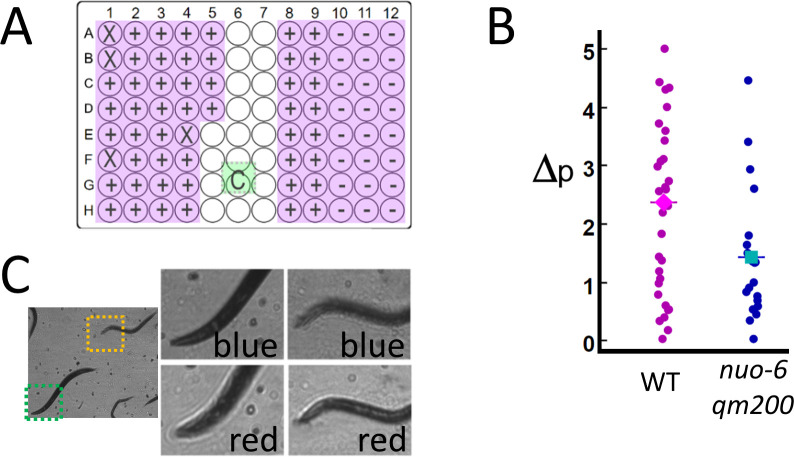
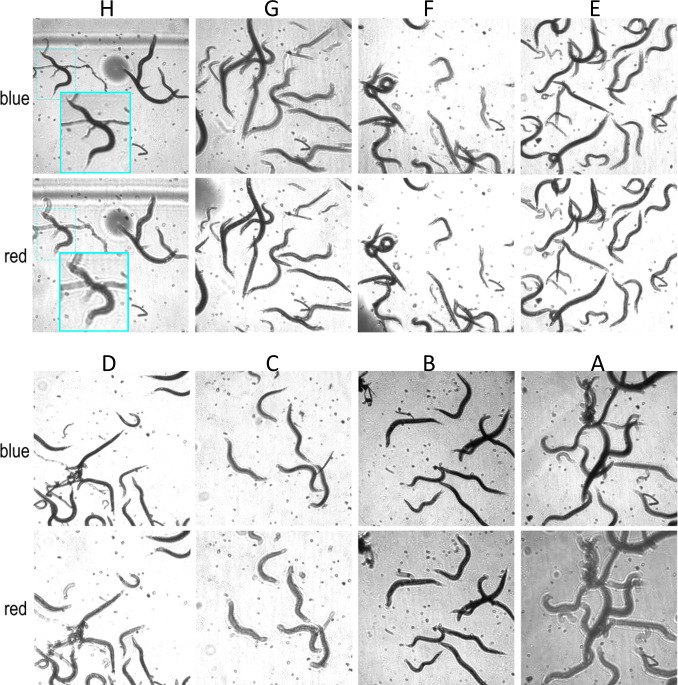
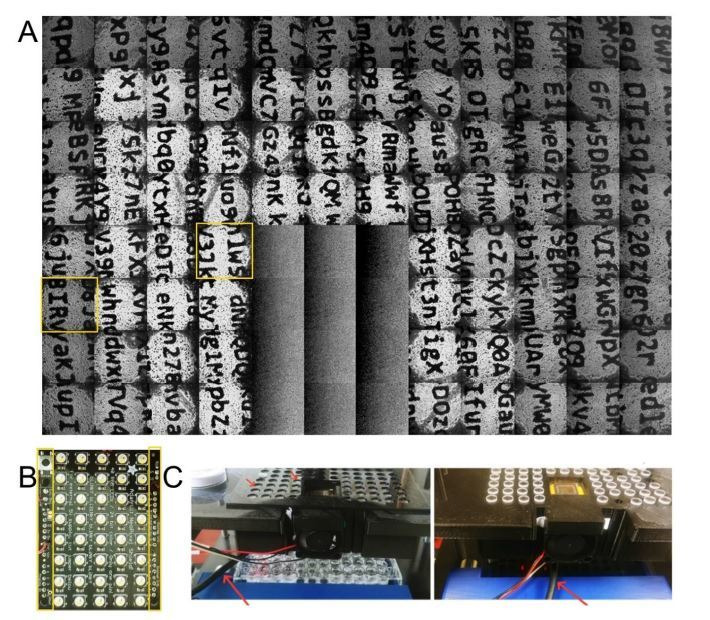
We introduce a random-access parallel (RAP) imaging modality that uses a novel design inspired by a Newtonian telescope to image multiple spatially separated samples without moving parts or robotics. This scheme enables near-simultaneous image capture of multiple petri dishes and random-access imaging with sub-millisecond switching times at the full resolution of the camera. This enables the RAP system to capture long-duration records from different samples in parallel, which is not possible using conventional automated microscopes. The system is demonstrated by continuously imaging multiple cardiac monolayer and Caenorhabditis elegans preparations.

Keywords: C. elegans; brightfield; cardiac; chicken; high-throughput; neuroscience; optics; physics of living systems.


Conflict of interest statement

MA, SM, BS, AT, KR, DB, ST, AC, GB No competing interests declared

Figures

Figure 1.
Figure 1.. Random-access parallel (RAP) imaging principle and magnification properties.
(A) The random-access imaging system uses a parabolic reflector to image samples directly on a fast machine vision camera located at the focal point of the mirror (f M). Single-element plano-convex lenses are used as objectives, with samples positioned at their focal point (f L). Samples are sequentially illuminated using a LED array controlled by an Arduino microcontroller: a sample is only projected on the sensor when its corresponding LED is ‘on’. See Figure 1—figure supplement 1 and Table 1 for details. (B) (top) Sample s, is captured at time t, on frame f. For a total of n samples, each sample is captured once every n frames; (bottom) a smaller subset of samples can be imaged at higher temporal resolution by reducing the number of LEDs activated by the microcontroller. (C) Image magnification: the chief ray (dashed line) arrives at the detector plane at an incidence angle θ which increases with lateral displacement, y. The image is stretched in the direction parallel to y by a factor of L/l. (D) The image is isotopically magnified as the distance between the mirror and the image increases (V2>V1) as y increases. (E) The combined magnification, MC, shows the impact of the combined transformation on the magnification in both image dimensions (y' parallel to y, and x' orthogonal to y). Red dots (measured) and dashes (predicted) show magnification in y', and blue dots (measured) and dashes (predicted) show magnification in x', inset shows Images of a grid (200 μm pitch) taken with y = 70 mm, left is the uncorrected image and right shows the correct image using Equation 1.
Figure 1—figure supplement 1.
Figure 1—figure supplement 1.. Configurations used for data collection.
Two configurations, constructed from a combination of Thorlabs optical components (Thorlabs ER series 6 mm rods) and 3D printed parts, were used to collect the data. Both configurations use the same parabolic reflector held at three points by optical rails (Thorlabs XE25) attached to a breadboard. Configuration 1 allows for adjustable focus for each sample by sliding a 3D printed lens holder along 6 mm diameter rods; Configuration 2 has an array of lenses at a fixed vertical position and focus is achieved by moving the samples (here a single 96-well plate).
Figure 1—figure supplement 2.
Figure 1—figure supplement 2.. Comparison of conventional and RAP images.
USAF targets (clear pattern on a chrome background) imaged using 25 mm, 100 mm focal length plano-convex lens positioned 100 mm above the sample as an objective and the 100 mm focal length parabolic mirror to refocus the image (A, with a zoomed and flipped version of the same image shown in B) or a second 25 mm diameter, 100 mm focal length lens to refocus the image on the sensor (C, shown at same scale as B). The axial distance of the objective to the centre of the parabolic reflector is 40 mm (images A and B). The large square in the centre right in both close-up images is 140 × 140 μm. The sensor used is a 640 × 480 pixel camera with 4.8 × 4.8 μm pixels.
Figure 2.
Figure 2.. RAP imaging of cardiac monolayer and C. elegans preparations.
(A) Four cardiac monolayer preparations in four separate petri dishes are imaged in parallel at 40 fps/dish. (B) Activity vs time plots obtained from the four dishes show different temporal dynamics, where double peaks in each trace correspond to contraction and relaxation within a 20 × 20 pixel ROI (see Materials and methods); (C) an activation map from the second dish (blue trace in B) can be used to determine wave velocity and speed; (D) four C. elegans dishes imaged in parallel at 15 fps/dish; (E) images from one dish every 30 frames (2 s intervals) shows C. elegans motion; (F) the location of five worms in each dish was tracked from data recorded at 15 fps over 250 frames using open-source wrMTrck (Nussbaum-Krammer et al., 2015) software. Dots in different colours (blue, cyan, green, and red) show the tracked positions from plates 1–4, respectively. Each image in (A), (D), and (E) shows a 2 × 2 mm field of view.
Figure 3.
Figure 3.. High-throughput estimates of C. elegans motion in liquid media.
Images are captured at 120 fps, which is split over multiple wells as shown in Video 1. (A) The position of the active detection sites (magenta) relative to the camera (green), which obscures a portion of the 96-well plate: Wells obscured by hardware are denoted by an ‘X’ symbol (see Materials and methods: Table 1), wells with wild-type C. elegans (WT, ‘+’ symbol) and mutant (nuo-6(qm200), ‘−’ symbol). (B) Motion analysis comparing wild type (magenta dots) to mitochondrial mutant nuo-6(qm200) (blue dots): wells in each row are imaged in parallel (eight wells at 15 fps per well), and net motion is estimated in each well by summing absolute differences in pixel intensities in sequential frames (see Materials and methods: Image analysis). This estimate confirms that the imaging system can detect significant differences between the two strains (averages shown by diamond and square symbols, two-tailed t-test p=0.01), which is consistent with published results (Yang and Hekimi, 2010). (C) Focal plane wavelength dependence: details from two fields of view (dashed green and orange squares) in the same image appear in or out of focus depending on whether imaged using a red or blue LED (see Video 2 and Figure 3—figure supplement 1).
Figure 3—figure supplement 1.
Figure 3—figure supplement 1.. Focal plane wavelength dependence.
Images from all wells(A–H) for row 10, illuminated using a blue and red LEDs for Configuration 2 imaging C. elegans in liquid media. Images are in better focus when illuminated with the red LED for wells (G), (F), and (E) and the blue LED for wells (H), (D), (C), (B), and (A). Images for each channel are taken 8.3 ms apart, and the 16 images from eight wells are sampled at 7.5 fps. Each image is 512 × 512 pixels and is not transformed other than brightness adjustment in wells (B) and (A) for clarity. The inset in (H) shows a close up to highlight the focal plane difference between the two channels.
Author response image 1.
Author response image 1.. (A) composite image showing images from all wells aside from those under the camera housing, with wells obscured by cabling in Figure 3 highlighted in yellow.
(B) Image of one of the LED arrays with region reserved for electrical connections highlighted in yellow; the size of these regions prevents tiling the array and complete coverage of the 96 well plate (C) images of the system showing the location of the cable (red arrows) that obscured the wells in Figure 3, and its orientation for the image collected in the top panel of this figure (panel A).
Author response image 2.
Author response image 2.. LED emitting area is approximately 200x200 microns.

Similar articles

Cited by

References

    1. Abraham VC, Taylor DL, Haskins JR. High content screening applied to large-scale cell biology. Trends in Biotechnology. 2004;22:15–22. doi: 10.1016/j.tibtech.2003.10.012. - DOI - PubMed
    1. Booth BW, McParland C, Beattie K, Fisher WW, Hammonds AS, Celniker SE, Frise E. OpenHiCAMM: high-content screening software for complex microscope imaging workflows. iScience. 2018;2:136–140. doi: 10.1016/j.isci.2018.03.017. - DOI - PMC - PubMed
    1. Bub G, Glass L, Publicover NG, Shrier A. Bursting calcium rotors in cultured cardiac myocyte monolayers. PNAS. 1998;95:10283–10287. doi: 10.1073/pnas.95.17.10283. - DOI - PMC - PubMed
    1. Burridge PW, Li YF, Matsa E, Wu H, Ong SG, Sharma A, Holmström A, Chang AC, Coronado MJ, Ebert AD, Knowles JW, Telli ML, Witteles RM, Blau HM, Bernstein D, Altman RB, Wu JC. Human induced pluripotent stem cell-derived cardiomyocytes recapitulate the predilection of breast Cancer patients to doxorubicin-induced cardiotoxicity. Nature Medicine. 2016;22:547–556. doi: 10.1038/nm.4087. - DOI - PMC - PubMed
    1. Burton RA, Klimas A, Ambrosi CM, Tomek J, Corbett A, Entcheva E, Bub G. Optical control of excitation waves in cardiac tissue. Nature Photonics. 2015;9:813–816. doi: 10.1038/nphoton.2015.196. - DOI - PMC - PubMed

Publication types

MeSH terms

LinkOut - more resources