. 2021 Jan 12:10:e59755.
doi: 10.7554/eLife.59755.

Model-based spatial-temporal mapping of opisthorchiasis in endemic countries of Southeast Asia

Affiliations

Model-based spatial-temporal mapping of opisthorchiasis in endemic countries of Southeast Asia

Ting-Ting Zhao et al. Elife. .

Abstract

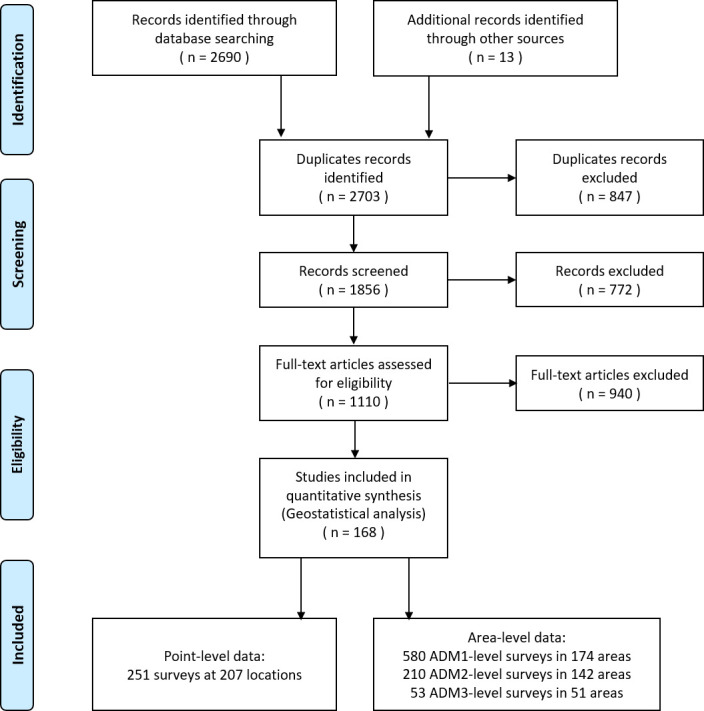
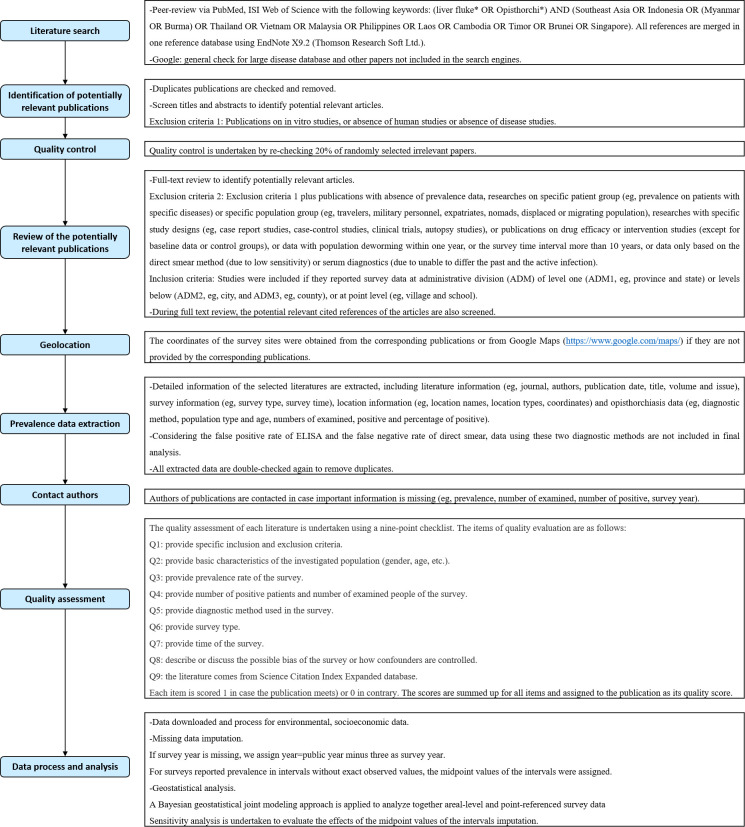
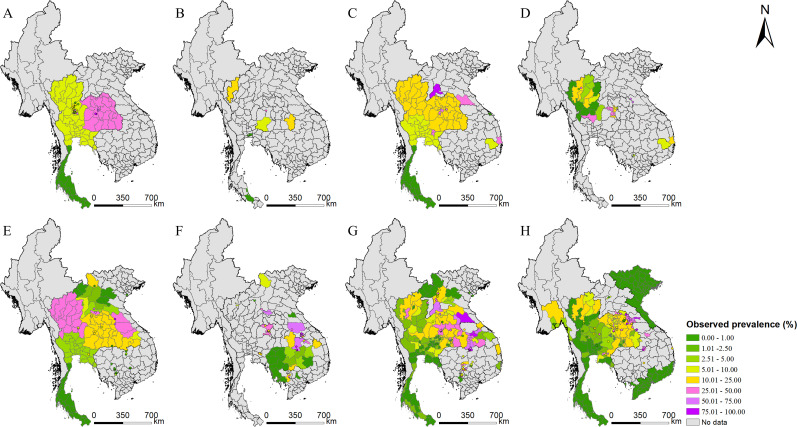
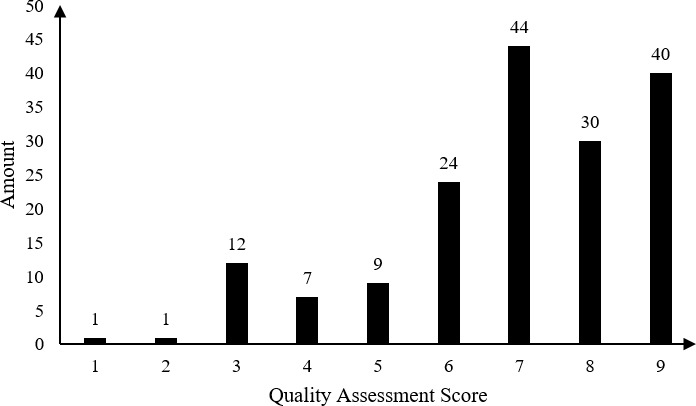
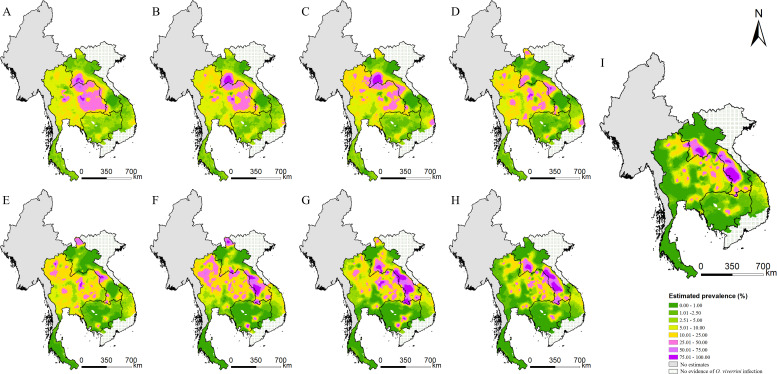
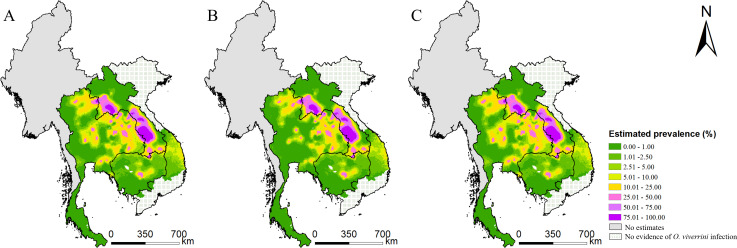
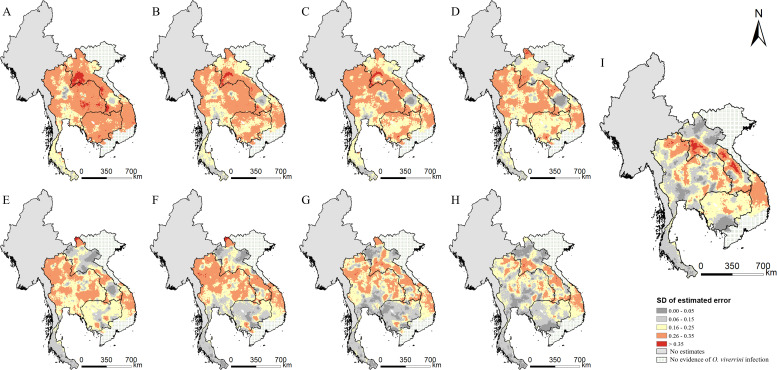
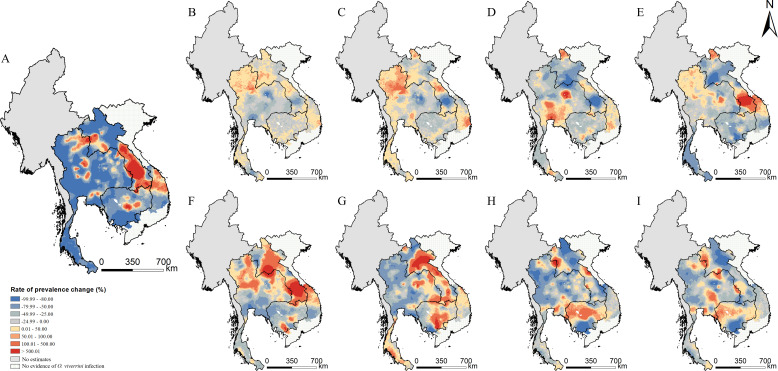
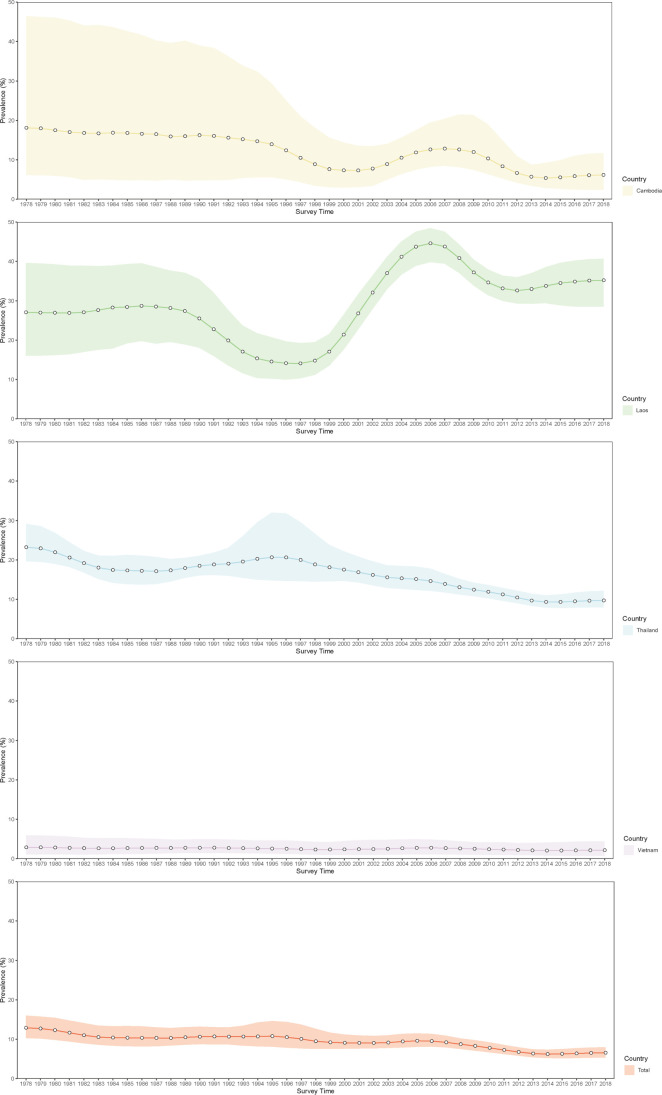
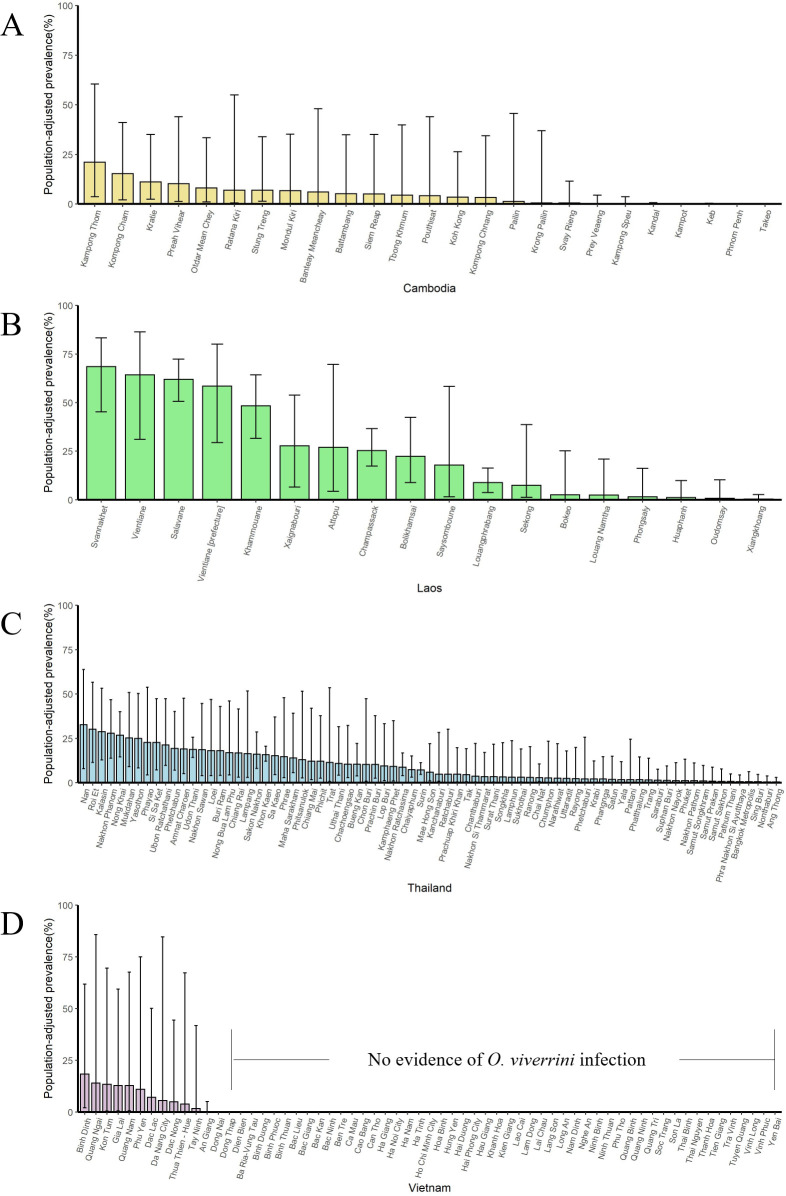
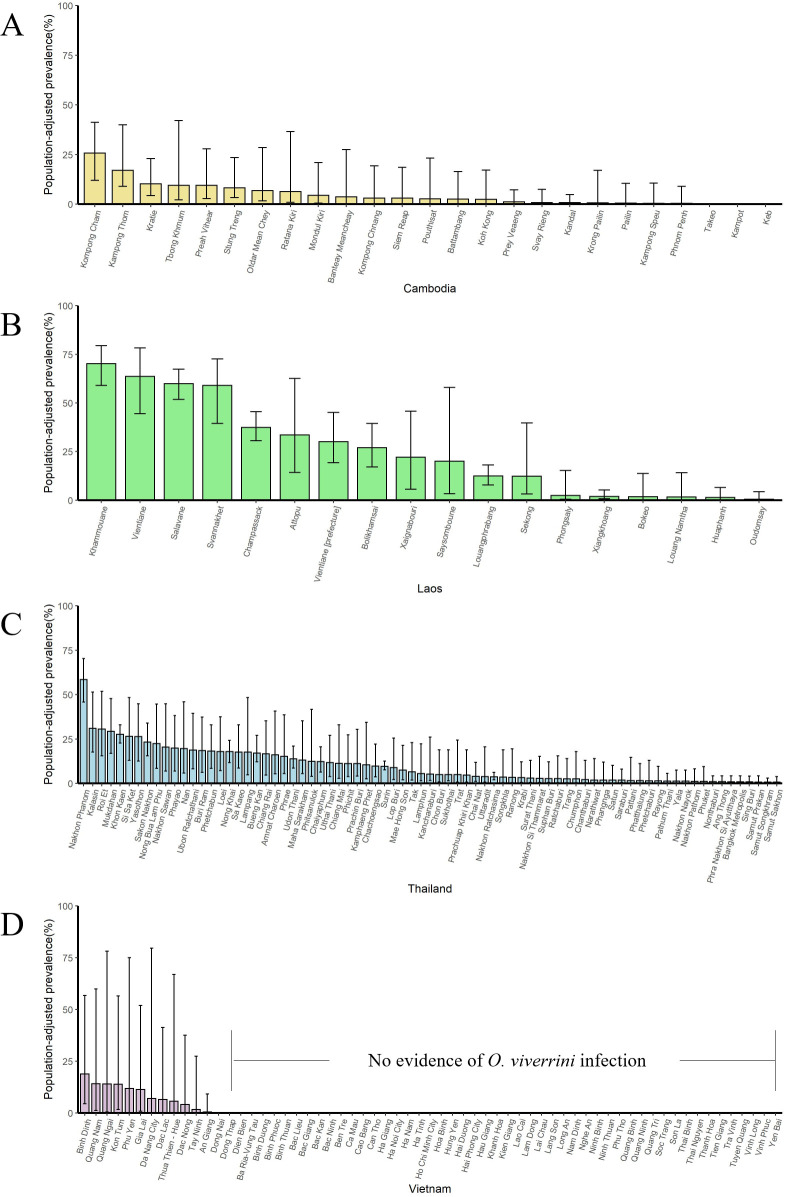
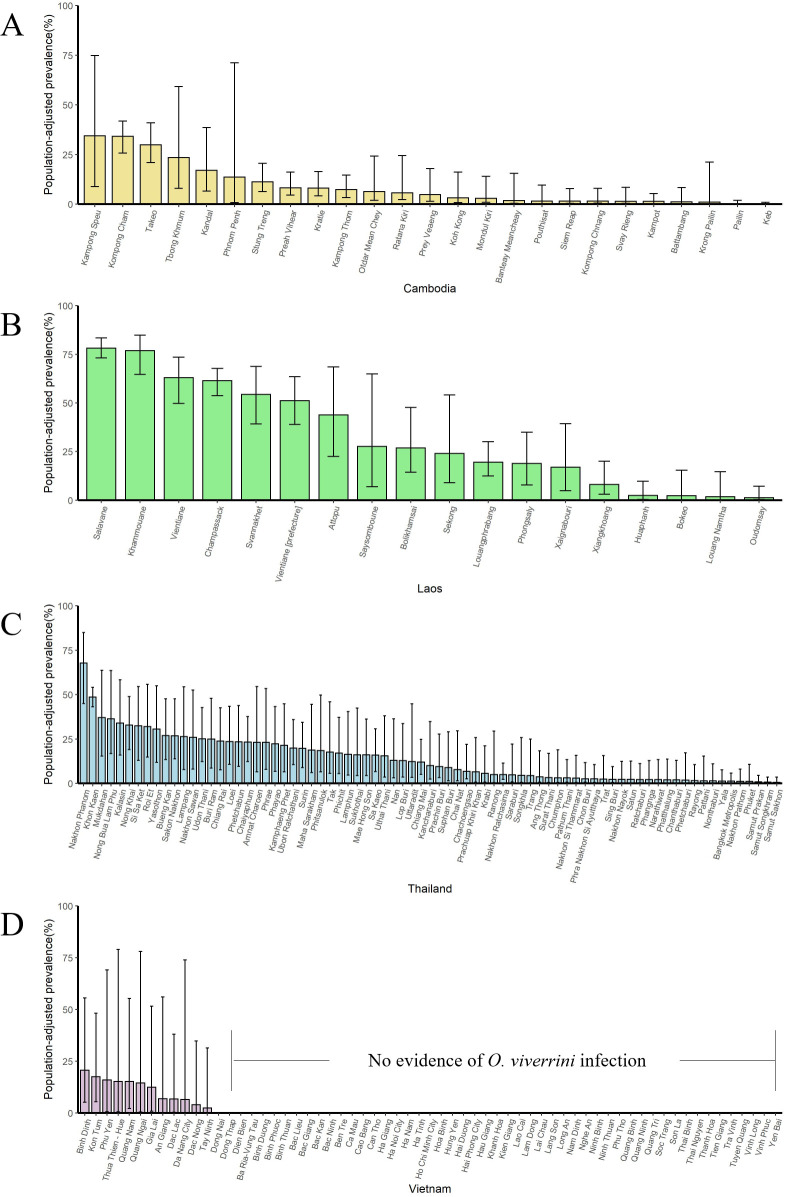
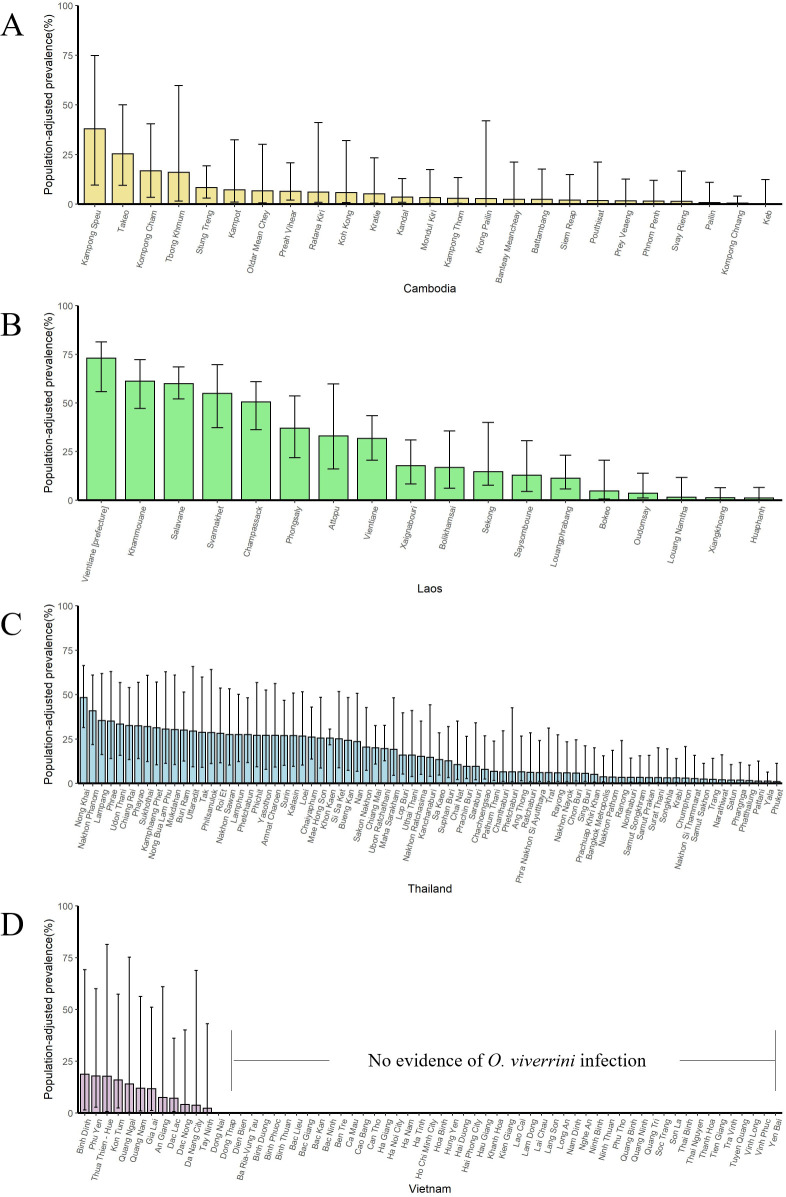
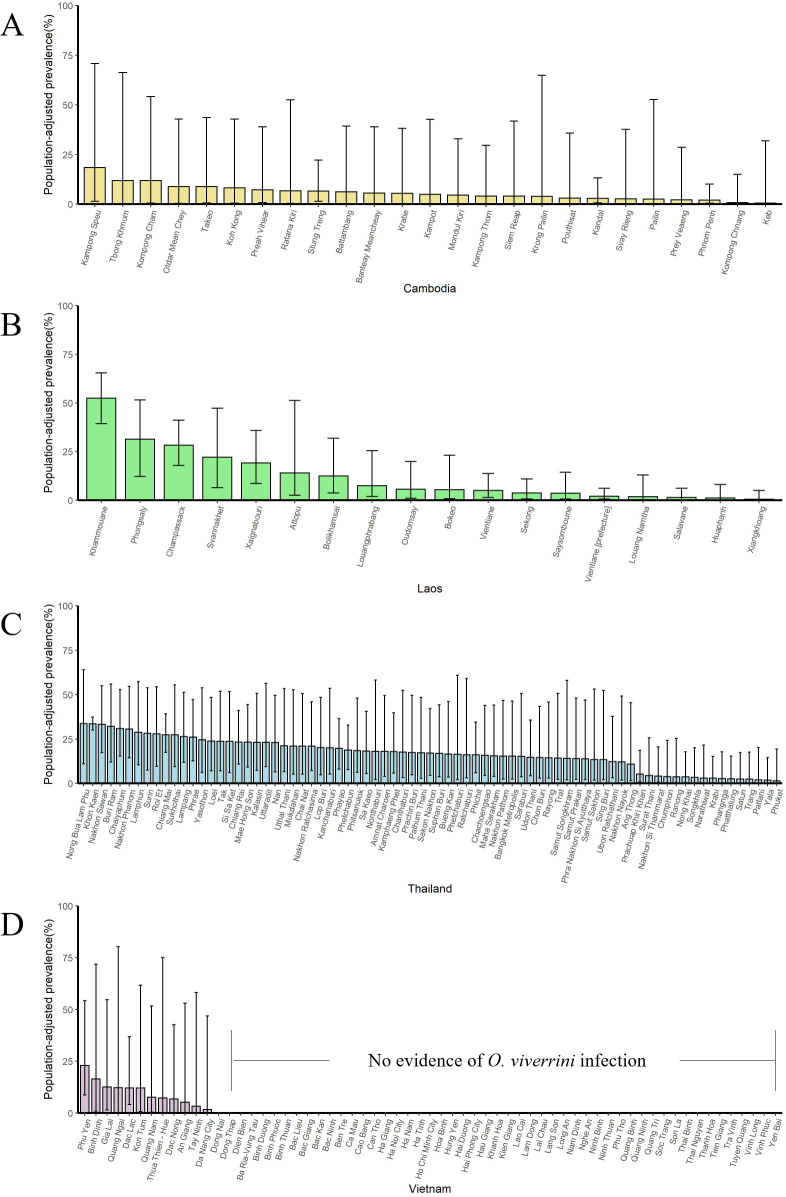
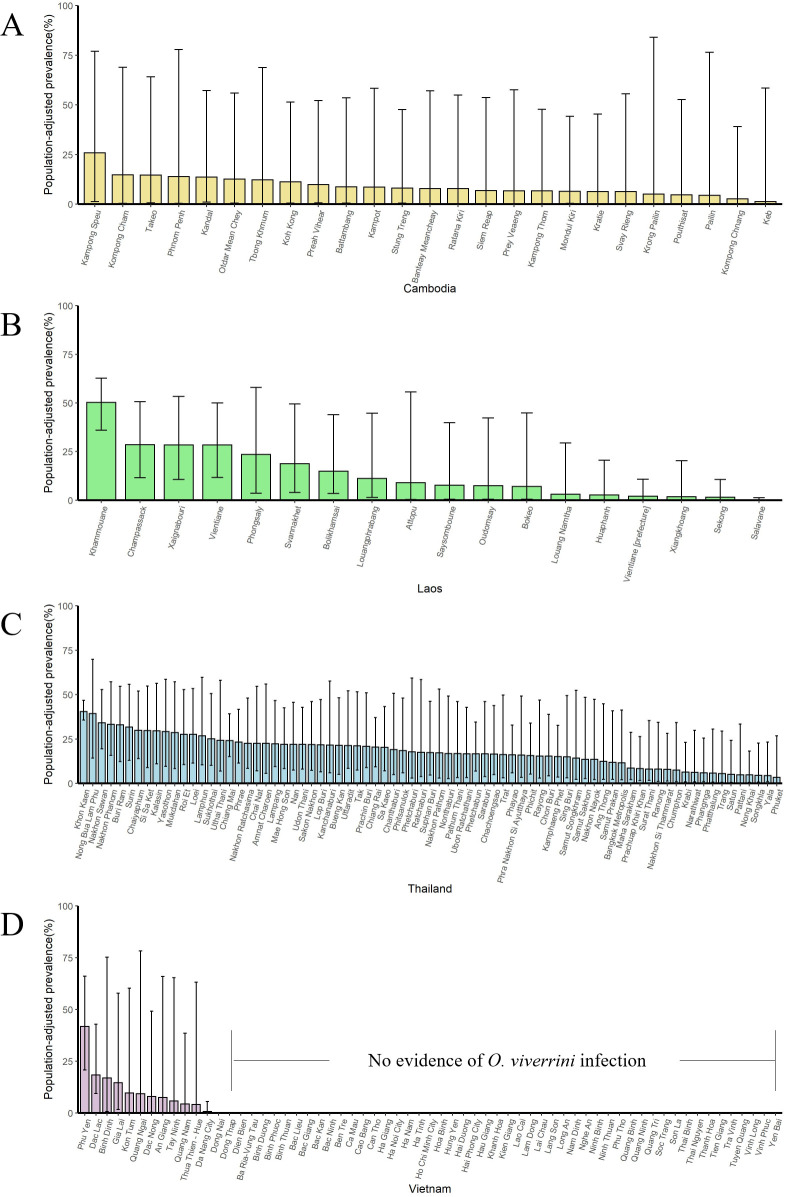
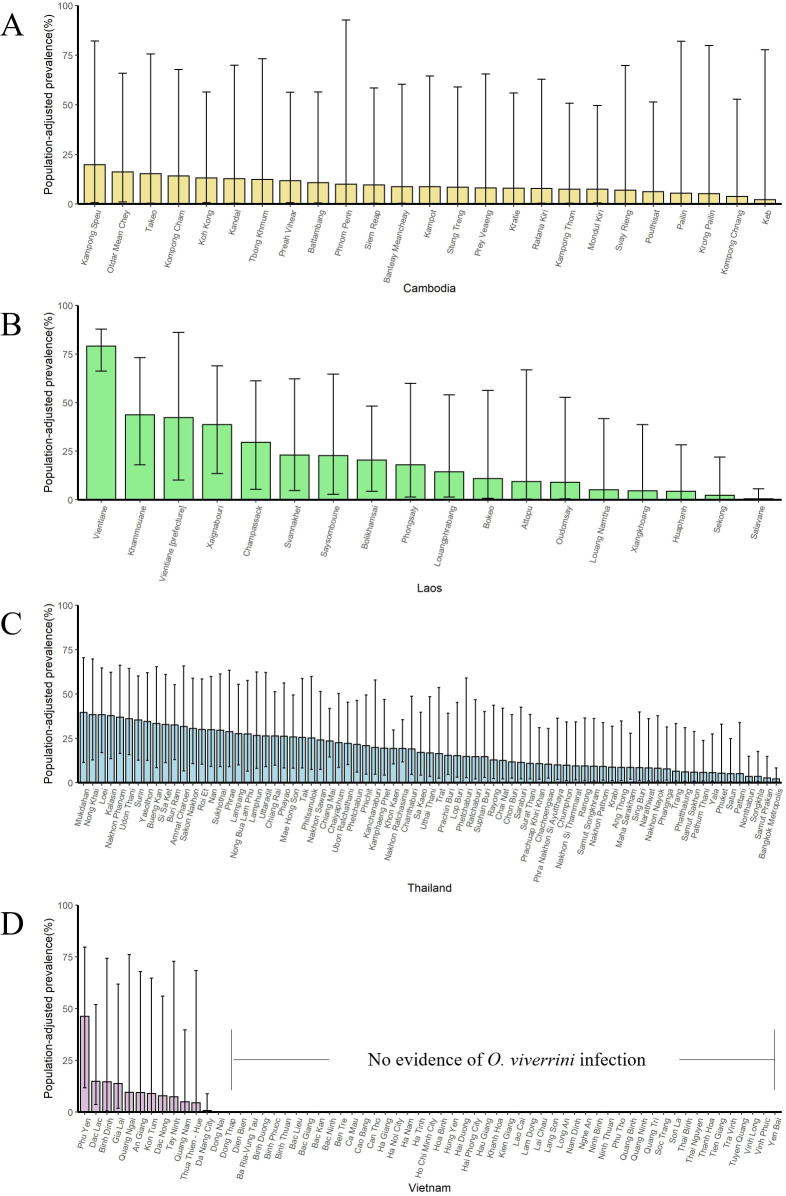
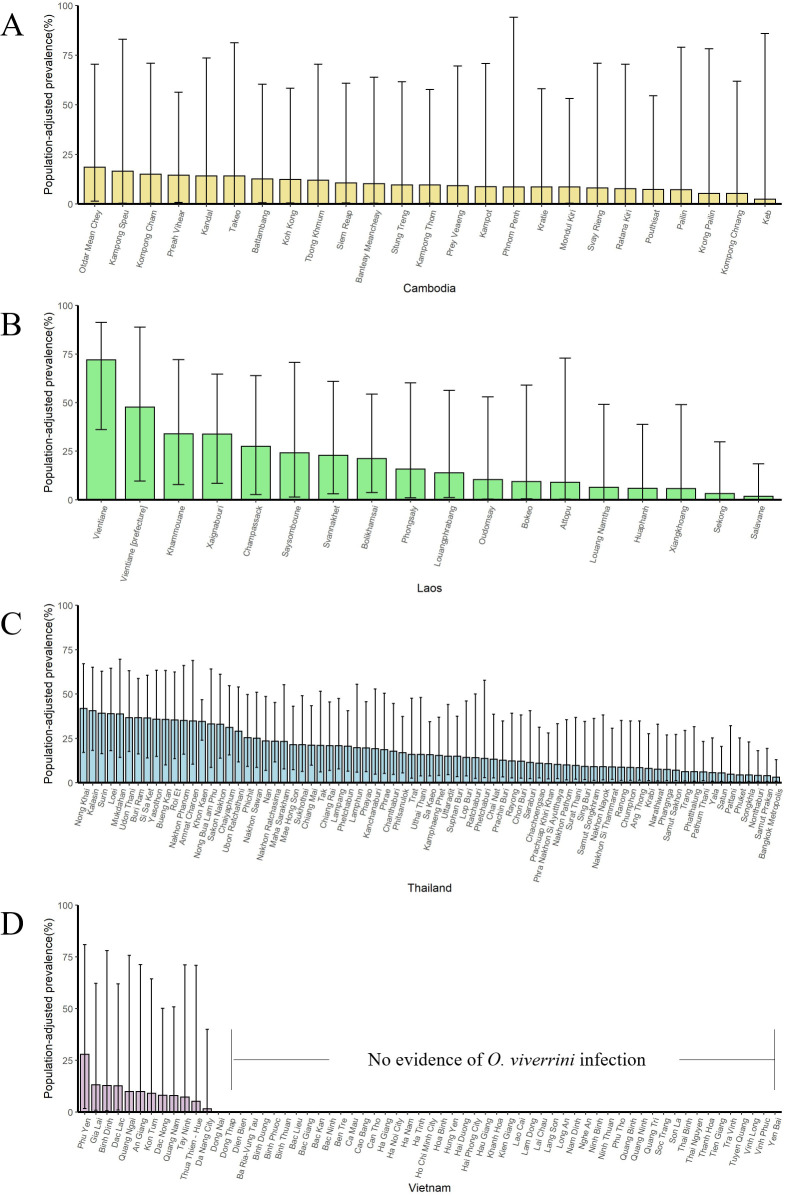
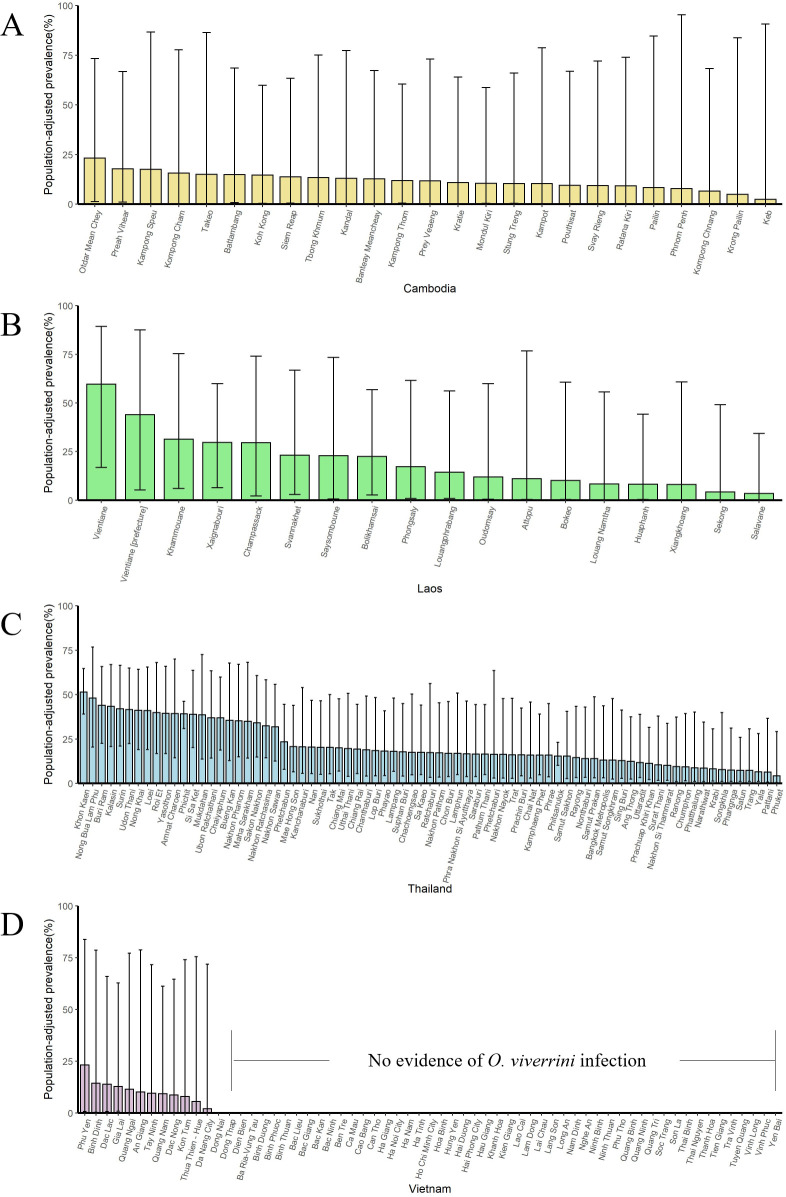
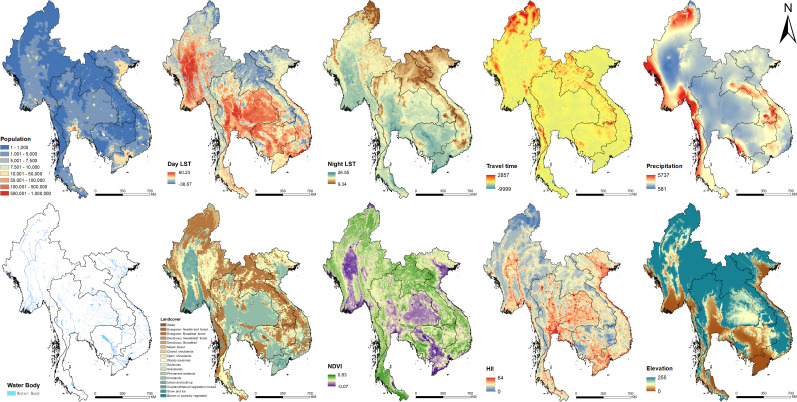
Opisthorchiasis is an overlooked danger to Southeast Asia. High-resolution disease risk maps are critical but have not been available for Southeast Asia. Georeferenced disease data and potential influencing factor data were collected through a systematic review of literatures and open-access databases, respectively. Bayesian spatial-temporal joint models were developed to analyze both point- and area-level disease data, within a logit regression in combination of potential influencing factors and spatial-temporal random effects. The model-based risk mapping identified areas of low, moderate, and high prevalence across the study region. Even though the overall population-adjusted estimated prevalence presented a trend down, a total of 12.39 million (95% Bayesian credible intervals [BCI]: 10.10-15.06) people were estimated to be infected with O. viverrini in 2018 in four major endemic countries (i.e., Thailand, Laos, Cambodia, and Vietnam), highlighting the public health importance of the disease in the study region. The high-resolution risk maps provide valuable information for spatial targeting of opisthorchiasis control interventions.

Keywords: Southeast Asia; bayesian spatial-temporal models; epidemiology; global health; human; liver fluke; opisthorchiasis; opithorchis viverrini; risk mapping.


Conflict of interest statement

TZ, YF, PD, SS, VK, CN, MQ, YH, YL No competing interests declared

Figures

Figure 1.
Figure 1.. Data search and selection flow chart.
Figure 1—figure supplement 1.
Figure 1—figure supplement 1.. Study protocol.
Figure 2.
Figure 2.. Survey locations and observed prevalence of O. viverrini infection in endemic countries of Southeast Asia.
(A) 1978–1982, (B) 1983–1987, (C) 1988–1992, (D) 1993–1997, (E) 1998–2002, (F) 2003–2007, (G) 2008–2012, and (H) 2013–2018.
Figure 2—figure supplement 1.
Figure 2—figure supplement 1.. Result of quality assessment of eligible studies.
Figure 3.
Figure 3.. Model-based estimated risk maps of O. viverrini infection in endemic countries of Southeast Asia in different years.
Estimated prevalence based on the median of the posterior estimated distribution of infection risk in (A) 1978, (B) 1983, (C) 1988, (D) 1993, (E) 1998, (F) 2003, (G) 2008, (H) 2013, and (I) 2018.
Figure 3—figure supplement 1.
Figure 3—figure supplement 1.. Model-based estimated risk maps of O. viverrini infection in 2018 under different values assigned to prevalence for surveys only reported prevalence in intervals.
(A) The midpoint values of the intervals, (B) the lower limits, and (C) the upper limits of the intervals were assigned to prevalence.
Figure 4.
Figure 4.. The estimation uncertainty in endemic countries of Southeast Asia in different years.
(A) 1978, (B) 1983, (C) 1988, (D) 1993, (E) 1998, (F) 2003, (G) 2008, (H) 2013, and (I) 2018.
Figure 5.
Figure 5.. Changes of O. viverrini infection risk across time periods.
Changes were calculated by the median of the posterior estimated distribution of infection risk for the latter time period minus that for the former time period divided by that for the former time period. The risk changes (A) between 1978 and 2018; (B) between 1978 and 1983; (C) between 1983 and 1988; (D) between 1988 and 1993; (E) between 1993 and 1998; (F) between 1998 and 2003; (G) between 2003 and 2008; (H) between 2008 and 2013; and (I) between 2013 and 2018 (source data: Figure 5—source data 1).
Figure 6.
Figure 6.. Trends in estimated prevalence of O. viverrini infection in Southeast Asia.
Figure 6—figure supplement 1.
Figure 6—figure supplement 1.. The population-adjusted estimated prevalence (median ± 95% BCI) in 2018 in four countries at administrative division of level 1.
(A) Cambodia, (B) Laos, (C) Thailand, and (D) Vietnam.
Figure 6—figure supplement 2.
Figure 6—figure supplement 2.. The population-adjusted estimated prevalence (median ± 95% BCI) in 2013 in four countries at administrative division of level 1.
(A) Cambodia, (B) Laos, (C) Thailand, and (D) Vietnam.
Figure 6—figure supplement 3.
Figure 6—figure supplement 3.. The population-adjusted estimated prevalence (median ± 95% BCI) in 2008 in four countries at administrative division of level 1.
(A) Cambodia, (B) Laos, (C) Thailand, and (D) Vietnam.
Figure 6—figure supplement 4.
Figure 6—figure supplement 4.. The population-adjusted estimated prevalence (median ± 95% BCI) in 2003 in four countries at administrative division of level 1.
(A) Cambodia, (B) Laos, (C) Thailand, and (D) Vietnam.
Figure 6—figure supplement 5.
Figure 6—figure supplement 5.. The population-adjusted estimated prevalence (median ± 95% BCI) in 1998 in four countries at administrative division of level 1.
(A) Cambodia, (B) Laos, (C) Thailand, and (D) Vietnam.
Figure 6—figure supplement 6.
Figure 6—figure supplement 6.. The population-adjusted estimated prevalence (median ± 95% BCI) in 1993 in four countries at administrative division of level 1.
(A) Cambodia, (B) Laos, (C) Thailand, and (D) Vietnam.
Figure 6—figure supplement 7.
Figure 6—figure supplement 7.. The population-adjusted estimated prevalence (median ± 95% BCI) in 1988 in four countries at administrative division of level 1.
(A) Cambodia, (B) Laos, (C) Thailand, and (D) Vietnam.
Figure 6—figure supplement 8.
Figure 6—figure supplement 8.. The population-adjusted estimated prevalence (median ± 95% BCI) in 1983 in four countries at administrative division of level 1.
(A) Cambodia, (B) Laos, (C) Thailand, and (D) Vietnam.
Figure 6—figure supplement 9.
Figure 6—figure supplement 9.. The population-adjusted estimated prevalence (median ± 95% BCI) in 1978 in four countries at administrative division of level 1.
(A) Cambodia, (B) Laos, (C) Thailand, and (D) Vietnam.
Figure 7.
Figure 7.. Images of spatial covariates used in the present study.

References

    1. Andrews RH, Sithithaworn P, Petney TN. Opisthorchis viverrini: an underestimated parasite in world health. Trends in Parasitology. 2008;24:497–501. doi: 10.1016/j.pt.2008.08.011. - DOI - PMC - PubMed
    1. Aung WPP, Htoon TT, Tin HH, Thinn KK, Sanpool O, Jongthawin J, Sadaow L, Phosuk I, Rodpai R, Intapan PM, Maleewong W. First report and molecular identification of Opisthorchis viverrini infection in human communities from lower Myanmar. PLOS ONE. 2017;12:e0177130. doi: 10.1371/journal.pone.0177130. - DOI - PMC - PubMed
    1. Banerjee S, Carlin BP, Gelfand AE. Hierarchical Modeling and Analysis for Spatial Data. Second Edition. Boca Raton: Chapman & Hall/CRC; 2014.
    1. Cameletti M, Lindgren F, Simpson D, Rue H. Spatio-temporal modeling of particulate matter concentration through the SPDE approach. AStA Advances in Statistical Analysis. 2013;97:109–131. doi: 10.1007/s10182-012-0196-3. - DOI
    1. Chai JY, Yong TS, Eom KS, Min DY, Shin EH, Banouvong V, Insisiengmay B, Insisiengmay S, Phommasack B, Rim HJ. Prevalence of the intestinal flukes Haplorchis taichui and H. yokogawai in a mountainous area of phongsaly province, lao PDR. The Korean Journal of Parasitology. 2010;48:339–342. doi: 10.3347/kjp.2010.48.4.339. - DOI - PMC - PubMed

Publication types

LinkOut - more resources