

Neonatal Abstinence Syndrome and Maternal Opioid-Related Diagnoses in the US, 2010-2017
- PMID: 33433576
- PMCID: PMC7804920
- DOI: 10.1001/jama.2020.24991
Neonatal Abstinence Syndrome and Maternal Opioid-Related Diagnoses in the US, 2010-2017
Erratum in
-
Error in Supplement.JAMA. 2021 Jun 8;325(22):2316. doi: 10.1001/jama.2021.8098. JAMA. 2021. PMID: 34100883 Free PMC article. No abstract available.
Abstract
Importance: Substantial increases in both neonatal abstinence syndrome (NAS) and maternal opioid use disorder have been observed through 2014.
Objective: To examine national and state variation in NAS and maternal opioid-related diagnoses (MOD) rates in 2017 and to describe national and state changes since 2010 in the US, which included expanded MOD codes (opioid use disorder plus long-term and unspecified use) implemented in International Classification of Disease, 10th Revision, Clinical Modification.
Design, setting, and participants: Repeated cross-sectional analysis of the 2010 to 2017 Healthcare Cost and Utilization Project's National Inpatient Sample and State Inpatient Databases, an all-payer compendium of hospital discharge records from community nonrehabilitation hospitals in 47 states and the District of Columbia.
Exposures: State and year.
Main outcomes and measures: NAS rate per 1000 birth hospitalizations and MOD rate per 1000 delivery hospitalizations.
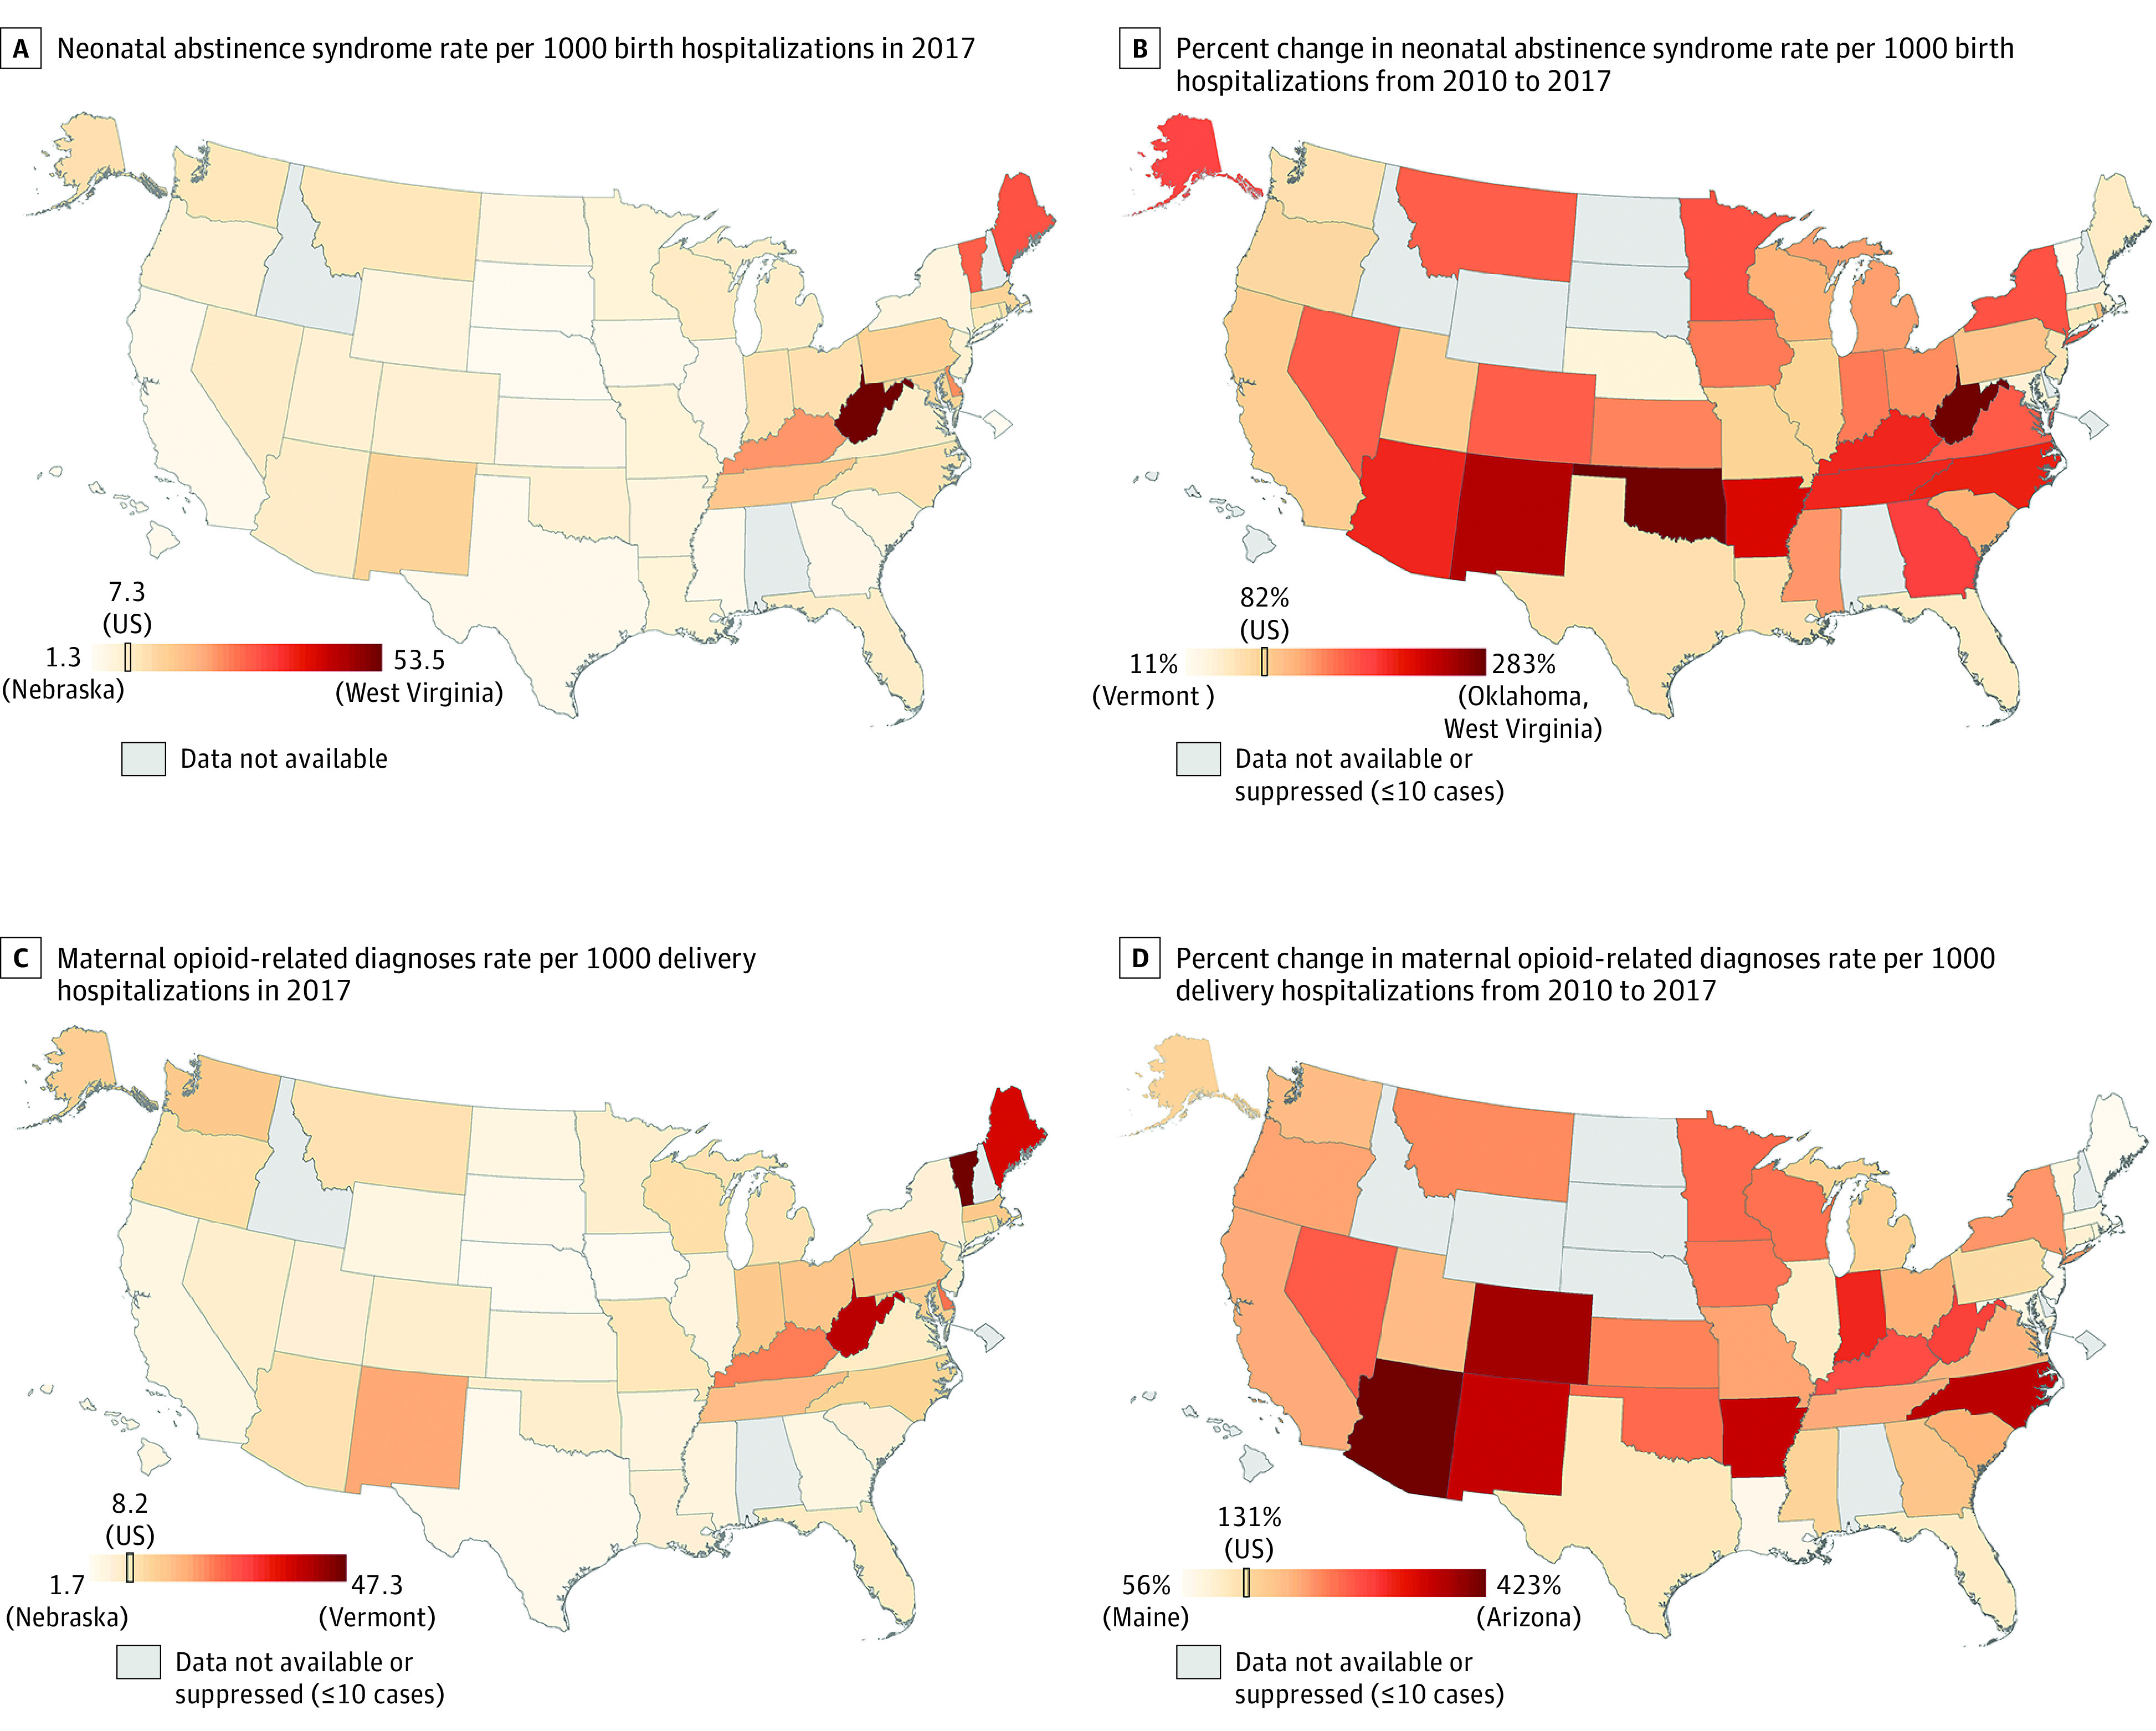
Results: In 2017, there were 751 037 birth hospitalizations and 748 239 delivery hospitalizations in the national sample; 5375 newborns had NAS and 6065 women had MOD documented in the discharge record. Mean gestational age was 38.4 weeks and mean maternal age was 28.8 years. From 2010 to 2017, the estimated NAS rate significantly increased by 3.3 per 1000 birth hospitalizations (95% CI, 2.5-4.1), from 4.0 (95% CI, 3.3-4.7) to 7.3 (95% CI, 6.8-7.7). The estimated MOD rate significantly increased by 4.6 per 1000 delivery hospitalizations (95% CI, 3.9-5.4), from 3.5 (95% CI, 3.0-4.1) to 8.2 (95% CI, 7.7-8.7). Larger increases for MOD vs NAS rates occurred with new International Classification of Disease, 10th Revision, Clinical Modification codes in 2016. From a census of 47 state databases in 2017, NAS rates ranged from 1.3 per 1000 birth hospitalizations in Nebraska to 53.5 per 1000 birth hospitalizations in West Virginia, with Maine (31.4), Vermont (29.4), Delaware (24.2), and Kentucky (23.9) also exceeding 20 per 1000 birth hospitalizations, while MOD rates ranged from 1.7 per 1000 delivery hospitalizations in Nebraska to 47.3 per 1000 delivery hospitalizations in Vermont, with West Virginia (40.1), Maine (37.8), Delaware (24.3), and Kentucky (23.4) also exceeding 20 per 1000 delivery hospitalizations. From 2010 to 2017, NAS and MOD rates increased significantly for all states except Nebraska and Vermont, which only had MOD increases.
Conclusions and relevance: In the US from 2010 to 2017, estimated rates of NAS and MOD significantly increased nationally and for the majority of states, with notable state-level variation.
Conflict of interest statement
Figures
Comment in
-
US Hospital Data About Neonatal Abstinence Syndrome and Maternal Opioid-Related Diagnoses.JAMA. 2021 May 25;325(20):2119-2120. doi: 10.1001/jama.2021.4510. JAMA. 2021. PMID: 34032837 No abstract available.
References
Publication types
MeSH terms
LinkOut - more resources
Full Text Sources
Other Literature Sources
Medical
