. 2021 Mar 1;218(3):e20202135.
doi: 10.1084/jem.20202135.

Neuroinvasion of SARS-CoV-2 in human and mouse brain

Affiliations

Neuroinvasion of SARS-CoV-2 in human and mouse brain

Eric Song et al. J Exp Med. .

Abstract

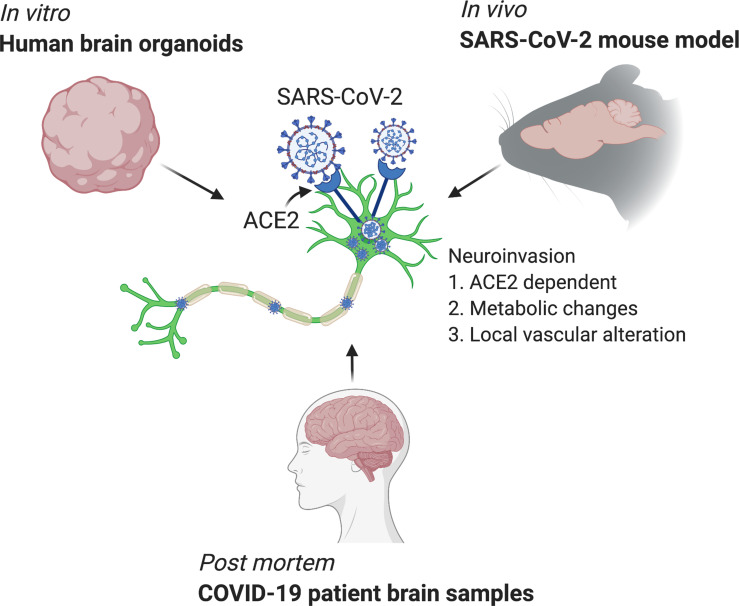
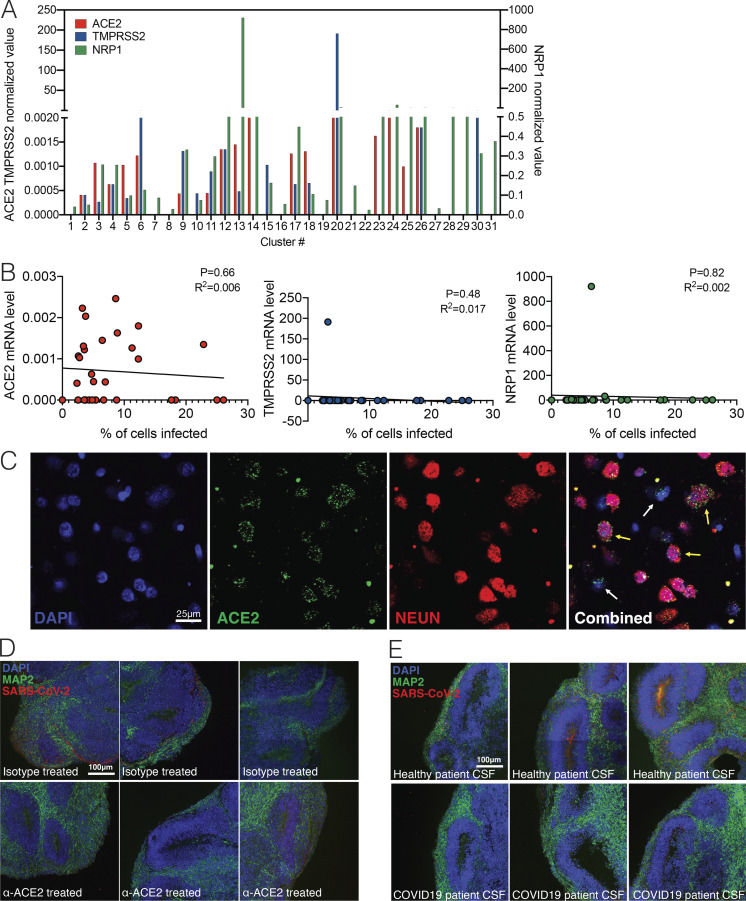
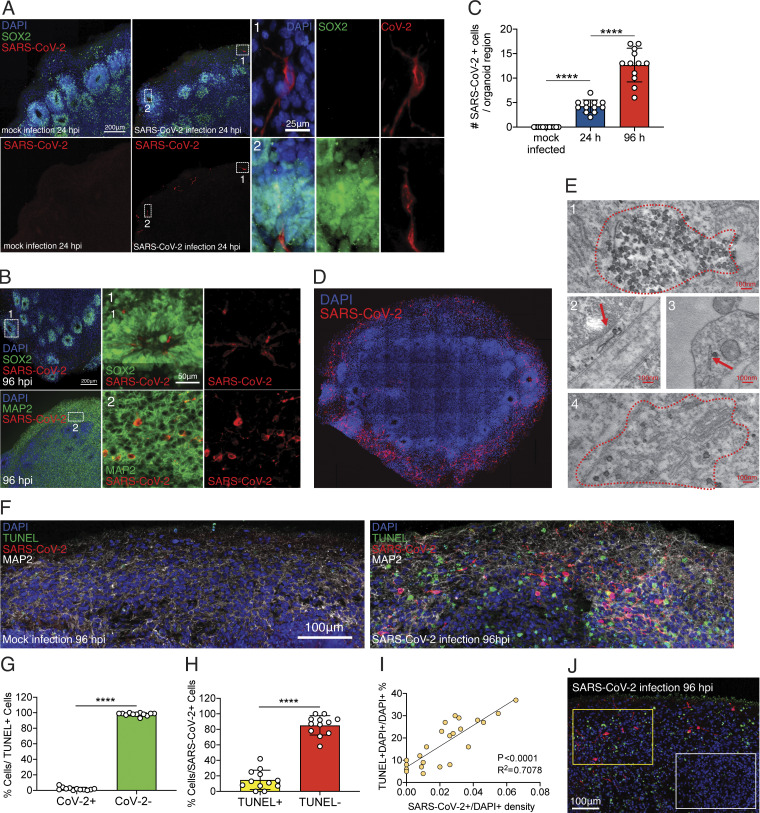
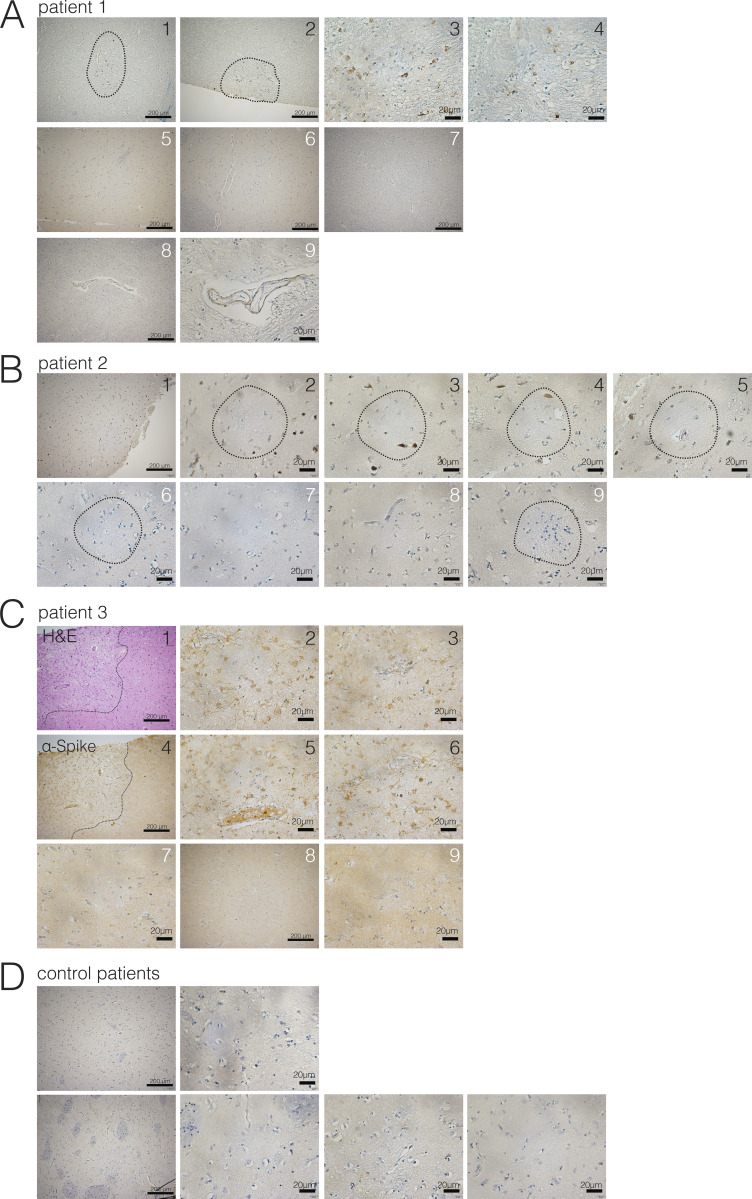
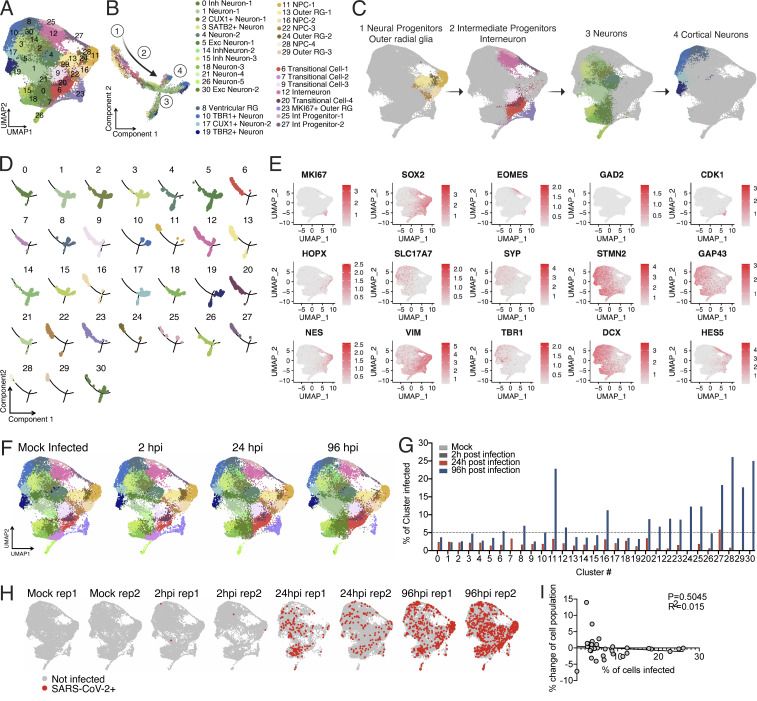
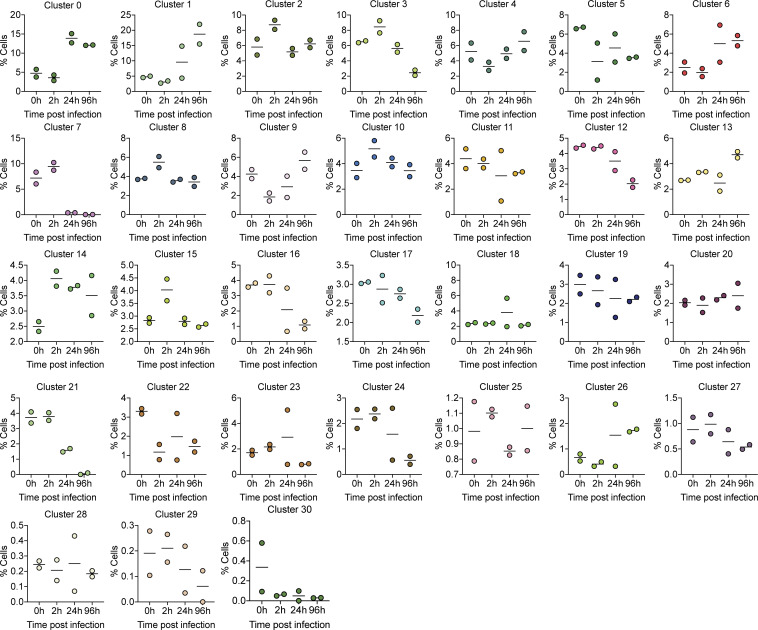
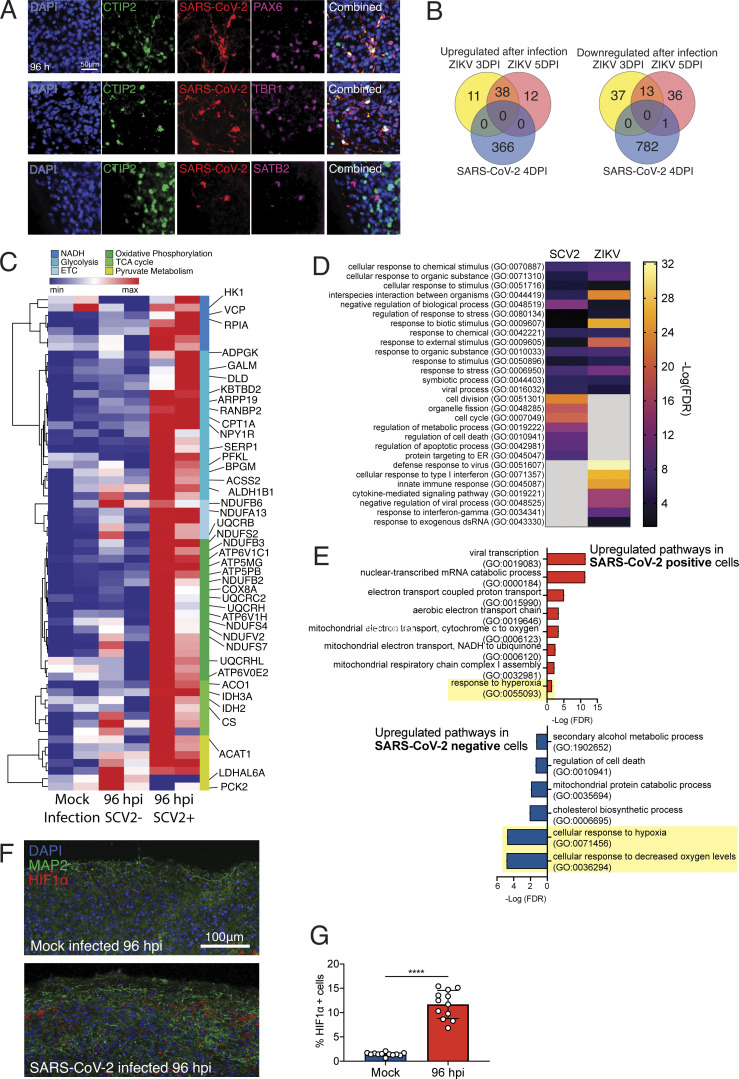
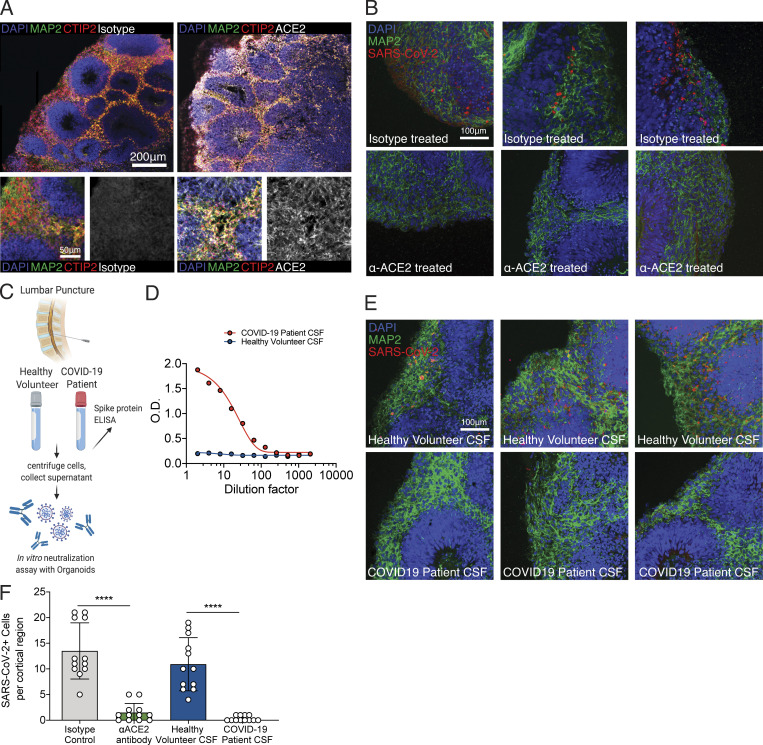
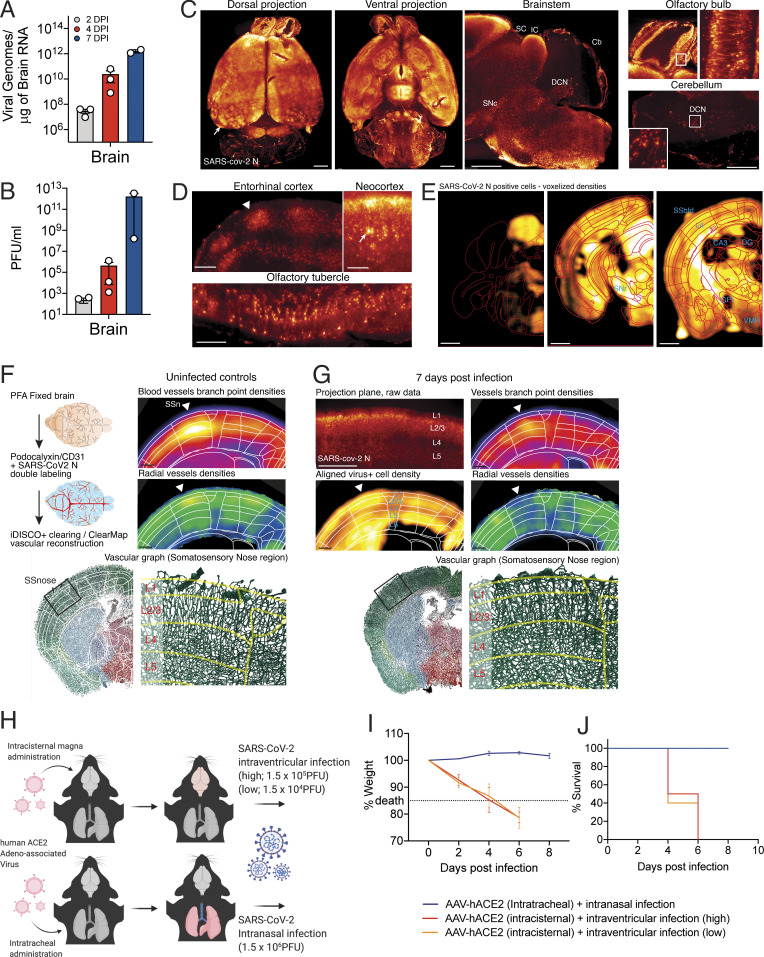
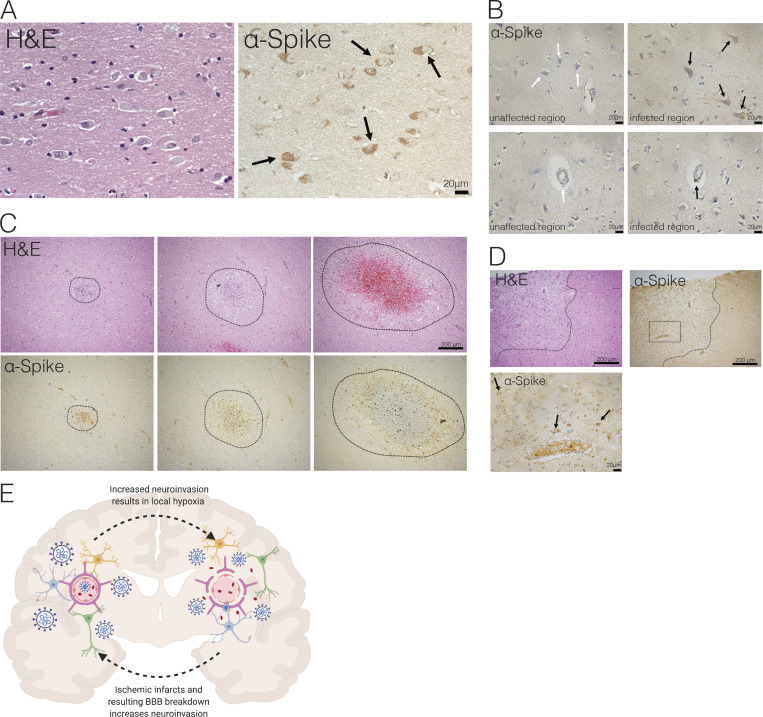
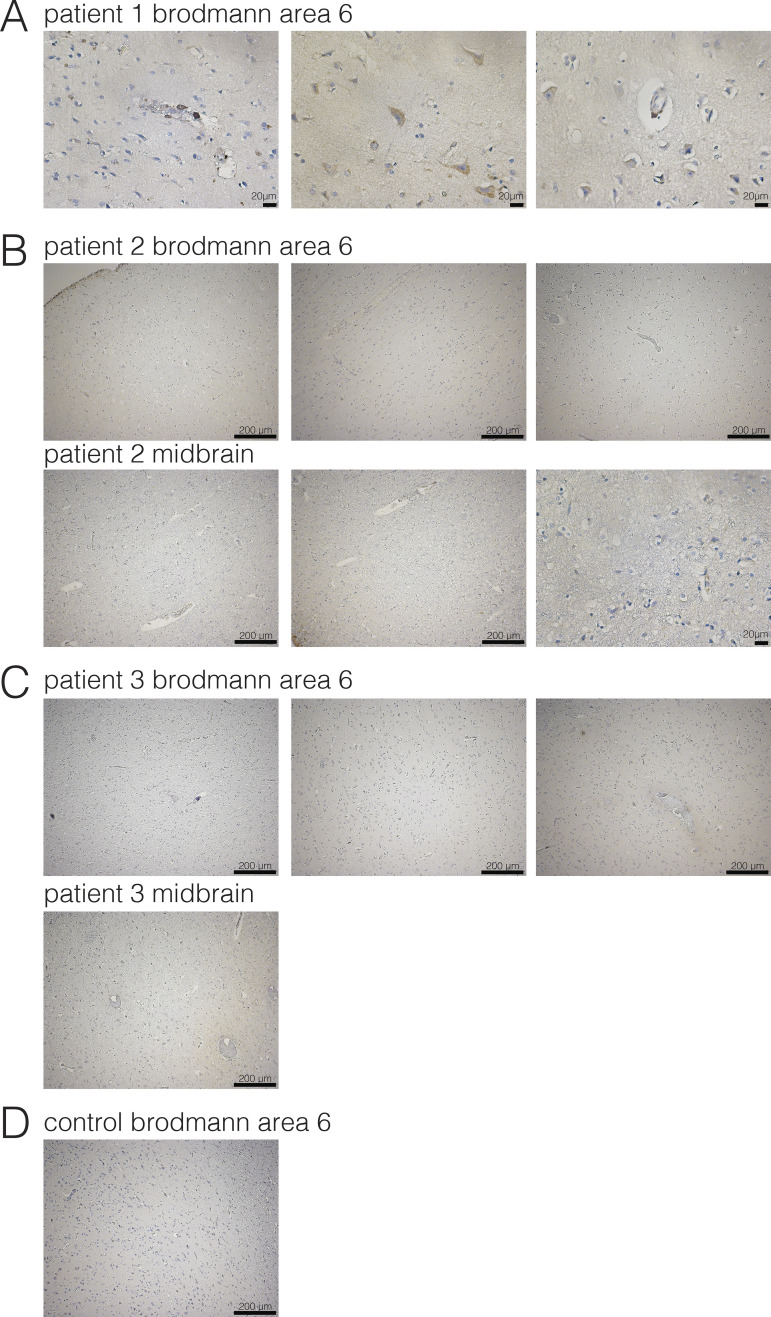
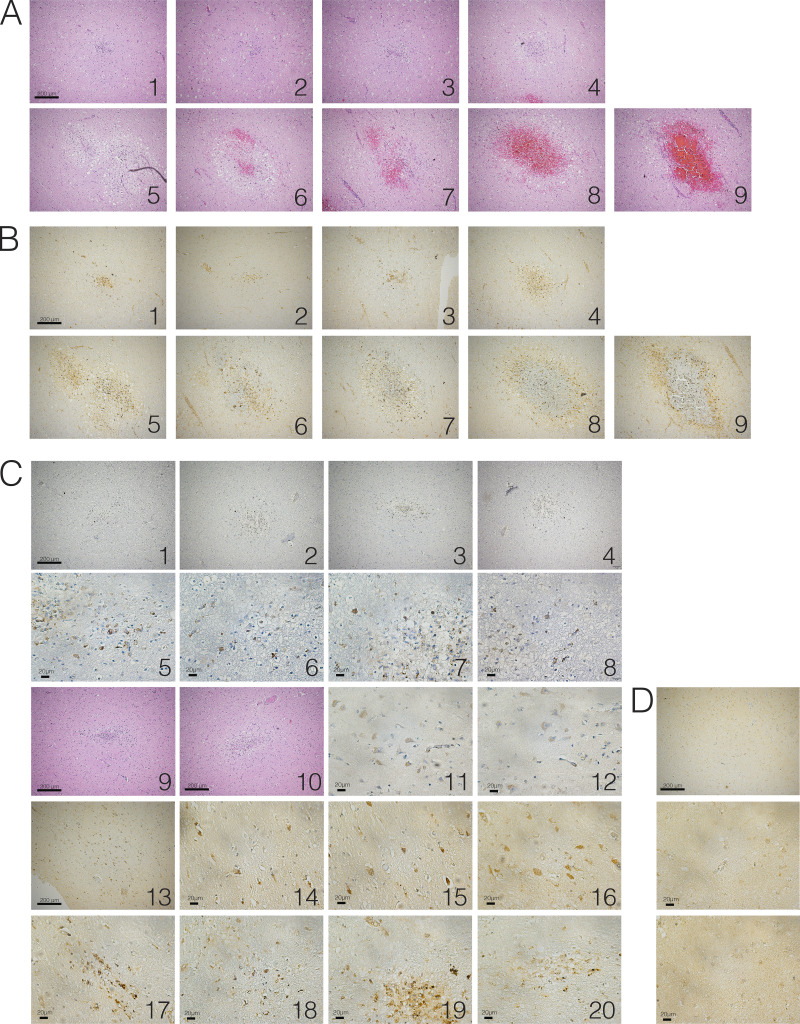
Although COVID-19 is considered to be primarily a respiratory disease, SARS-CoV-2 affects multiple organ systems including the central nervous system (CNS). Yet, there is no consensus on the consequences of CNS infections. Here, we used three independent approaches to probe the capacity of SARS-CoV-2 to infect the brain. First, using human brain organoids, we observed clear evidence of infection with accompanying metabolic changes in infected and neighboring neurons. However, no evidence for type I interferon responses was detected. We demonstrate that neuronal infection can be prevented by blocking ACE2 with antibodies or by administering cerebrospinal fluid from a COVID-19 patient. Second, using mice overexpressing human ACE2, we demonstrate SARS-CoV-2 neuroinvasion in vivo. Finally, in autopsies from patients who died of COVID-19, we detect SARS-CoV-2 in cortical neurons and note pathological features associated with infection with minimal immune cell infiltrates. These results provide evidence for the neuroinvasive capacity of SARS-CoV-2 and an unexpected consequence of direct infection of neurons by SARS-CoV-2.


Conflict of interest statement

Disclosures: M. Gunel reported personal fees from AI Therapeutics outside the submitted work; and reported, "AI Therapeutics is currently sponsoring a clinical trial for a therapeutic, which has no relevance for this study, in COVID-19. I am the Chief Scientific Advisor to AI Therapeutics." C.B. Wilen reported personal fees from ZymoResearch outside the submitted work; in addition, C.B. Wilen had a patent for compounds and compositions for treating, ameliorating, and/or preventing SARS-CoV-2 infection and/or complications thereof pending. S. Haik reported a patent to Method for treating prion diseases (PCT/EP 2019/070457) pending. A. Iwasaki reported "other" from RIGImmune and grants from Spring Discovery during the conduct of the study; in addition, A. Iwasaki had a patent to 14/776,463 pending, a patent for a T cell-based immunotherapy for central nervous system viral infections and tumors pending, and a patent to manipulation of meningeal lymphatic vasculature for brain and CNS tumor therapy pending. No other disclosures were reported.

Figures

None
Graphical abstract
Figure 1.
Figure 1.
Pluripotency of Y6 line. (A) Sample images of cell types of three germ layers in teratomas following transplantation to Rag2−/−GammaC−/− mice. Scale bar = 100 µm. (B) Sample image showing normal karyotype for Y6 line. Scale bars = 100 µm.
Figure S1.
Figure S1.
SARS-CoV-2 infection in hPSC-derived NPCs and 9-wk organoids. (A) Representative images of immunostaining of hNPCs with TUNEL staining, anti-Nestin, and anti–SARS-CoV-2 nucleocapsid antibody 0, 6, 12, and 48 hpi. Scale bar = 50 µm. (B) RT-PCR amplification of COVID-genome from infected hNPC cells. (C) Images of FOXG1 and PAX6 staining for dorsal neuron characterization. (D) Sample images of immunostaining of 9-wk organoids with DAPI, anti-MAP2, and anti–SARS-CoV-2 antibody 24 hpi after SARS-CoV-2 or mock infection. Note the perinuclear and neuritic staining of SARS-CoV-2 in the MAP2+ cell. Dashed white box corresponds to SARS-CoV-2+ and MAP2+ single-cell in 24-hpi organoid. Scale bar = 200 µm for zoomed-out images and 25 µm for zoomed-in images. (E) Sample images of immunostaining of 9-wk organoids with DAPI, anti-MAP2, or anti-Sox2 and anti–SARS-CoV-2 antibody 96 hpi after SARS-CoV-2 or mock infection. Dashed white box 1 corresponds to “1 panel” showing magnified SARS-COV-2+/SOX2 cell in 96-hpi organoid. Dashed white box 2 corresponds to 2 panel showing SARS-COV-2+ and MAP2+ cell in 96-hpi organoid; 3 panel shows SOX2+/SARS-CoV-2+ cell in 96-hpi organoid. Scale bar = 200 µm for zoomed-out images and 25 µm for zoomed-in images. (F) Quantification of number of SARS-CoV-2+ cells/field of view that are either SOX2+ or MAP2+ in mock, 24-hpi, and 96-hpi organoids. (G) Organoids were stained with TUNEL to evaluate cell death 24 and 96 hpi. n = 4 organoids per condition, 12 cortical regions from two iPSC lines. Experiments were performed twice for reproducibility. Scale bar = 100 µm.
Figure S2.
Figure S2.
SARS-CoV-2 infection depends on hACE2. (A) Expression levels of ACE2, TMPRSS2, and NRP1 from single-cell RNA-seq data. (B) Correlation of ACE2, TMPRSS2, and NRP1 expression to percentage of cells infected in each cluster. (C) Imaging of postmortem COVID-19 patient brains stained with ACE2 and NEUN. Scale bar = 25 µm. (D) Uncropped images of ACE2 antibody–treated organoids shown in Fig. 3 B. Scale bar = 100 µm. (E) Uncropped images of CSF-treated organoids shown in Fig. 3 E. All experiments were performed with unique organoid, n = 4 per condition, with images from n = 12 cortical regions with two IPSC lines. Experiments were performed twice for reproducibility. Scale bar = 100 µm.
Figure 2.
Figure 2.
SARS-CoV-2 infects human brain organoids and induces cell death. Human brain organoids were infected with SARS-CoV-2 and collected 24 or 96 hpi to analyze for different cellular markers. (A) Images of brain organoids looking at SARS-CoV-2 infection (in red) 24 hpi (see Fig. S2 C for additional images). Scale bar = 200 µm for zoomed-out images and 25 µm for zoomed-in images. (B) Images of brain organoids looking at SARS-CoV-2 infection (in red) 96 hpi (see Fig. S2 D for additional images). Scale bar = 200 µm for zoomed-out images and 50 µm for zoomed-in images. (C) Quantification of SARS-CoV-2–positive cells in a single microscope image of cortical region of organoids (A and B). (D) Tiled image of 96-hpi organoid. (E) Electron microscopy image of SARS-CoV-2 viral particles in brain organoids (see Fig. S3 for uncropped and additional images). Scale bar = 100 nm. (F) Organoids were stained with TUNEL to evaluate cell death at 96 hpi. Scale bar = 100 µm. (G) Quantification of SARS-CoV-2 and TUNEL double-positive (yellow) or SARS-CoV-2–negative, TUNEL-positive (green) cells over total TUNEL-positive cells. (H) Quantification of SARS-CoV-2 and TUNEL double-positive (yellow) or SARS-CoV-2–positive, TUNEL-negative (red) cells over total SARS-CoV-2–positive cells. (I) Correlation between the frequency of TUNEL-positive cells and presence SARS-CoV-2 in different regions of the organoid. (J) Representative image of TUNEL and SARS-CoV-2 staining showing high-density SARS-CoV-2 region (yellow box) and low-density SARS-CoV-2 region (white box) in the same plane. Scale bar = 100 µm. All experiments were performed with unique organoid, n = 4 per condition, from the same culturing batch, with images from n = 12 cortical regions with two IPSC lines, and Student’s t test was performed (****, P < 0.0001). Experiments were performed twice independently for reproducibility.
Figure S3.
Figure S3.
Evidence of neuroinvasion in postmortem COVID-19 patient brains (caudate). FFPE sections of brain tissue from COVID-19 patients were stained using H&E or anti–SARS-CoV-2-spike antibody. (A) Images of regions of the caudate of patient 1. White numbers indicate unaffected regions, and black numbers indicate regions with infected cells. Dotted lines around 1 and 2 indicate ischemic infarcts with virus staining. (B) Images of regions of the caudate of patient 2. White numbers indicate unaffected regions, and black numbers indicate regions with infected cells. Dotted circles indicate ischemic infarcts. (C) Images of regions of the caudate of patient 3. White numbers indicate unaffected regions, and black numbers indicate regions with infected cells. Dotted lines around 1 and 4 indicate ischemic infarcts with virus staining. Images 1, 4, and 5 are shown in Fig. 4. (D) Example images from control patient brains. Scale bar = 200 µm for zoomed-out images and 20 µm for zoomed-in images.
Figure 3.
Figure 3.
Single cell RNA-seq of SARS-CoV-2 infected organoids. (A) UMAP projection of cells from single cell sequencing. (B) Monocle trajectory analysis resulted in four distinct states of cells from the organoid. (C) The four major clusters consisted of the following: (1) Neural progenitor, outer radial glia like cells; (2) intermediate progenitor, interneurons; (3) neurons; and (4) cortical neurons. (D) Monocle projection of individual clusters. (E) Heatmap of commonly used genes for identification of cell subtypes in human brain organoids. (F) UMAP projection of organoids depending on infection status. (G) Percentage of infected cells in each cluster. (H) UMAP heatmap of SARS-CoV-2 transcript + cells separated by infection status. (I) Correlation between % change of cell population versus % of cells infected in each cluster. Single cell data were produced by two separate organoids (see F) to ensure reproducibility.
Figure 4.
Figure 4.
Frequency of each cell cluster from single-cell RNA-seq. Graphs display the percentage frequency of each cluster during a given infection status, 0, 2, 24, and 96 hpi.
Figure 5.
Figure 5.
Neuronal cells undergo a unique metabolic response to SARS-CoV-2 infections. Brain organoids were infected with SARS-CoV-2 and sequenced with 10× single-cell sequencing strategies. (A) Validation of neuronal subtypes using CTIP2, PAX6, and TBR1 antibodies for confocal imaging. Scale bar = 50 µm. (B) DEGs from brain organoids infected with ZIKV (Watanabe et al., 2017) were compared with DEGs from SARS-CoV-2–infected organoids. (D) Enriched gene ontology terms (http://www.geneontology.org) for up-regulated genes from B. (E) Enriched gene ontology terms in SARS-CoV-2–infected cells (top) and SARS-CoV-2–negative bystander cells from 96-hpi organoids (bottom). (C) Heatmap of genes from metabolic pathways. (F) HIF1A staining of brain organoids that were mock infected versus 96 hpi. Scale bar = 100 µm. (G) Quantification of HIF1A-positive cells in SARS-CoV-2–infected organoids. Single-cell RNA-seq was performed in duplicate with one IPSC line (Y6) for reproducibility. HIF1A staining was performed with unique organoid, n = 4 per condition, from the same culturing batch, with images from n = 12 cortical regions with two IPSC lines, and Student’s t test was performed (****, P < 0.0001). Experiments were performed twice for reproducibility.
Figure 6.
Figure 6.
SARS-CoV-2 neural infection depends on ACE2 and can be neutralized by anti-spike antibodies found in CSF of COVID-19 patients. (A) Immunofluorescence staining of ACE2 in brain organoids. Scale bar = 200 µm for zoomed-out images and 50 µm for zoomed-in images. (B) Immunofluorescence staining of organoids preincubated with isotype antibodies (top row) or anti-ACE2 antibodies (bottom row) and infected with SARS-CoV-2. Scale bar = 100 µm. (C) Schematic showing collection of clinical lumbar puncture from patients with and without COVID-19 for assays shown in D–F. (D) Quantification of anti–SARS-CoV-2 spike antibodies present in CSF of healthy versus COVID-19 patient in limiting dilution using ELISA. (E) Immunofluorescence staining of organoids infected with SARS-CoV-2 preincubated with CSF from health patients (top row) or CSF from COVID-19 patients (bottom row). Scale bar = 100 µm. (F) Quantification of figures from C and E. All experiments were performed with unique organoid, n = 4 per condition, from the same culturing batch, with images from n = 12 cortical regions with two IPSC lines, and Student’s t test was performed (****, P < 0.0001). Experiments were performed twice for reproducibility.
Figure 7.
Figure 7.
SARS-CoV-2 replicates efficiently in the brain of mice and can cause CNS-specific lethality. (A–C) Mice expressing human ACE2 under the K18 promoter (K18-hACE2) were infected with SARS-CoV-2 intranasally, and brains of the mice were collected on days 2, 4, and 7 hpi for qPCR (A) or plaque assay (B). (C–E) iDISCO+ whole brain immunolabeling against the nucleocapsid protein of SARS-CoV-2 7 d after an intranasal infection, shown as 300-µm projection planes. (C) Dorsal, ventral, and sagittal projections showing widespread distribution of the virus in the forebrain with patches of high viral density in the cortex (arrow). The virus is not detected in the cerebellum, except for the pial meninges and DCNs. (D) 300-µm-deep projection planes in the cortex showing cortical patches of viral expression (arrowhead), reduced infection of the cells in layer 4, and expression in pyramidal neurons (arrow). (E) ClearMap analysis of the infected cells distribution (n = 3), registered to the Allen Brain Atlas, showing wide distribution of the virus across brain regions, with a few regions with lower densities, among which are dentate gyrus (DG), globus pallidus internal segment (GPi), CA3 hippocampal region, cortical layer 4, and ventromedial hypothalamus (VMH). (F and G) Analysis of the vascular network using ClearMap and iDISCO+ 7 d after intranasal infection by mapping of the vascular network with colabeling of the N protein. Planes at the level of the nose somatosensory cortex are shown. (F) Control uninfected brains. Branch point densities (top panel) peak in controls at layer 4. The density of radially oriented vessels (middle panel) peaks in layers 1, 2, and 3 while decreasing in layers 4, 5, and 6. (G) Brain 7 d after infection. Expression of the N viral protein by neural cells is shown at the level of the nose somatosensory cortex (300-µm projection plane and mapped densities). While branch point densities of vessels still show a peak in layer 4, the normal radial organization of the vessels is not measured in the nose region (arrowhead). Representative render of the vascular graph shows a decrease in vessel orientations in control layers 2 and 3. (H) Schematic of experiment for I and J. Adeno-associated viruses coding for human ACE2 (AAV-hACE2) were injected into the cisterna magna or intratracheally to induce brain-specific or lung-specific expression of hACE2. Brain hACE2–expressing mice were infected with SARS-CoV-2 intraventricularly, and lung hACE2–expressing mice were infected with SARS-CoV-2 intranasally. (I and J) Weight loss curve (I) and survival curve (J) of mice infected with SARS-CoV-2 in the lung (blue) and the brain (red and orange; blue, n = 10; red, n = 4; orange, n = 4). Experiments were performed twice for reproducibility. Scale bars = 1 mm (A and C), 200 µm (B), and 500 µm (D and E). CB, cerebellum; DCN, deep cerebellar nuclei; IC, inferior colliculus; SC, superior colliculus; SN, substantia nigra (reticulata or compacta); SS, somatosensory cortex, nose of barrel field.
Figure 8.
Figure 8.
Evidence of neuroinvasion in postmortem COVID-19 patient brains. FFPE sections of brain tissue from COVID-19 patients stained with H&E and anti–SARS-CoV-2-spike antibody. (A) Image of cortical neurons positive for SARS-CoV-2 (black arrows). Scale bar = 20 µm. (B) Images of unaffected regions (left) and infected regions (right) demonstrating infection of neurons (top row) and microvasculature (bottom row). Scale bar = 20 µm. (C) Ischemic infarcts found at different stages stained with H&E (top row) and SARS-CoV-2-spike antibody (bottom row). (D) Ischemic region (outlined with dotted line) with positive staining focused around ischemic infarct. Bottom image shows zoomed-in image indicated by dotted box in top image, and black arrows indicate infected neurons in the region. (E) Schematic of hypothesized consequences of SARS-CoV-2 neuroinvasion.
Figure S4.
Figure S4.
Evidence of neuroinvasion in postmortem COVID-19 patient brains (Brodmann area 6 and midbrain). FFPE sections of brain tissue from COVID-19 patients were stained using anti–SARS-CoV-2-spike antibody. (A) Images of regions of Brodmann area 6 of patient 1. Images are also shown in Fig. 4. (B) Images of regions of patient 2. (C) Images of regions of the caudate of patient 3. (D) Example image from control patient brains. Scale bar = 200 µm for zoomed-out images and 20 µm for zoomed-in images.
Figure S5.
Figure S5.
Evidence of SARS-CoV-2 neuroinvasion–associated ischemic infarcts. FFPE sections of brain tissue from COVID-19 patients were stained using H&E or anti–SARS-CoV-2-spike antibody. (A) H&E images of ischemic infarcts at different stages (1, earliest, to 9, latest). (B) SARS-CoV-2–stained images of ischemic infarcts at different stages (1, earliest, to 9, latest). Each number corresponds to H&E image in A. (C) Images of SARS-CoV-2–positive regions in brains of COVID-19 patients. (D) Example image from control patient brain. Scale bar = 200 µm for zoomed-out images and 20 µm for zoomed-in images.

Update of

  • Neuroinvasion of SARS-CoV-2 in human and mouse brain.
    Song E, Zhang C, Israelow B, Lu-Culligan A, Prado AV, Skriabine S, Lu P, Weizman OE, Liu F, Dai Y, Szigeti-Buck K, Yasumoto Y, Wang G, Castaldi C, Heltke J, Ng E, Wheeler J, Alfajaro MM, Levavasseur E, Fontes B, Ravindra NG, Van Dijk D, Mane S, Gunel M, Ring A, Kazmi SAJ, Zhang K, Wilen CB, Horvath TL, Plu I, Haik S, Thomas JL, Louvi A, Farhadian SF, Huttner A, Seilhean D, Renier N, Bilguvar K, Iwasaki A. Song E, et al. bioRxiv [Preprint]. 2020 Sep 8:2020.06.25.169946. doi: 10.1101/2020.06.25.169946. bioRxiv. 2020. Update in: J Exp Med. 2021 Mar 1;218(3):e20202135. doi: 10.1084/jem.20202135. PMID: 32935108 Free PMC article. Updated. Preprint.

References

    1. Amin, N.D., and Paşca S.P.. 2018. Building Models of Brain Disorders with Three-Dimensional Organoids. Neuron. 100:389–405. 10.1016/j.neuron.2018.10.007 - DOI - PubMed
    1. Baig, A.M., and Sanders E.C.. 2020. Potential neuroinvasive pathways of SARS-CoV-2: Deciphering the spectrum of neurological deficit seen in coronavirus disease-2019 (COVID-19). J. Med. Virol. 92:1845–1857. 10.1002/jmv.26105 - DOI - PMC - PubMed
    1. Blanco-Melo, D., Nilsson-Payant B.E., Liu W.C., Uhl S., Hoagland D., Møller R., Jordan T.X., Oishi K., Panis M., Sachs D., et al. . 2020. Imbalanced Host Response to SARS-CoV-2 Drives Development of COVID-19. Cell. 181:1036–1045.e9. 10.1016/j.cell.2020.04.026 - DOI - PMC - PubMed
    1. Bullen, C.K., Hogberg H.T., Bahadirli-Talbott A., Bishai W.R., Hartung T., Keuthan C., Looney M.M., Pekosz A., Romero J.C., Sillé F.C.M., et al. . 2020. Infectability of human BrainSphere neurons suggests neurotropism of SARS-CoV-2. ALTEX. 37:665–671. 10.14573/altex.2006111 - DOI - PubMed
    1. Cakir, B., Xiang Y., Tanaka Y., Kural M.H., Parent M., Kang Y.J., Chapeton K., Patterson B., Yuan Y., He C.S., et al. . 2019. Engineering of human brain organoids with a functional vascular-like system. Nat. Methods. 16:1169–1175. 10.1038/s41592-019-0586-5 - DOI - PMC - PubMed

Publication types

MeSH terms

Substances