Antagonizing somatostatin receptor subtype 2 and 5 reduces blood glucose in a gut- and GLP-1R-dependent manner
- PMID: 33434183
- PMCID: PMC7934931
- DOI: 10.1172/jci.insight.143228
Antagonizing somatostatin receptor subtype 2 and 5 reduces blood glucose in a gut- and GLP-1R-dependent manner
Abstract
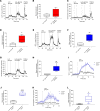
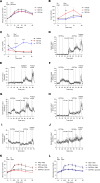
Somatostatin (SS) inhibits glucagon-like peptide-1 (GLP-1) secretion in a paracrine manner. We hypothesized that blocking somatostatin subtype receptor 2 (SSTR2) and 5 (SSTR5) would improve glycemia by enhancing GLP-1 secretion. In the perfused mouse small intestine, the selective SSTR5 antagonist (SSTR5a) stimulated glucose-induced GLP-1 secretion to a larger degree than the SSTR2 antagonist (SSTR2a). In parallel, mice lacking the SSTR5R showed increased glucose-induced GLP-1 secretion. Both antagonists improved glycemia in vivo in a GLP-1 receptor-dependent (GLP-1R-dependent) manner, as the glycemic improvements were absent in mice with impaired GLP-1R signaling and in mice treated with a GLP-1R-specific antagonist. SSTR5a had no direct effect on insulin secretion in the perfused pancreas, whereas SSTR2a increased insulin secretion in a GLP-1R-independent manner. Adding a dipeptidyl peptidase 4 inhibitor (DPP-4i) in vivo resulted in additive effects on glycemia. However, when glucose was administered intraperitoneally, the antagonist was incapable of lowering blood glucose. Oral administration of SSTR5a, but not SSTR2a, lowered blood glucose in diet-induced obese mice. In summary, we demonstrate that selective SSTR antagonists can improve glucose control primarily through the intestinal GLP-1 system in mice.
Keywords: Diabetes; Endocrinology; G protein–coupled receptors; Glucose metabolism; Metabolism.
Conflict of interest statement
Figures


Similar articles
-
Paracrine crosstalk between intestinal L- and D-cells controls secretion of glucagon-like peptide-1 in mice.Am J Physiol Endocrinol Metab. 2019 Dec 1;317(6):E1081-E1093. doi: 10.1152/ajpendo.00239.2019. Epub 2019 Sep 10. Am J Physiol Endocrinol Metab. 2019. PMID: 31503512 Free PMC article.
-
Effects of long-term dipeptidyl peptidase-IV inhibition on body composition and glucose tolerance in high fat diet-fed mice.Life Sci. 2009 Jun 19;84(25-26):876-81. doi: 10.1016/j.lfs.2009.03.022. Epub 2009 Apr 7. Life Sci. 2009. PMID: 19358859
-
Regulation of Endogenous (Male) Rodent GLP-1 Secretion and Human Islet Insulin Secretion by Antagonism of Somatostatin Receptor 5.Endocrinology. 2017 Nov 1;158(11):3859-3873. doi: 10.1210/en.2017-00639. Endocrinology. 2017. PMID: 28938487
-
Cardiovascular Actions and Clinical Outcomes With Glucagon-Like Peptide-1 Receptor Agonists and Dipeptidyl Peptidase-4 Inhibitors.Circulation. 2017 Aug 29;136(9):849-870. doi: 10.1161/CIRCULATIONAHA.117.028136. Circulation. 2017. PMID: 28847797 Review.
-
Molecular mechanisms by which GLP-1 RA and DPP-4i induce insulin sensitivity.Life Sci. 2019 Oct 1;234:116776. doi: 10.1016/j.lfs.2019.116776. Epub 2019 Aug 16. Life Sci. 2019. PMID: 31425698 Review.
Cited by
-
Pterostilbene Fails to Rescue Insulin Secretion and Sensitivity in Multiple Murine Models of Diabetes.Nutrients. 2022 Sep 10;14(18):3741. doi: 10.3390/nu14183741. Nutrients. 2022. PMID: 36145121 Free PMC article.
-
Impact of hyperglycemia and antidiabetic medication on pancreatic uptake on [68Ga]Ga-DOTATOC PET/CT.Front Endocrinol (Lausanne). 2025 May 16;16:1536301. doi: 10.3389/fendo.2025.1536301. eCollection 2025. Front Endocrinol (Lausanne). 2025. PMID: 40453587 Free PMC article.
-
Disrupted and Elevated Circadian Secretion of Glucagon-Like Peptide-1 in a Murine Model of Type 2 Diabetes.Endocrinology. 2022 Sep 1;163(9):bqac118. doi: 10.1210/endocr/bqac118. Endocrinology. 2022. PMID: 35876276 Free PMC article.
-
Selective somatostatin receptor 5 inhibition improves hepatic insulin sensitivity.Pharmacol Res Perspect. 2023 Feb;11(1):e01043. doi: 10.1002/prp2.1043. Pharmacol Res Perspect. 2023. PMID: 36585794 Free PMC article.
-
Learn from failures and stay hopeful to GPR40, a GPCR target with robust efficacy, for therapy of metabolic disorders.Front Pharmacol. 2022 Oct 25;13:1043828. doi: 10.3389/fphar.2022.1043828. eCollection 2022. Front Pharmacol. 2022. PMID: 36386134 Free PMC article. Review.
References
-
- Adriaenssens AE, et al. Distribution and stimulus secretion coupling of enteroendocrine cells along the intestinal tract. Compr Physiol. 2018;8(4):1603–1638. - PubMed
Publication types
MeSH terms
Substances
LinkOut - more resources
Full Text Sources
Other Literature Sources
Medical
Molecular Biology Databases

